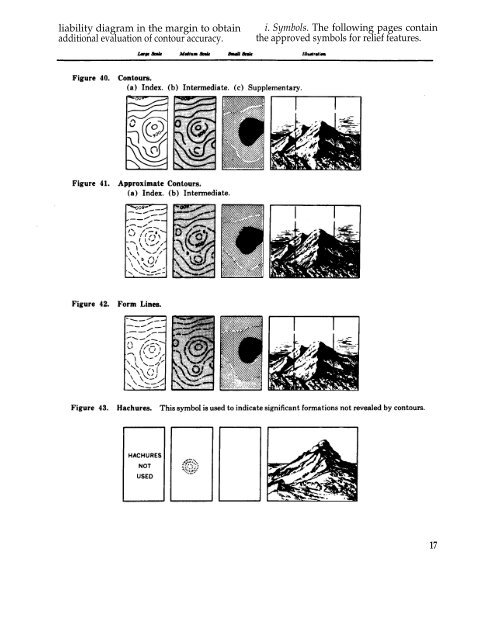
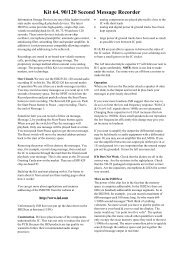
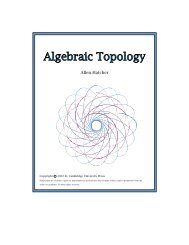
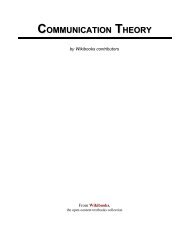
10. Relief Features a. Methods of Showing Relief. Depending upon the accuracy of information, the shapes of the terrain are shown on a map by lines representing contours, approximate contours, and form lines. Any one or all of these methods may be used on a single map. On medium- and small-scale maps, significant relief features may be shown by hachures when available data are insufficient to warrant the use of contours. On large- and medium-scale maps, the lines usually are printed in brown. Also, on mediumscale maps, hill shading usually is added over the brown lines, to print gray. This creates a three-dimensional effect and permits a ready appreciation of the terrain, since the hills and ridges stand out much as they would on a relief map. On small-scale maps the contour lines usually are printed in gray. Normally, on small-scale maps, the contours are supplemented by layer tints. A key box on each map indicates the elevation bands and their corresponding tints. b. Units of Measure. Except in the United States and a few other countries where the foot is the standard unit of measure, the elevations on military maps are in terms of the meter (39.37 inches or 3.28 feet). c. Contours. Relief normally is shown by contour lines. A contour line on a map represents an imaginary line on the earth’s surface, all points of which, within permissible tolerances, are of the same elevation above a fixed datum, usually mean sea level. To aid the map user, every fifth contour is a heavier line. These are commonly referred to as index contours. The remaining contours are called intermediate contours. In certain areas on a map, the normal contour interval is sometimes too large to present significant topographic formations correctly and supplementary half-interval contours are added. On small-scale maps, index contours are shown by using layer tints. d. Approximate Contours. Whenever there is any question as to the reliability of the source material or of the survey, approximate contours are substituted for normal contours. An approximate contour on a map represents an imaginary line on the earth’s surface, all points of which are estimated to be of the same elevation. As with normal contours, a distinc- 16 tion is made between index, intermediate, and supplementary contours. e. Contour Intervals. Contour lines are drawn on a map at definite elevation intervals. Using a given contour interval, the lines are far apart in flat areas and close together in hilly areas. Consequently, to present the best picture, the size of the contour interval used varies with the nature of the terrain, although normally a contour interval is constant in a series of map sheets. On sheets where the relief is generally flat or gently rolling, a smaller contour interval is used than on sheets where the relief is generally hilly. Scale also affects the contour interval; if the contour interval on a 1:25,000 scale map were 5 meters, for example, the interval used on a 1:50,000 map covering the same area would be 10 meters. f. Form Lines. When available information is insufficient to warrant the use of either normal or approximate contours, form lines are used. Normally, form lines are used only in areas outside the United States. Form lines collectively portray the general shapes of topographic features, but with little or no reference to a datum plane. They do not present an accurate representation of the terrain, but merely illustrate the general topographic shapes of an area. Since the lines are based on little or no control, their intervals cannot be used to estimate differences in elevations. g. Hachures. Hachures are used on mediumand small-scale maps to indicate promontories, where available data are insufficient to warrant the use of normal or approximate contours, but are sufficient to determine the location of the promontories. Hachures also are used in conjunction with normal or approximate, contours to indicate important promontories which would not be properly depicted otherwise, because of the contour interval and the nature of the terrain. h. Marginal Notes. Before reading relief from the map, the user should determine the contour interval and the nature of any other methods used to show relief. This information is found in the margin of the map either in the contour interval note or the layer tint box. Other special notes pertaining to relief are sometimes found in the lower margin. The user should also study the coverage diagram or re-
liability diagram in the margin to obtain i. <strong>Symbols</strong>. The following pages contain additional evaluation of contour accuracy. the approved symbols for relief features. 17