Annual Report 2004 - Gammon India
Annual Report 2004 - Gammon India
Annual Report 2004 - Gammon India

Create successful ePaper yourself
Turn your PDF publications into a flip-book with our unique Google optimized e-Paper software.
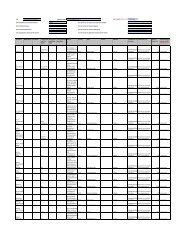
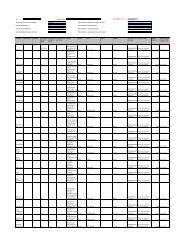
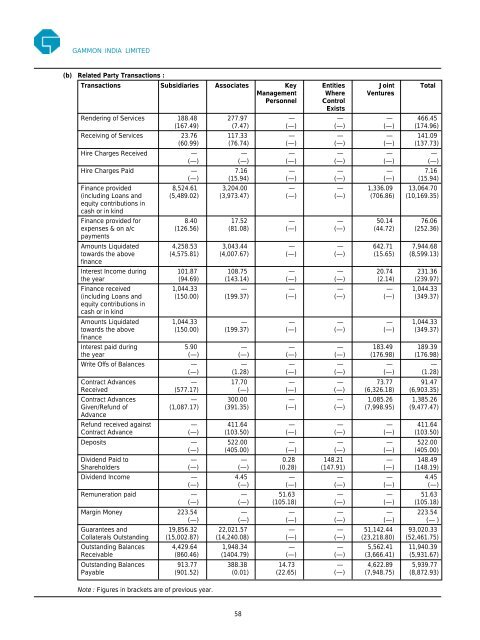
GAMMON INDIA LIMITED<br />
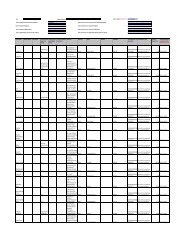
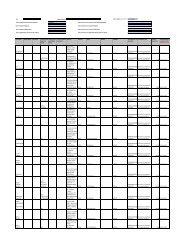
(b) Related Party Transactions :<br />
Transactions Subsidiaries Associates Key Entities Joint Total<br />
Management Where Ventures<br />
Personnel Control<br />
Exists<br />
Rendering of Services 188.48 277.97 — — — 466.45<br />
(167.49) (7.47) (—) (—) (—) (174.96)<br />
Receiving of Services 23.76 117.33 — — — 141.09<br />
(60.99) (76.74) (—) (—) (—) (137.73)<br />
Hire Charges Received — — — — — —<br />
(—) (—) (—) (—) (—) (—)<br />
Hire Charges Paid — 7.16 — — — 7.16<br />
(—) (15.94) (—) (—) (—) (15.94)<br />
Finance provided 8,524.61 3,204.00 — — 1,336.09 13,064.70<br />
(including Loans and<br />
equity contributions in<br />
cash or in kind<br />
(5,489.02) (3,973.47) (—) (—) (706.86) (10,169.35)<br />
Finance provided for 8.40 17.52 — — 50.14 76.06<br />
expenses & on a/c<br />
payments<br />
(126.56) (81.08) (—) (—) (44.72) (252.36)<br />
Amounts Liquidated 4,258.53 3,043.44 — — 642.71 7,944.68<br />
towards the above<br />
finance<br />
(4,575.81) (4,007.67) (—) (—) (15.65) (8,599.13)<br />
Interest Income during 101.87 108.75 — — 20.74 231.36<br />
the year (94.69) (143.14) (—) (—) (2.14) (239.97)<br />
Finance received 1,044.33 — — — — 1,044.33<br />
(including Loans and<br />
equity contributions in<br />
cash or in kind<br />
(150.00) (199.37) (—) (—) (—) (349.37)<br />
Amounts Liquidated 1,044.33 — — — — 1,044.33<br />
towards the above<br />
finance<br />
(150.00) (199.37) (—) (—) (—) (349.37)<br />
Interest paid during 5.90 — — — 183.49 189.39<br />
the year (—) (—) (—) (—) (176.98) (176.98)<br />
Write Offs of Balances — — — — — —<br />
(—) (1.28) (—) (—) (—) (1.28)<br />
Contract Advances — 17.70 — — 73.77 91.47<br />
Received (577.17) (—) (—) (—) (6,326.18) (6,903.35)<br />
Contract Advances — 300.00 — — 1,085.26 1,385.26<br />
Given/Refund of<br />
Advance<br />
(1,087.17) (391.35) (—) (—) (7,998.95) (9,477.47)<br />
Refund received against — 411.64 — — — 411.64<br />
Contract Advance (—) (103.50) (—) (—) (—) (103.50)<br />
Deposits — 522.00 — — — 522.00<br />
(—) (405.00) (—) (—) (—) (405.00)<br />
Dividend Paid to — — 0.28 148.21 — 148.49<br />
Shareholders (—) (—) (0.28) (147.91) (—) (148.19)<br />
Dividend Income — 4.45 — — — 4.45<br />
(—) (—) (—) (—) (—) (—)<br />
Remuneration paid — — 51.63 — — 51.63<br />
(—) (—) (105.18) (—) (—) (105.18)<br />
Margin Money 223.54 — — — — 223.54<br />
(—) (—) (—) (—) (—) (— )<br />
Guarantees and 19,856.32 22,021.57 — — 51,142.44 93,020.33<br />
Collaterals Outstanding (15,002.87) (14,240.08) (—) (—) (23,218.80) (52,461.75)<br />
Outstanding Balances 4,429.64 1,948.34 — — 5,562.41 11,940.39<br />
Receivable (860.46) (1404.79) (—) (—) (3,666.41) (5,931.67)<br />
Outstanding Balances 913.77 388.38 14.73 — 4,622.89 5,939.77<br />
Payable (901.52) (0.01) (22.65) (—) (7,948.75) (8,872.93)<br />
Note : Figures in brackets are of previous year.<br />
58