DOCUMENTATION OF LCWE DATA IN GABI 4 - GaBi Software
DOCUMENTATION OF LCWE DATA IN GABI 4 - GaBi Software
DOCUMENTATION OF LCWE DATA IN GABI 4 - GaBi Software

You also want an ePaper? Increase the reach of your titles
YUMPU automatically turns print PDFs into web optimized ePapers that Google loves.
DOCCUMENNTATION<br />
<strong>OF</strong> L<strong>LCWE</strong><br />
<strong>DATA</strong> <strong>IN</strong><br />
GABBI<br />
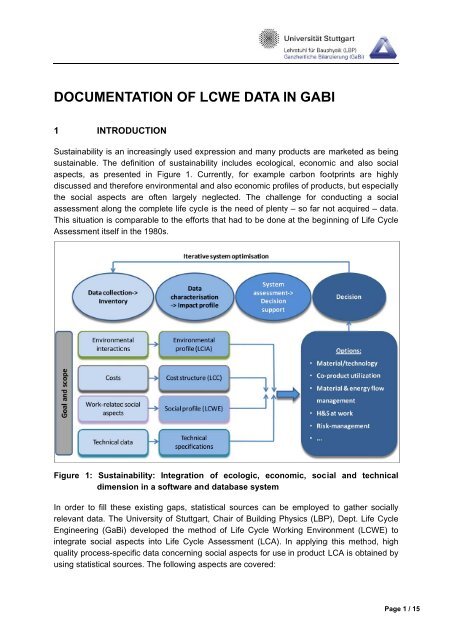
1<br />
Sustainability<br />
is ann<br />
increasing gly used expression<br />
an nd many pr roducts are marketed as a being<br />
sustainaable.<br />
The ddefinition<br />
of f sustainabbility<br />
include es ecologic cal, econommic<br />
and als so social<br />
aspectss,<br />
as preseented<br />
in Fi igure 1. Cuurrently,<br />
fo or example carbon foootprints<br />
are<br />
highly<br />
discussed<br />
and therrefore<br />
envir ronmental aand<br />
also eco onomic prof files of prodducts,<br />
but es specially<br />
the soccial<br />
aspectss<br />
are often n largely nneglected.<br />
The challe enge for coonducting<br />
a social<br />
assessmment<br />
along the comple ete life cyclee<br />
is the nee ed of plenty y – so far nnot<br />
acquired d – data.<br />
This situuation<br />
is coomparable<br />
to t the effortts<br />
that had to be done at the beginning<br />
of Life<br />
Cycle<br />
Assessmment<br />
itself iin<br />
the 1980s s.<br />
Figure<br />
<strong>IN</strong>TROODUCTION<br />
N<br />
1: Sustaiinability:<br />
Integration<br />
of ecologic,<br />
econo omic, soccial<br />
and te echnical<br />
dimenssion<br />
in a so oftware and<br />
database e system<br />
In order<br />
to fill thesse<br />
existing gaps, stattistical<br />
sour rces can be e employedd<br />
to gather socially<br />
relevantt<br />
data. Thee<br />
University of Stuttgarrt,<br />
Chair of Building Ph hysics (LBPP),<br />
Dept. Life<br />
Cycle<br />
Engineeering<br />
(<strong>GaBi</strong>i)<br />
develope ed the methhod<br />
of Life Cycle Wor rking Enviroonment<br />
(LC CWE) to<br />
integratte<br />
social asspects<br />
into Life Cycle Assessme ent (LCA). In applyingg<br />
this method,<br />
high<br />
quality pprocess-speecific<br />
data concerning c social aspe ects for use in product LCA is obta ained by<br />
using sttatistical<br />
souurces.<br />
The following asspects<br />
are covered: c<br />
Page 1 / 15
• AAmount<br />
andd<br />
qualification<br />
level of wwork<br />
•<br />
The nexxt<br />
paragrapphs<br />
will doc cument the method tha at was applied<br />
to geneerate<br />
social l profiles<br />
for all unit<br />
processees<br />
in the Ga aBi databasse.<br />
2<br />
When thinking<br />
aboout<br />
social effects, e onee<br />
of the firs st questions s to considder<br />
is which h criteria<br />
should be measured<br />
and which w indicaators<br />
should<br />
be emp ployed to ddescribe<br />
the<br />
social<br />
implicattions<br />
of a huuman<br />
action n. For the mmethod<br />
desc cribed here,<br />
the objectiive<br />
was to integrate<br />
social aassessmentt<br />
into the already a exissting<br />
metho odology of Life L Cycle EEngineering<br />
g (LCE).<br />
That immposes<br />
somme<br />
restrictio ons upon tthe<br />
choice of indicators.<br />
Therefoore,<br />
the crit teria the<br />
employeed<br />
indicatorrs<br />
have to comply c with are describ bed in the fo ollowing.<br />
2.1<br />
The soccial<br />
goals shhould<br />
have an actual reelevance<br />
and<br />
a broad internationaal<br />
consensu us. They<br />
should iif<br />
necessaryy<br />
allow for the<br />
inclusionn<br />
of other societal<br />
or cu ultural valuees.<br />
2.2<br />
The indicators<br />
and their ascer rtainment shhould<br />
be im mpartial and revisable.<br />
2.3 CCompleteness<br />
and attributabbility<br />
1. AAll<br />
relevant goals shou uld be addreessed.<br />
2. TThe<br />
indicatoor<br />
should co over the resspective<br />
social<br />
goal co omprehensivvely.<br />
2.4 QQuantitatiiveness<br />
The inddicator<br />
shouuld<br />
compris se a quantittative<br />
meas sure in order<br />
to be agggregated<br />
over o the<br />
whole life<br />
cycle.<br />
2.5<br />
Health and safety.<br />
SELECCTION<br />
CR RITERIA FOOR<br />
<strong>IN</strong>DICA ATORS<br />
Relevancee<br />
and Con nsensus<br />
Impartialitty<br />
3. TThe<br />
indicattor<br />
should be b clearly aand<br />
complet tely attributable<br />
to the respective product<br />
or proceess.<br />
Pertinencce<br />
of indica ator sum<br />
The summ<br />
of the indicator<br />
valu ues of all pprocesses<br />
of o one site, company, industrial sector s or<br />
country should acccurately<br />
des scribe the ovverall<br />
situat tion.<br />
Page 2 / 15
2.6<br />
2.7 CComparabbility<br />
of targets<br />
andd<br />
indicator rs<br />
1. TThe<br />
goals aand<br />
indicato ors should bbe<br />
compara able in an international<br />
context.<br />
2. TThe<br />
goals aand<br />
indicato ors should bbe<br />
compara able between<br />
different iindustries.<br />
2.8<br />
The goaals<br />
and inddicators<br />
sho ould have a direct rela ation to pro oducts or prrocesses<br />
or<br />
should<br />
facilitatee<br />
to be relatted<br />
to them.<br />
2.9 AAverage<br />
vvalidity<br />
The indicators<br />
should<br />
remain valid for aveerage<br />
mode elling, i.e. useful<br />
for LCCWE<br />
databa ases.<br />
2.10 SSystem<br />
booundaries<br />
s, cut-off ccriteria,<br />
re eference sy ystem<br />
They arre<br />
chosen iin<br />
accordan nce with thee<br />
ISO 1404 40 and 140 044 (CEN 22006),<br />
whereas<br />
the<br />
“environnmental<br />
releevance”<br />
is substituted s by the “social<br />
relevanc ce”.<br />
2.11 TTemporal<br />
stability and a time sseries<br />
The callculation<br />
of the social indicators sshould<br />
be repeatable r for other ye years, which h means<br />
that timee<br />
series shoow<br />
the actu ual changess.<br />
2.12<br />
The datta<br />
collectionn<br />
should be viable undeer<br />
justifiable e effort.<br />
3<br />
The nexxt<br />
paragrapphs<br />
will exp plain the L<strong>LCWE</strong><br />
meth hod develop ped at Univversity<br />
of Stuttgart, S<br />
LBP-GaaBi.<br />
3.1<br />
No Overlaap<br />
There sshould<br />
be nno<br />
overlap between thhe<br />
different indicators to avoid doouble<br />
counting<br />
and<br />
thereforre<br />
overvaluaation<br />
of sing gle effects.<br />
Product/PProcess-re<br />
elatednesss<br />
Data availlability/eff<br />
fort<br />
<strong>LCWE</strong>E<br />
METHOD D DESCRIPPTION<br />
Indicatorss<br />
chosen for f integraation<br />
into LCA<br />
Table 1 shows thhe<br />
indicators<br />
chosen to be inte egrated into o the Life<br />
methodology<br />
basinng<br />
on the cr riteria descrribed<br />
above.<br />
Cycle Eng gineering<br />
Page 3 / 15
Table 1:<br />
Social Inddicators<br />
ch hosen<br />
Qualiffied<br />
workingg<br />
time<br />
3.2<br />
Heaalth<br />
and Safeety<br />
In geneeral,<br />
both, a bottom-up p and a topp-down<br />
app proach for data d acquissition<br />
do ex xist. The<br />
bottom-up<br />
approacch<br />
would be<br />
the separate<br />
acquis sition of dat ta for everyy<br />
unit proce ess. The<br />
top-dowwn<br />
approachh<br />
correspon nds to the prorating<br />
of aggregate a data d to single<br />
processe es.<br />
3.2.1<br />
Applyingg<br />
this approach,<br />
social<br />
indicatoors<br />
have to o be collec cted for eaach<br />
process s in the<br />
producttion<br />
chain. HHere<br />
the pr roblem occuurs<br />
that suc ch data is ra arely availaable<br />
at the moment, m<br />
becausee<br />
a meaningful<br />
use and comprrehensive<br />
approach a for f such inndicators<br />
was w non-<br />
existentt<br />
so far. The<br />
initiation n of a conntinuous<br />
as scertainment<br />
of this data<br />
would be cost<br />
intensivve<br />
and time consuming.<br />
Due to this, for the<br />
beginning g the top-down<br />
attemp pt is chosen<br />
for the L<strong>LCWE</strong><br />
meth hodology<br />
developped<br />
at the UUniversity<br />
of o Stuttgart. . Neverthele ess, the da ata acquisitiion<br />
for ever ry single<br />
processs<br />
remains thhe<br />
middle-te erm to long-term<br />
goal because b of its more preecise<br />
result ts.<br />
3.2.2<br />
Group<br />
Data acquuisition<br />
me ethod<br />
Indica ator<br />
General Qualification n level A (GQ QL A)<br />
General Qualification n level B (GQ QL B)<br />
General Qualification n level C (GQ QL C)<br />
General Qualification n level D (GQ QL D)<br />
General Qualification n level E (GQ QL E)<br />
Total worki ing time<br />
Lethal acc cidents<br />
Non-lethal accidents a<br />
Separatee<br />
data acq quisition foor<br />
unit pro ocesses<br />
Prorationn<br />
of aggre egated datta<br />
to singl le process s<br />
Statisticcal<br />
data cooncerning<br />
social s issuees<br />
is available<br />
for most m of thee<br />
highly de eveloped<br />
countriees,<br />
for somee<br />
of them de etailed enouugh<br />
to use them t in the <strong>LCWE</strong> metthodology.<br />
To proraate<br />
this dataa<br />
down to process p leveel,<br />
the follow wing assum mptions are aapplied:<br />
Unit<br />
[sec c]<br />
[sec c]<br />
[sec c]<br />
[sec c]<br />
[sec c]<br />
[sec c]<br />
[case es]<br />
[case es]<br />
1. TThe<br />
social impacts of f a processs<br />
are propo ortional rela ated to the amount of f human<br />
llabour<br />
of the<br />
process.<br />
Page 4 / 15
2. TThe<br />
amounnt<br />
of human n labour of a process is i related to o the effort made to ad dd value<br />
bby<br />
processiing<br />
(which is<br />
equivalennt<br />
to the add ded-value itself).<br />
The aboove<br />
assumpptions<br />
are valid<br />
within tthe<br />
same in ndustry and in the samee<br />
country only.<br />
In contrrast<br />
to the ssituation<br />
for r environmeental<br />
Input-O Output table es, the amoount<br />
of hum man work<br />
is very well correlated<br />
with the<br />
econommic<br />
value ad dded of a process. Thhe<br />
precision<br />
of the<br />
results tthat<br />
can bee<br />
reached is s hence higgh<br />
enough to t be used as a reasonable<br />
starti ing point<br />
for modelling<br />
on the<br />
product le evel.<br />
Figure 2 shows thhe<br />
different t steps of tthe<br />
approac ch developed<br />
at the UUniversity<br />
Stuttgart<br />
aiming aat<br />
the calcuulation<br />
of pro ocess speccific<br />
<strong>LCWE</strong> data. d<br />
Figure 2: Generattion<br />
of proc cess-specific<br />
social information<br />
n<br />
In the foollowing<br />
parragraphs,<br />
th he steps shoown<br />
in Figu ure 2 are de escribed in mmore<br />
detail. .<br />
3.3 GGeneral<br />
qqualificatio<br />
on level off<br />
jobs<br />
In the first step, single pro ofessions aare<br />
allocate ed to different<br />
qualifiication<br />
leve els. The<br />
classificcation<br />
is made<br />
accord ding to the Internation nal Standar rd Classificcation<br />
of Ed ducation<br />
(UNESCCO<br />
<strong>IN</strong>STITUTTE<br />
FOR STATISTICS<br />
19997).<br />
This cla assification was develooped<br />
in 199 97 by the<br />
UNESCCO<br />
in orderr<br />
to classify y and charaacterize<br />
diff ferent school<br />
types annd<br />
school systems. s<br />
The ISCCED<br />
addreesses<br />
the required r quualification<br />
of a job po osition rathher<br />
than the<br />
actual<br />
qualificaation<br />
of the employees s. It classifiees<br />
seven dif fferent quali ification leveels<br />
(Level 0 – Level<br />
6). In thhe<br />
course of the development<br />
oof<br />
this meth hod Level 0, Level 1 and Level 2 were<br />
combineed<br />
to one leevel.<br />
The distinctions<br />
mmade<br />
in thes se levels for<br />
the require red qualifica ation of a<br />
job are not relevant<br />
enough to o be kept in the classification<br />
for th he developeed<br />
method.<br />
Page 5 / 15
3.4<br />
In the seecond<br />
step,<br />
the profes ssion distribution<br />
per industry<br />
is ca alculated viaa<br />
a matrix based b on<br />
the SICC<br />
code (OCCCUPATIONA<br />
AL HEALTH AND SAFE ETY ADM<strong>IN</strong>IS STRATION 1992).<br />
In th he table<br />
elementts<br />
of the maatrix,<br />
the nu umber of poositions<br />
of each e profession<br />
in every<br />
single industry<br />
is<br />
presentted.<br />
From thhis,<br />
the emp ployee profile<br />
of each industry<br />
can n be identifieed.<br />
3.5 SSeconds<br />
oof<br />
labour per VA<br />
The secconds<br />
of labour<br />
per va alue added are derive ed from the U.S. Economic<br />
Census<br />
(U.S.<br />
CENSUSS<br />
BUREAU 11997).<br />
This s statistic ggives<br />
inform mation abou ut the nummber<br />
of employees,<br />
averagee<br />
number off<br />
production n workers, pproduction<br />
workers' ho ours, cost of contract work w and<br />
the valuue<br />
added. TThe<br />
value ad dded given in the statis stic is calcu ulated from tthe<br />
income through<br />
the salee<br />
of the prooduced<br />
goo ods less thee<br />
expenditu ures for aux xiliary mateerials,<br />
interm mediates<br />
and/or resources and the expenditurees<br />
for sub bcontracting g. The value<br />
added for the<br />
calculattion<br />
of the sseconds<br />
of labour per VA – relation<br />
is theref fore correctted<br />
by this number.<br />
The woorking<br />
time is only qu uoted for wworkers,<br />
no ot for appo ointees. It iis<br />
assumed d in the<br />
methodology,<br />
that an appointe ee works the<br />
same hou urs per year r as a workeer.<br />
3.6 QQualificattional<br />
labo our profilee<br />
of the ind dustry<br />
In the next<br />
step, thhe<br />
total work king time peer<br />
value add ded can be broken dowwn<br />
with the e support<br />
of the taables<br />
and mmatrixes<br />
ge enerated in the steps before. b The result is a qualificatio on profile<br />
of each industry per<br />
value ad dded generrated.<br />
This qualification n profile shhows<br />
the am mount of<br />
workingg<br />
time in eacch<br />
of the fiv ve qualificattion<br />
levels to t generate one Euro vvalue<br />
added d. These<br />
values, same as thhe<br />
total wor rking to gennerate<br />
one Euro E value added, varry<br />
between different<br />
industriees.<br />
3.7<br />
For thee<br />
calculationn<br />
of non-fa atal injuriess,<br />
two kinds s of data are a availabble<br />
(UNITED STATES<br />
DEPARTTMENT<br />
<strong>OF</strong> LAABOR<br />
1999) : The injuriees<br />
listed as injury rates s, as well ass<br />
absolute numbers n<br />
of injuries<br />
per inddustry.<br />
The injury ratees<br />
present the numbe ers of injurries<br />
per pe erformed<br />
workingg<br />
time. Thesse<br />
rates are e corresponnding<br />
with the<br />
risk of th he employeees<br />
to get in njured in<br />
the speecific<br />
industrry.<br />
The abs solute ratess<br />
give the to otal number<br />
of injuriess<br />
without ta aking the<br />
total number<br />
of emmployees<br />
in the specificc<br />
industry in nto account t. In the conntext<br />
of the e method<br />
describeed<br />
here, thhe<br />
non – fa atal injuriess<br />
have to be b related to t the totall<br />
working time<br />
and<br />
respectively<br />
to the<br />
value ad dded in orrder<br />
to cla assify them m to the ddifferent<br />
pro ocesses.<br />
Therefoore,<br />
the ratee<br />
of non-fata al injuries iss<br />
used.<br />
3.8<br />
Employeee<br />
profile of f the indusstry<br />
Rate of noon-fatal<br />
injuries<br />
perr<br />
VA<br />
Rate of fatal<br />
injuries<br />
per VA<br />
The fataal<br />
injuries aare<br />
also collected<br />
and ppublished<br />
by b the U. S. Departmennt<br />
of Labor (UNITED<br />
STATES DEPARTMEENT<br />
<strong>OF</strong> LAB BOR 1999). For the fa atal injuries s only absoolute<br />
numb bers are<br />
Page 6 / 15
available.<br />
A statemment<br />
concer rning the rissk<br />
of fatal in njuries in the<br />
different industries therefore<br />
is not poossible.<br />
In orderr<br />
to relate thhe<br />
fatal injuries<br />
to the ttotal<br />
workin ng time and hence to thhe<br />
value added,<br />
the<br />
workingg<br />
time for eevery<br />
industry<br />
has to be available.<br />
For the reasons exxplained<br />
in the last<br />
paragraaph,<br />
values should no ot be drawnn<br />
from diff ferent sourc ces. So vaalues<br />
from different<br />
tables, generated based on th he source mmentioned<br />
above on non-fatal n annd<br />
fatal injuries,<br />
are<br />
used: TThe<br />
total woorking<br />
time for each inddustry<br />
is de erived from the non-fattal<br />
injuries rate and<br />
from thee<br />
absolute nnumber<br />
of non-fatal n injuries.<br />
3.9 SSocial<br />
Proofile<br />
of the e industryy<br />
The soccial<br />
profile ffor<br />
each ind dustry includdes<br />
the wo orking time in different qualification<br />
levels,<br />
the non-fatal<br />
and the<br />
fatal inju uries, each related to one o Euro of f value addeed<br />
generate ed in the<br />
respective<br />
industryy.<br />
3.10<br />
Prices forr<br />
<strong>GaBi</strong>-Flows<br />
For relaating<br />
the social<br />
data to o LCA proceess<br />
data, th he value added<br />
of eachh<br />
LCA proc cess has<br />
to be iddentified.<br />
Thhis<br />
is done by calculating<br />
the delta<br />
of prices<br />
between the output and the<br />
input floows<br />
of eachh<br />
process. Therefore, for all mate erials, intermediate<br />
prooducts<br />
or products, p<br />
as well as variouss<br />
energy fl luxes, whicch<br />
go in an nd out of processes, p prices hav ve to be<br />
determined<br />
and asssigned.<br />
Sin nce the prooduct<br />
prices s depend on n a dynamicc<br />
market, th he same<br />
referencce<br />
period ffor<br />
both the e prices annd<br />
for the identificatio on of the vvalue<br />
added d of the<br />
industriees<br />
should be selected d. In this ccase<br />
the calculation<br />
is<br />
made wiith<br />
annual average<br />
values oof<br />
the same<br />
reference e period. A foreign trade<br />
statistic is used to provide co onsistent<br />
price daata<br />
(U.S. CEENSUS<br />
BURE EAU 2002A, U.S. CENSU US BUREAU 2002B). 2<br />
For moost<br />
of the fflows,<br />
price es can be calculated regarding quantities and total value v of<br />
exported<br />
commodiities.<br />
In cas ses where tthis<br />
is not possible, p pr rices are esstimated<br />
pe er expert<br />
judgemeent<br />
using tthe<br />
assump ptions that tthere<br />
are no n negative e value adddeds<br />
and th hat price<br />
ranges can be esttimated<br />
on the basis oof<br />
the lowe er price of a preliminaary<br />
product and the<br />
higher pprice<br />
of a suubsequent<br />
product. p This<br />
kind of es stimation ha as an impacct<br />
on the res sult if<br />
1. tthe<br />
according<br />
flow pas sses from onne<br />
industry into anothe er industry aand<br />
2. tthe<br />
social pprofile<br />
of bot th industriess<br />
varies.<br />
3.11 VValue<br />
Addded<br />
of GaB Bi-Processses<br />
In orderr<br />
to calculatte<br />
the value added of a single proc cess, the to otal value off<br />
the incoming<br />
flows<br />
is subtrracted<br />
fromm<br />
the total value of thhe<br />
outgoing g flows of a process. The total value is<br />
calculatted<br />
by multiplying<br />
the amount of the flow wi ith its price and then bby<br />
summing g up the<br />
values oof<br />
all flows.<br />
Page 7 / 15
This steep<br />
requires an access s to a life cyycle<br />
model on a unit process levvel<br />
of the particular p<br />
productt.<br />
Furthermore,<br />
as consistent<br />
ass<br />
possible data d are necessary<br />
foor<br />
all econ nomically<br />
relevantt<br />
material and<br />
energy flows, f whichh<br />
flow in and<br />
out the un nit processees.<br />
3.12<br />
To geneerate<br />
a LCWWE<br />
process s data set, each individ dual proces ss must be classified to<br />
one of<br />
the variious<br />
industrries.<br />
Subse equently, thee<br />
social pro ofile of the industry is multiplied with the<br />
value addded<br />
of the individual process. p In doing this, the reference<br />
to one EEuro<br />
of valu ue added<br />
is lost aand<br />
the induustry<br />
profile is scaled on<br />
a unit pro ocess.<br />
3.13<br />
In the ccourse<br />
of the<br />
balance calculation, c the values of unit processes<br />
are e summarize ed along<br />
the valuue<br />
chain according<br />
to o the summmarization<br />
of o LCA inventory<br />
dataa<br />
and can thus be<br />
evaluateed<br />
equally.<br />
3.14<br />
Process DData<br />
Sets<br />
Evaluationn<br />
Processinng<br />
of Data(-sets)<br />
in the Softw ware<br />
In the cclassic<br />
LCAA<br />
the particu ular processses<br />
are sc caled accord ding to theiir<br />
connectio ons over<br />
input annd<br />
output floows.<br />
Beside es, the elemmentary<br />
flow ws, which exceed e the system bou undaries<br />
and thus<br />
cause an impact, are e scaled witth<br />
the factor<br />
of their or riginal proceess.<br />
In this way, w the<br />
contribuution<br />
of eaach<br />
individu ual processs<br />
to the fu unction of the t total sy system is weighted w<br />
correctlyy.<br />
By includding<br />
social data into LLCA<br />
datase ets, the sam me weightinng<br />
principle es apply,<br />
thus leaading<br />
to correct<br />
results that can bee<br />
evaluated in accordance<br />
to LCAA<br />
results.<br />
3.15 GGeneratioon<br />
of Indic cators andd<br />
Evaluatio on<br />
In classsic<br />
LCA methodolo ogy, the summation n is follo owed by classificatio on and<br />
characteerization.<br />
Inn<br />
contrast, the indicattors<br />
for the social aspects<br />
are chhosen<br />
the way w that<br />
they eaach<br />
build iits<br />
own cla ass. The sstep<br />
of the e classification<br />
as relation<br />
of particular p<br />
contribuutors<br />
to a ppotential<br />
kin nd of impacct<br />
therefore is superflu uous. Withinn<br />
each clas ss, there<br />
are no contributorrs<br />
that hav ve to be vvalued<br />
differently.<br />
Com mpared to a consider ration of<br />
ecologiccal<br />
values, a characte erization thherefore<br />
is not necess sary. This can be seen<br />
as a<br />
fundamental<br />
differrence<br />
between<br />
ecologgical<br />
LCA and social aspects cconsideratio<br />
on within<br />
LCA; in case of the<br />
ecologica al LCA the interim bala ance of mass<br />
and eneergy<br />
flows is s drown.<br />
These flows are then misca alculated inn<br />
respect to t their va arious envirronmental<br />
impacts.<br />
Howeveer,<br />
when eexamining<br />
social asppects,<br />
the indicators are seleccted<br />
so th hat they<br />
correspond<br />
directlyy<br />
with a soc cial aspect. The evalua ation of indic cators howeever<br />
can be e done in<br />
analogyy<br />
to the claassic<br />
LCA-m method: Eaach<br />
indicato or receives s its own immpact<br />
category<br />
(or<br />
rather for each impact ca ategory a described indicator is to be found) an nd each<br />
characteerization<br />
factor<br />
gets the<br />
value onee.<br />
Page 8 / 15
3.16 VValidity<br />
As explained<br />
abovve,<br />
a respec ctive validitty<br />
of a resu ult depends on the seleection<br />
of th he social<br />
indicatoors,<br />
on their<br />
ability to o be summmed<br />
up, on an ability to be weiighted<br />
that can be<br />
comparred<br />
with maaterial<br />
and energy e flowws<br />
and, of course, c on the availabbility<br />
of data a for the<br />
unit proocesses.<br />
AAll<br />
these co onditions aare<br />
given fo or the wor rking time values in different<br />
qualificaation<br />
levels,<br />
the non-fa atal and fataal<br />
injuries presented<br />
ab bove. If there<br />
is a poss sibility to<br />
relate thhem<br />
to the basic value e working timme,<br />
also for r other socia al factors too<br />
be develo oped, the<br />
criteriass<br />
of summinng<br />
up and weighting w caan<br />
be accomplished.<br />
The T availabbility<br />
of data a is to be<br />
proved separatelyy,<br />
and a ge eneral validdity<br />
or rath her reasona ableness sshould<br />
be used u as<br />
primary selection ccriterion.<br />
4<br />
To showw<br />
the potenntials<br />
and va alidate the feasibility of o the asses ssment metthod,<br />
it was s applied<br />
in severral<br />
projects so far. There<br />
are princcipally<br />
two possibilities<br />
p to use the <strong>LCWE</strong> method:<br />
1.<br />
Use of thee<br />
comprehe ensive andd<br />
consistent<br />
backgrou und databaase.<br />
The da ata was<br />
ccalculated<br />
aas<br />
explained<br />
above.<br />
2. GGathering<br />
oof<br />
own, project<br />
and proocess<br />
specific<br />
data. The<br />
data can be inserted d directly<br />
in the <strong>LCWE</strong><br />
tab, when n creating a new proce ess.<br />
For the example, ddata<br />
from the<br />
backgrouund<br />
databas se is used in n order to sshow<br />
the application<br />
of the mmethod.<br />
Twoo<br />
different kinds k of plasstic<br />
are com mpared.<br />
4.1<br />
Concernning<br />
the soccial<br />
implicat tions, the wwhole<br />
production<br />
phase e of the diffeerent<br />
alternatives<br />
is<br />
assesseed<br />
including<br />
all upstr ream valuee<br />
chains (p production and supplly<br />
of all precursor p<br />
substannces,<br />
operatting<br />
supplie es, auxiliary materials, energies etc.).<br />
In the ffollowing,<br />
thhe<br />
results for the asssessment<br />
of o two route es will be sshown<br />
exemplarily:<br />
Polyethylene<br />
fibress<br />
production n and the prroduction<br />
of f Polyethyle ene terephthhalate<br />
(PET T) fibres.<br />
4.2<br />
EXAMMPLE<br />
Descriptioon<br />
of the assessed a system<br />
Results<br />
Table 2 shows thee<br />
working time t distribbution<br />
into the t general<br />
qualificatioon<br />
levels ( GQL) in<br />
secondss,<br />
that is reelated<br />
to jobs<br />
with thee<br />
respective e qualificatio on level ass<br />
requireme ent. Jobs<br />
with a GGQL<br />
A do hhave<br />
the hig ghest qualiffication<br />
as prerequisite<br />
p e, Jobs withh<br />
a GQL E relate to<br />
work wwith<br />
low qualification<br />
requirement<br />
r ts. The tot tal working time, beinng<br />
the sum m of the<br />
numberrs<br />
listed under<br />
the diff ferent GQLLs,<br />
is the su um of all human<br />
labouur<br />
employe ed in the<br />
producttion<br />
of 1 kg plastic.<br />
As Table<br />
2 and FFigure<br />
3 pre esent, the plastic PET T production<br />
requires considerab bly more<br />
human labour thaan<br />
PE prod duction. This<br />
is cause ed by the more compplex<br />
manuf facturing<br />
processs<br />
for PET than<br />
for PE.<br />
Page 9 / 15
Table 2<br />
Quualification<br />
Level<br />
GQL A [s]<br />
GQL B [s]<br />
GQL C [ss]<br />
GQL D [ss]<br />
GQL E [s]<br />
Tottal<br />
working tiime<br />
[s]<br />
Lethhal<br />
accidents [cases]<br />
Non-leethal<br />
accidennts<br />
[cases]<br />
The graaphics<br />
also show that in i industriall<br />
process ch hains rather<br />
few jobs wwithout<br />
qua alification<br />
and witth<br />
a very high qualifi ication cann<br />
be found.<br />
Industry requires a minimum level of<br />
qualificaation<br />
and only<br />
few peo ople with a very high qualification<br />
q n on the maanagement<br />
level. A<br />
higher sshare<br />
of wworkers<br />
with hout qualificcation<br />
is ra ather found in the serrvice<br />
sector<br />
(sales,<br />
direct seervices<br />
etc. ).<br />
250,0<br />
200,0<br />
150,0<br />
100,0<br />
50,0<br />
Qualified working time in [s] 2: Working<br />
0,0<br />
time and accidents a fo for the prod duction of 1 kg PE annd<br />
1 kg PET T<br />
Quualifiedd<br />
Workking<br />
Timme<br />
PE<br />
Figure 3: Qualifiedd<br />
working time for thhe<br />
production<br />
of 1 kg PE and PEET<br />
PE<br />
1.4<br />
11.0<br />
14.4<br />
15.1<br />
7.6<br />
49.5<br />
3,23E-07<br />
5,45E-10<br />
Figure 4 and Figurre<br />
5 show the<br />
amount of non-leth hal and letha al accidentss<br />
for the pro oduction<br />
of 1 kg PE or PET. . The numb bers are verry<br />
small as they are related<br />
to thee<br />
functional unit of 1<br />
kilogramm.<br />
PET<br />
PET<br />
9.9<br />
61.1<br />
72.5<br />
59.4<br />
27.2<br />
230.1<br />
11,06E-06<br />
11,03E-09<br />
GQL<br />
E [s]<br />
GQL<br />
D [s]<br />
GQL<br />
C [s]<br />
GQL<br />
B [s]<br />
GQL<br />
A [s]<br />
Page 10 / 15
Non‐lethal accidents [cases]<br />
Figure 4: Non-lethhal<br />
acciden nts caused by the pro oduction of f 1 kg PE aand<br />
PET<br />
The geeneral<br />
results<br />
are sim milar to quaalified<br />
work king time: There are significant tly more<br />
accidennts<br />
when producing<br />
a kg of PETT<br />
than PE.<br />
Again thi is is due to the more e labour<br />
intensivve<br />
and moree<br />
complex manufacturi<br />
m ng process of PET.<br />
Lethal accidents [cases]<br />
1,20E‐09<br />
1,00E‐09<br />
8,00E‐10<br />
6,00E‐10<br />
4,00E‐10<br />
2,00E‐10<br />
0,00E+00<br />
1,20E‐066<br />
1,00E‐066<br />
8,00E‐077<br />
6,00E‐077<br />
4,00E‐077<br />
2,00E‐077<br />
0,00E+000<br />
NNon‐lethhal<br />
accidents<br />
PE<br />
Lethal<br />
accideents<br />
PE<br />
PPET<br />
Figure 5: Lethal aaccidents<br />
caused c by tthe<br />
produc ction of 1 kg g PE and PPET<br />
PET<br />
Page 11 / 15
6<br />
The meethod<br />
develooped<br />
and th he respectivve<br />
backgrou und database<br />
is a firstt,<br />
promising attempt<br />
to addreess<br />
the social<br />
pillar of sustainabilit<br />
s ty in the sco ope of the well w establisshed<br />
metho od of Life<br />
Cycle AAssessmennt<br />
and Life e Cycle Enngineering.<br />
Social eff fects that would hav ve been<br />
neglecteed<br />
by an LLCA<br />
can be e included aand<br />
show remarkable<br />
results. Prooblem<br />
shifting<br />
from<br />
the environmental<br />
realm to the e social fieldd<br />
can be av voided.<br />
The exaample<br />
showws,<br />
that the results of thhe<br />
<strong>LCWE</strong> method m can be used simmilarly<br />
to the e results<br />
of an LLCA:<br />
Informmation<br />
is pr resented onn<br />
a unit pro ocess level<br />
and also project or process<br />
specific informatioon<br />
can be inserted. IInformation<br />
about soc cial issues is summa able and<br />
scalablee<br />
as the LCCA<br />
user is fa amiliar with from the environment<br />
e tal LCA. In the compre ehensive<br />
backgroound<br />
databaase,<br />
informa ation for alll<br />
unit processes<br />
regard ding the quaalified<br />
work king time<br />
and lethhal<br />
and noon-lethal<br />
ac ccidents is available. Additionally y, informatiion<br />
concern ning the<br />
following<br />
indicatorss<br />
can be ins serted in thee<br />
<strong>GaBi</strong> softw ware in the <strong>LCWE</strong> tab by the user r:<br />
AActual<br />
wommen<br />
employment<br />
CChild<br />
labour<br />
<br />
<br />
<br />
<br />
<br />
<br />
Discussioon<br />
and out tlook<br />
Holistic and forwaard-looking<br />
decisions must be based b on a broad baasis<br />
of all relevant<br />
information.<br />
The soocial<br />
dimens sion of humman<br />
actions clearly mus st be considdered.<br />
Discrimination<br />
in job ac ccess<br />
Forced laboour<br />
Hazardous child labour<br />
No collectivve<br />
bargainin ng<br />
No right to oorganise<br />
Unequal remuneration<br />
All inforrmation<br />
has to be in relation<br />
to working<br />
time in<br />
seconds.<br />
Howeveer,<br />
it has to be stated that due too<br />
the above mentioned restrictionss<br />
for indicators,<br />
not<br />
all relevvant<br />
social information can be acccounted<br />
for r by this me ethod, so faar.<br />
Additional<br />
social<br />
effects hhave<br />
to be considered in future deevelopment<br />
t of the meth hodology.<br />
As all <strong>LCWE</strong><br />
data currently pr resent in thee<br />
<strong>GaBi</strong> data abase is de erived from US statistic cs, it can<br />
be regaarded<br />
valid for all coun ntries holdinng<br />
similar economic e and a socio-ecconomic<br />
co onditions<br />
than thee<br />
US.<br />
Using thhe<br />
<strong>LCWE</strong> ddata<br />
for decision<br />
makinng,<br />
it has to be conside ered that ass<br />
the data is s derived<br />
from staatistics,<br />
it dooes<br />
not rep present exacct<br />
site spec cific situations<br />
and shoould<br />
only be e used to<br />
comparre<br />
for exammple<br />
genera al product options. For<br />
the com mparison off<br />
social aspects<br />
of<br />
different<br />
suppliers, company-s specific dataa<br />
has to be used.<br />
To conclude<br />
with, , the social<br />
database can be used<br />
as a hotspot daatabase<br />
in order to<br />
examinee<br />
the main contributor rs to social profiles along<br />
the pro ocess chainns<br />
of produ ucts. For<br />
these mmain<br />
contributors,<br />
site specific s soccial<br />
data can n be gathere ed in a secoond<br />
step in order to<br />
get a more<br />
precisee<br />
picture of the t social immplications<br />
of a produc ct.<br />
Page 12 / 15
6<br />
LITERRATURE<br />
NATIONNAL<br />
CROSSSWALK<br />
SERVICCE<br />
CENTERR<br />
(1997) )<br />
OCCUPPATIONAL<br />
HEALTHH<br />
ANDD<br />
SAFETYY<br />
ADM<strong>IN</strong>I-<br />
STRATIION<br />
(1992)<br />
UNESCCO<br />
<strong>IN</strong>STITUUTE<br />
FORR<br />
STATISSTICS<br />
(1997) )<br />
UNITEDD<br />
STATESS<br />
DEPARRTMENT<br />
LABORR<br />
(1999)<br />
<strong>OF</strong>F<br />
NATIONA AL CROSSWAALK<br />
SERVIC CE CENTER (1997): NOOICC<br />
Maste er Crosswallk,<br />
Version 4.3. National<br />
Crosswa alk Service Center. C<br />
Online: http://www.x<br />
h xwalkcenter.org/index.<br />
php.<br />
OCCUPA ATIONAL HEAALTH<br />
AND SA AFETY ADM<strong>IN</strong> NISTRATION (1992): Sta andard<br />
Industria al Classificaation<br />
(SIC) system. s United<br />
States Department<br />
of Labor;<br />
Occupat tional Health<br />
and Safet ty Administr ration.<br />
Online: http://www.o<br />
h osha.gov/pl ls/imis/sic_m manual.htmml;<br />
http://ww ww.census.ggov/epcd/w<br />
www/sic.html.<br />
UNESCO O <strong>IN</strong>STITUTEE<br />
FOR STATISTICS<br />
(1997 7): Internatio ional Standa ard<br />
Classific cation of Edducation<br />
ISC CED 1997. UNESCO U Innstitute<br />
for Statistics. S<br />
Online:<br />
http://ww ww.unesco.oorg/education/informat<br />
tion/nfsunessco/doc/isced_1997.httm<br />
; http://w www.uis.uneesco.org/ev_<br />
_en.php?ID D=7433_2011&ID2=DO_<br />
_TOPIC.<br />
UNITED STATES S DEPPARTMENT<br />
<strong>OF</strong> O LABOR (1999):<br />
US Fa Fatal and No on-Fatal<br />
Injuries and a illnessees.<br />
United States S Depa artment of LLabor<br />
and Bureau B of<br />
Labor St tatistics.<br />
Online:<br />
http://ww ww.bls.gov/iiif/oshwc/os<br />
sh/os/ostb06 641.pdf; htttp://www.bls<br />
s.gov/iif/oshhw<br />
c/osh/os s/ostb0642.ppdf.<br />
U.S. CENSUSS<br />
U.S. CEN NSUS BUREAAU<br />
(1997): 1997 1 Econo omic Censuus.<br />
General Summary<br />
BUREAAU<br />
(1997) Mining and a Manufaacturing,<br />
Ind dustry Summ mary Constr truction. U.S S. Census<br />
Bureau. Online: httpp://www.cen<br />
nsus.gov/pr rod/ec97/977m31s-gs.pdf;<br />
http://ww ww.census.ggov/prod/ec<br />
c97/97c23-is.pdf;<br />
http://ww ww.census.ggov/prod/ec<br />
c97/97n21-g gs.pdf.<br />
U.S. IMPORTS<br />
<strong>OF</strong>F<br />
MERCHHANDISE<br />
U.S. IMP PORTS <strong>OF</strong> MEERCHANDISE<br />
E (2002A): History H DVDD-ROM.<br />
U.S S. Census<br />
Bureau.<br />
(2002AA)<br />
Online: http://www.c<br />
h census.gov v/foreign-<br />
trade/ref ference/prooducts/catalo<br />
og/imphisto ory.html.<br />
U.S. EEXPORTS<br />
<strong>OF</strong>F<br />
MERCHHANDISE<br />
U.S. EXP PORTS <strong>OF</strong> MMERCHANDIS<br />
SE 2002B: History H DVD-ROM.<br />
U.S.<br />
Census<br />
Bureau.<br />
(2002BB)<br />
Online: http://www.c<br />
h census.gov v/foreign-<br />
trade/ref ference/prooducts/catalo<br />
og/exphistoory.html. Page 13 / 15
APPENNDIX<br />
In this chapter thee<br />
data sources<br />
are aaddressed,<br />
which serv ve as a bassis<br />
for the method<br />
developped<br />
at the UUniversity<br />
Stuttgart. S Thhe<br />
particular<br />
statistics should s meeet<br />
various criteria c to<br />
be usedd<br />
in this metthod.<br />
These e criteria aree<br />
as well sp pecified in th he followingg<br />
paragraph hs.<br />
U.S. Ecconomic<br />
CCensus<br />
The “U. .S. Econommic<br />
Census” ” (http://wwww.census.g<br />
gov/) is a comprehenssive<br />
data co ollection,<br />
that givees<br />
a detaileed<br />
review of o the American<br />
economy.<br />
It is fulfilled<br />
by thee<br />
“Census Bureau”, B<br />
the Ameerican<br />
demmographic<br />
ag gency. Thee<br />
results are e gathered every five yyears,<br />
whereas<br />
the<br />
collecteed<br />
basic datta<br />
include to o a large exxtent<br />
the sta atistics of all a US comppanies.<br />
At th he same<br />
time, thhe<br />
data collection<br />
for the t agriculture<br />
and the e authoritie es takes plaace<br />
in para allel. The<br />
data coollection<br />
is based on a clear struuctured<br />
cla assification of the whoole<br />
econom my into a<br />
strictly hierarchicaal<br />
system of o industriaal<br />
sectors and subse ectors – the<br />
so calle ed North<br />
Americaan<br />
Industry Classification<br />
Standarrd<br />
(NAICS). . It is import tant that noot<br />
the companies<br />
as<br />
a wholee,<br />
but the single<br />
locatio on of these ccompanies<br />
as minimum m unit are listed.<br />
It allo ows both<br />
a betterr<br />
spatial ressolution<br />
and d a better reesolution<br />
ac ccording to activity, as a company y can be<br />
active inn<br />
different ssectors.<br />
The<br />
NAICS cclassifies<br />
1179<br />
various industries, 1070 of which w are<br />
coveredd<br />
in the U.S.<br />
Economic c Census.<br />
The datta<br />
is provideed<br />
for free and a is suppposed<br />
to ser rve several purposes. The following<br />
fields<br />
of appliccation<br />
exemmplify<br />
this:<br />
CCompaniess<br />
can comp pare their ssales<br />
figure es with thos se for theirr<br />
whole ind dustry. It<br />
aallows<br />
themm<br />
to calcula ate their maarket<br />
share in order to check theirr<br />
performan nce or to<br />
ddefine<br />
new targets.<br />
CCompaniess<br />
can also compare thheir<br />
business<br />
ratio wit th average numbers from f the<br />
U.S. Census<br />
as a benchmark b<br />
to assess s their per rformance with those e of the<br />
cconcurrent<br />
organizatio ons.<br />
CCompaniess<br />
which sell their goodss<br />
or service es to other companies c can find in the U.S.<br />
CCensus<br />
neew<br />
target industriess.<br />
Besides,<br />
producer rs learn ffrom<br />
the material<br />
cconsumptioon<br />
statistics more abouut<br />
the indust tries that co onsume theiir<br />
products.<br />
CCompaniess<br />
can use the data tto<br />
determin ne their sa ales areas, to place a target<br />
aadvertisemeent<br />
and to find f the besst<br />
locations for f their new w establishmments.<br />
<br />
Important kkey<br />
figures about a the eeconomic<br />
de evelopment t as monthlyy<br />
retail sale es or the<br />
ggross<br />
domeestic<br />
produc ct are baseed<br />
on the da ata of the U.S. U Censuss.<br />
Associati ions and<br />
tthe<br />
press analyze th he data to identify ec conomic circumstancees<br />
and to forecast<br />
ddevelopments.<br />
TThe<br />
legislattive<br />
body uses<br />
the datta<br />
for the preparation<br />
p and assesssment<br />
of ne ew laws.<br />
TThe<br />
state and local authorities a monitor the e Census data d to undderstand<br />
economic<br />
bbasics<br />
and to decide whether w theey<br />
should se ettle new businesses<br />
oor<br />
keep the e already<br />
eexisting<br />
onees.<br />
Page 14 / 15
CConsultantss<br />
and researchers<br />
maake<br />
use of the data to o analyze tthe<br />
change es in the<br />
industries’ sstructure<br />
or r in the spattial<br />
resolutio on. These data d are nott<br />
explicitly collected c<br />
ffor<br />
the usee<br />
in the me ethod. Neveertheless<br />
th hey work well w for the developed method<br />
bbecause<br />
of f the level of o detail andd<br />
their basis s on the clear<br />
hierarchical<br />
structure<br />
of the<br />
industries’ cclassificatio<br />
on.<br />
In the 22002<br />
U.S. EEconomic<br />
Census C the data for th he year 200 02 are colleected.<br />
In De ecember<br />
2002 data<br />
collecttion<br />
questio onnaires wwere<br />
sent to<br />
more than<br />
5 millioon<br />
compan nies, the<br />
deadlinee<br />
was set oon<br />
the 12th h of February<br />
2003. Du ue to adapt tion of the ddata<br />
entry forms to<br />
the individual<br />
industries,<br />
there e exist noww<br />
more than n 600 differ rent versionns.<br />
Only some<br />
very<br />
small coompanies<br />
ddo<br />
not rece eive questioonnaires.<br />
Fo or them the e data alreaady<br />
available<br />
at the<br />
federal authorities’ ’ are used. These autthorities<br />
pro ovide basic c data as loocation<br />
and d kind of<br />
businesss,<br />
sales figures,<br />
wage es and salarries,<br />
numbe er of employ yees and foorm<br />
of organization.<br />
The U.SS.<br />
Econommic<br />
Census is enshrineed<br />
in title 13 of the United U Stattes<br />
Code. The law<br />
commitss<br />
organizatiions<br />
to send d back the ffilled<br />
forms and awards<br />
penalties in case companies<br />
omit this.<br />
Besides, , the law sw wears the CCensus<br />
Bu ureau to sec crecy. No ddata<br />
are pu ublished,<br />
which disclose<br />
the identity or activity a of an<br />
individual l or a company.<br />
Standaard<br />
Industtry<br />
Classif fication (SSIC)<br />
The Staandard<br />
Induustry<br />
Classi ification (SIC)-Code<br />
is s a four-digit<br />
numerical<br />
code assigned<br />
by<br />
the U.SS.<br />
governmeent<br />
to the business<br />
esttablishment<br />
ts to identify y the primaary<br />
business s activity<br />
of the eestablishmeent<br />
(http://w www.osha.gov/pls/imis/<br />
/sic_manual.html).<br />
Thee<br />
classificat tion was<br />
developped<br />
to facilitate<br />
the collection,<br />
ppresentation<br />
n and analy ysis of datta;<br />
and to promote<br />
uniformity<br />
and comparability<br />
in the preesentation<br />
of statistic cal data coollected<br />
by various<br />
agenciees<br />
of the federal go overnment, state age encies and d private oorganization<br />
ns. The<br />
classificcation<br />
coveers<br />
all eco onomic acttivities:<br />
agr riculture, fo orestry, fisshing,<br />
hunting<br />
and<br />
trappingg;<br />
mining; cconstruction<br />
n; manufactturing;<br />
trans sportation; communicaations,<br />
elec ctric, gas<br />
and sanitary<br />
services;<br />
whole esale tradee;<br />
retail trade;<br />
finance e; insurance ce and real<br />
estate;<br />
servicess;<br />
and publiic<br />
administr ration.<br />
The Burreau<br />
of Labbour<br />
Statistics<br />
is a unit of U.S. Department<br />
of f Labour. Thhis<br />
unit is in n charge<br />
for the ffact-finding<br />
for the fede eral governnment<br />
in the e wide field of occupattional<br />
econo omy and<br />
occupattional<br />
statistics.<br />
US Impport/Export<br />
History<br />
The data<br />
about “UU.S.<br />
Expor rts of Mercchandise”<br />
(U U.S. CENSU US BUREAU 2002B) an nd “U.S.<br />
Imports of Merchaandise”<br />
(U.S S. CENSUS BUREAU 20 002A) are gathered g annd<br />
provided d by the<br />
U.S. Ceensus<br />
Bureau.<br />
The export<br />
statistiics<br />
contain data about t the value and the qu uantity of<br />
9.000 vvarious<br />
goods,<br />
which were w exporrted<br />
from th he USA; the e import staatistics<br />
prov vide this<br />
information<br />
for 177.000<br />
differ rent importeed<br />
goods. Depending g on the uunit<br />
the quantity<br />
is<br />
specifieed<br />
in, an aveerage<br />
price of the goodds<br />
can be calculated c based b on thhese<br />
data. The T data<br />
are alsoo<br />
available ffor<br />
the past t years. For r the method d described d here, dataa<br />
from the re eference<br />
year 2002<br />
was useed.<br />
Page 15 / 15