Waste Management in Ireland: Benchmarking Analysis and ... - Forfás
Waste Management in Ireland: Benchmarking Analysis and ... - Forfás
Waste Management in Ireland: Benchmarking Analysis and ... - Forfás

You also want an ePaper? Increase the reach of your titles
YUMPU automatically turns print PDFs into web optimized ePapers that Google loves.
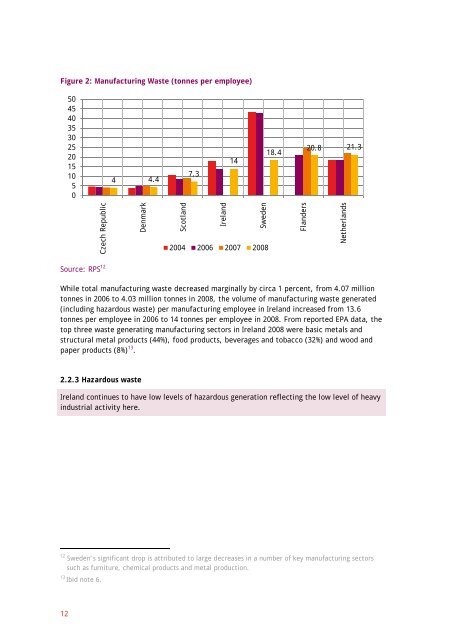
Figure 2: Manufactur<strong>in</strong>g <strong>Waste</strong> (tonnes per employee)<br />
Source: RPS 12<br />
While total manufactur<strong>in</strong>g waste decreased marg<strong>in</strong>ally by circa 1 percent, from 4.07 million<br />
tonnes <strong>in</strong> 2006 to 4.03 million tonnes <strong>in</strong> 2008, the volume of manufactur<strong>in</strong>g waste generated<br />
(<strong>in</strong>clud<strong>in</strong>g hazardous waste) per manufactur<strong>in</strong>g employee <strong>in</strong> <strong>Irel<strong>and</strong></strong> <strong>in</strong>creased from 13.6<br />
tonnes per employee <strong>in</strong> 2006 to 14 tonnes per employee <strong>in</strong> 2008. From reported EPA data, the<br />
top three waste generat<strong>in</strong>g manufactur<strong>in</strong>g sectors <strong>in</strong> <strong>Irel<strong>and</strong></strong> 2008 were basic metals <strong>and</strong><br />
structural metal products (44%), food products, beverages <strong>and</strong> tobacco (32%) <strong>and</strong> wood <strong>and</strong><br />
paper products (8%) 13 .<br />
2.2.3 Hazardous waste<br />
<strong>Irel<strong>and</strong></strong> cont<strong>in</strong>ues to have low levels of hazardous generation reflect<strong>in</strong>g the low level of heavy<br />
<strong>in</strong>dustrial activity here.<br />
12<br />
Sweden’s significant drop is attributed to large decreases <strong>in</strong> a number of key manufactur<strong>in</strong>g sectors<br />
such as furniture, chemical products <strong>and</strong> metal production.<br />
13<br />
Ibid note 6.<br />
12<br />
50<br />
45<br />
40<br />
35<br />
30<br />
25<br />
20<br />
15<br />
10<br />
5<br />
0<br />
Czech Republic<br />
4<br />
Denmark<br />
4.4<br />
Scotl<strong>and</strong><br />
7.3<br />
<strong>Irel<strong>and</strong></strong><br />
14<br />
Sweden<br />
2004 2006 2007 2008<br />
18.4<br />
Fl<strong>and</strong>ers<br />
20.8<br />
Netherl<strong>and</strong>s<br />
21.3