Bean Marketing in Uganda - Uganda Strategy Support Program Notes
Bean Marketing in Uganda - Uganda Strategy Support Program Notes
Bean Marketing in Uganda - Uganda Strategy Support Program Notes

Create successful ePaper yourself
Turn your PDF publications into a flip-book with our unique Google optimized e-Paper software.
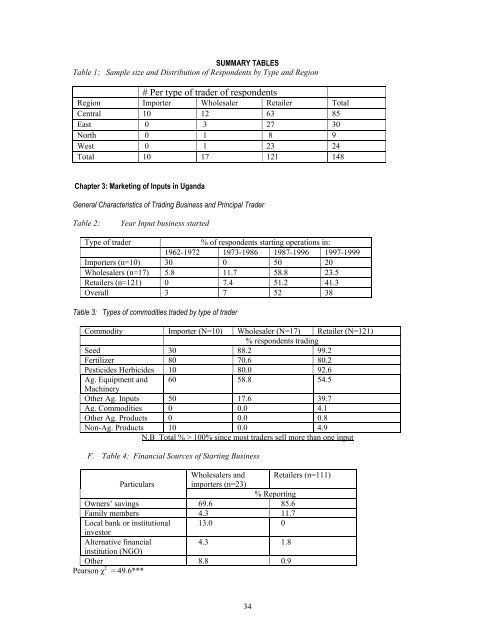
SUMMARY TABLES<br />
Table 1: Sample size and Distribution of Respondents by Type and Region<br />
# Per type of trader of respondents<br />
Region Importer Wholesaler Retailer Total<br />
Central 10 12 63 85<br />
East 0 3 27 30<br />
North 0 1 8 9<br />
West 0 1 23 24<br />
Total 10 17 121 148<br />
Chapter 3: <strong>Market<strong>in</strong>g</strong> of Inputs <strong>in</strong> <strong>Uganda</strong><br />
General Characteristics of Trad<strong>in</strong>g Bus<strong>in</strong>ess and Pr<strong>in</strong>cipal Trader<br />
Table 2: Year Input bus<strong>in</strong>ess started<br />
Type of trader % of respondents start<strong>in</strong>g operations <strong>in</strong>:<br />
1962-1972 1973-1986 1987-1996 1997-1999<br />
Importers (n=10) 30 0 50 20<br />
Wholesalers (n=17) 5.8 11.7 58.8 23.5<br />
Retailers (n=121) 0 7.4 51.2 41.3<br />
Overall 3 7 52 38<br />
Table 3: Types of commodities traded by type of trader<br />
Commodity Importer (N=10) Wholesaler (N=17) Retailer (N=121)<br />
% respondents trad<strong>in</strong>g<br />
Seed 30 88.2 99.2<br />
Fertilizer 80 70.6 80.2<br />
Pesticides Herbicides 10 80.0 92.6<br />
Ag. Equipment and 60 58.8 54.5<br />
Mach<strong>in</strong>ery<br />
Other Ag. Inputs 50 17.6 39.7<br />
Ag. Commodities 0 0.0 4.1<br />
Other Ag. Products 0 0.0 0.8<br />
Non-Ag. Products 10 0.0 4.9<br />
N.B Total % > 100% s<strong>in</strong>ce most traders sell more than one <strong>in</strong>put<br />
F. Table 4: F<strong>in</strong>ancial Sources of Start<strong>in</strong>g Bus<strong>in</strong>ess<br />
Wholesalers and Retailers (n=111)<br />
Particulars importers (n=23)<br />
Owners’ sav<strong>in</strong>gs 69.6<br />
% Report<strong>in</strong>g<br />
85.6<br />
Family members 4.3 11.7<br />
Local bank or <strong>in</strong>stitutional<br />
<strong>in</strong>vestor<br />
13.0 0<br />
Alternative f<strong>in</strong>ancial<br />
4.3 1.8<br />
<strong>in</strong>stitution (NGO)<br />
Other 8.8 0.9<br />
Pearson χ 2 = 49.6***<br />
34