Chapter 8 Plate Tectonics
Chapter 8 Plate Tectonics
Chapter 8 Plate Tectonics

Create successful ePaper yourself
Turn your PDF publications into a flip-book with our unique Google optimized e-Paper software.
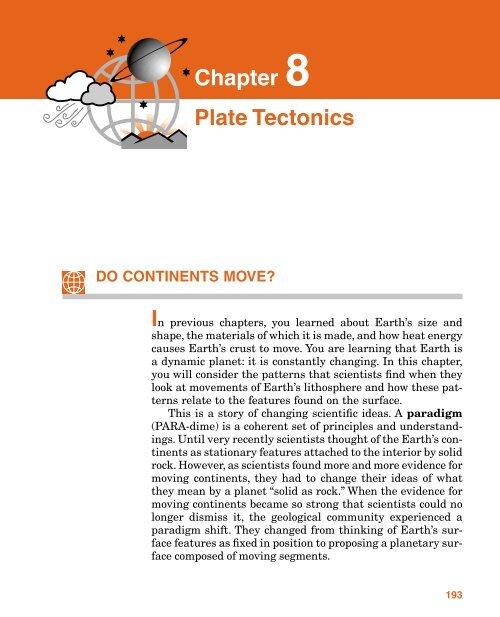
<strong>Chapter</strong> 8<br />
<strong>Plate</strong> <strong>Tectonics</strong><br />
DO CONTINENTS MOVE?<br />
In previous chapters, you learned about Earth’s size and<br />
shape, the materials of which it is made, and how heat energy<br />
causes Earth’s crust to move. You are learning that Earth is<br />
a dynamic planet: it is constantly changing. In this chapter,<br />
you will consider the patterns that scientists find when they<br />
look at movements of Earth’s lithosphere and how these patterns<br />
relate to the features found on the surface.<br />
This is a story of changing scientific ideas. A paradigm<br />
(PARA-dime) is a coherent set of principles and understandings.<br />
Until very recently scientists thought of the Earth’s continents<br />
as stationary features attached to the interior by solid<br />
rock. However, as scientists found more and more evidence for<br />
moving continents, they had to change their ideas of what<br />
they mean by a planet “solid as rock.” When the evidence for<br />
moving continents became so strong that scientists could no<br />
longer dismiss it, the geological community experienced a<br />
paradigm shift. They changed from thinking of Earth’s surface<br />
features as fixed in position to proposing a planetary surface<br />
composed of moving segments.<br />
193
194 CHAPTER 8: PLATE TECTONICS<br />
Continental Drift<br />
When explorers and mapmakers crossed the Atlantic Ocean<br />
in the 1600s, some of them noticed an interesting coincidence.<br />
The more complete their maps became, the more the Atlantic<br />
Ocean shorelines of the Americas and the Old World continents<br />
of Africa and Europe looked as if they would fit together<br />
like pieces of a jigsaw puzzle. Initially this was simply<br />
noted as a curiosity. Some of them may have wondered if the<br />
continents had ever been together. They thought of rock as<br />
solid and unmoving. The idea that whole continents could<br />
move was not taken seriously.<br />
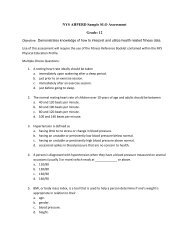
In 1912, Alfred Wegener (VEYG-en-er)—a German explorer,<br />
astronomer, and meteorologist (a meteorologist is a<br />
scientist who studies weather)—proposed that the continents<br />
we see are the broken fragments of a single landmass that he<br />
called Pangaea (pan-JEE-ah), which means all Earth. He hypothesized<br />
that over millions of years, the continents slowly<br />
moved to their present positions. Wegener supported his theory<br />
by pointing out that a particular fossil leaf (Glossopteris)<br />
is found in South America, Africa, Australia, Antarctica, and<br />
India. Bringing the continents together would put the areas<br />
where these fossil organisms are found next to each other<br />
as shown in Figure 8-1. The same placement would also line<br />
up distinctive rock types and mountain areas. Wegener also<br />
noted glacial striations (scratches on bedrock caused by the<br />
moving ice of a glacier) in places such as Australia and Africa<br />
that now have a climate too warm for glaciers. He suggested<br />
that these places that now have warm climates were once<br />
located near the South Pole. On the basis of this evidence,<br />
Wegener proposed his hypothesis that came to be known as<br />
continental drift.<br />
The idea that continents could move was so radical that<br />
few geologists took it seriously. How could the landmasses<br />
move through the solid rock of the ocean basins? The causes<br />
suggested by Wegener could not provide the force needed to<br />
move continents. As another way to discredit Wegener’s idea<br />
of continental drift, scientists pointed out that he was not a<br />
geologist. In 1930 when Alfred Wegener died on an expedition
Figure 8-1 If the continents<br />
were moved together by<br />
closing the Atlantic Ocean,<br />
mountain chains, similar<br />
rock types, and evidence of<br />
glaciation on several continents<br />
would come together.<br />
to Greenland, very few geologists supported his ideas. His<br />
most enthusiastic supporters were in the Southern Hemisphere<br />
where the most convincing evidence for continental<br />
drift had been observed.<br />
ACTIVITY 8-1 MATCHING SHORELINES<br />
Obtain an outline map of the world. Cut out the continents and<br />
lay the pieces on your desk in their present locations. Then, slide<br />
them together to show how they might have fit to make a single<br />
land mass. Paste or tape them onto a sheet of paper in the position<br />
they might have been in before they separated.<br />
Seafloor Spreading<br />
DO CONTINENTS MOVE? 195<br />
The rocks of the ocean bottoms are very different from most<br />
rocks on land.When scientists look at the mineral composition<br />
of rocks from the continents they find that most have a compo-
196 CHAPTER 8: PLATE TECTONICS<br />
sition similar to granite.That is, the continental rocks are generally<br />
felsic, light-colored rocks with a relatively low density.<br />
The low-density material of which continents are composed<br />
tends to rise above the ocean basins. Most oceanic rocks have a<br />
composition similar to basalt. They are mafic. You may recall<br />
from <strong>Chapter</strong> 5 that mafic rocks are darker in color and relatively<br />
dense.This is why the ocean basins tend to ride lower on<br />
the rocks of Earth’s interior and are covered by the oceans.<br />
At the time Wegener worked on his hypothesis, the oceans<br />
were vast expanses of unknown depth. After his death, the<br />
strongest evidence for his theory of moving continents came<br />
from the oceans. During World War II, there were important<br />
advances in technology and oceanic exploration. A moving<br />
ship could make a continuous record of the depth of the ocean<br />
by bouncing sound waves off the ocean bottom. After the<br />
war, scientists used this technology to map the world’s ocean<br />
bottoms. Much of the ocean bottom is flat and featureless.<br />
But scientists discovered an underwater system of mountain<br />
ranges that circles Earth like the seams on a baseball. These<br />
are the mid-ocean ridges. Most of these 64,000-km-long<br />
features are under water, but they rise above sea level in Iceland<br />
and on several smaller islands. By looking at the landscape<br />
of Iceland, scientists can investigate processes that<br />
occur at the bottom of the ocean hidden from view.<br />
In 1960, Princeton University geologist Harry Hess reconsidered<br />
Wegener’s ideas. Hess had commanded a ship during<br />
World War II that measured ocean depths. He had seen<br />
the newly discovered shape of ocean bottoms including the<br />
mid-ocean ridges. Hess suggested that molten magma from<br />
the mantle rises to the surface at the mid-ocean ridges and<br />
erupts onto the ocean bottom. In many places, the ocean<br />
ridges are like two mountain chains separated by a valley. It<br />
is in the valley that the most active eruptions are taking<br />
place to form a strip of new lithosphere. Some of the magma<br />
solidifies as it comes into contact with the cold ocean water<br />
making pillow-shaped rocks. Wherever scientists find pillow<br />
lavas, they can be sure that magma moved into water and solidified<br />
quickly. Pillow lavas are common along the mid-ocean<br />
ridges but are uncommon elsewhere in the oceans. Hess suggested<br />
that the mid-ocean ridges are the places where new<br />
lithosphere is made and adds on to older material that moves
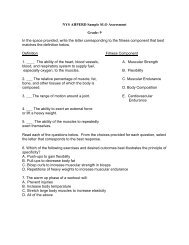
Figure 8-2 Earth’s<br />
surface is composed<br />
of about a dozen<br />
lithospheric plates.<br />
These plates can<br />
move together, move<br />
apart, or slide past<br />
each other as shown<br />
by the arrows on<br />
this map.<br />
DO CONTINENTS MOVE? 197<br />
away from the ridges on both sides. Hess called this process<br />
seafloor spreading. (See Figure 8-2.)<br />
MAGNETIC EVIDENCE New technology also enabled scientists<br />
to make continuous records of the magnetism of the ocean<br />
floor. In <strong>Chapter</strong> 3, you learned that Earth is a giant magnet.<br />
Scientists are not sure what causes Earth’s magnetic field,<br />
but the likely cause is currents of molten iron in Earth’s outer<br />
core. These currents tend to line up with Earth’s spin axis and<br />
therefore make Earth’s magnetic poles close to the geographic<br />
North and South Poles. When magma cools to make rock,<br />
iron forms the magnetic mineral magnetite. Within molten<br />
magma, iron is free to align itself with Earth’s magnetic field<br />
and change its alignment as the magma flows or Earth’s magnetic<br />
field changes. When magma rises to the surface and solidifies,<br />
the alignment of the iron in the rock can no longer<br />
change. The new rock holds a record of Earth’s magnetism at<br />
the time it crystallized.<br />
Earth’s magnetic poles have reversed many times. The<br />
magnetic field weakens and then builds in the opposite direction.<br />
In other words, the north magnetic pole becomes the<br />
south magnetic pole, and then the south magnetic pole becomes<br />
the north magnetic pole. The time from one reversal to
198 CHAPTER 8: PLATE TECTONICS<br />
the next is not uniform, but most reversals occur after 100,000<br />
to 1,000,000 years. A record of these reversals is preserved in<br />
igneous rocks that solidified at different times. In <strong>Chapter</strong> 18,<br />
you will learn how scientists use radioactive substances to<br />
find the age of rocks.<br />
If the whole ocean floor formed at the same time, all the igneous<br />
rocks would be magnetized in the same direction. However,<br />
scientists see bands of polarity. Polarity is the direction<br />
of a magnetic field. The direction is determined with an instrument<br />
that measures Earth’s magnetic field. Some of the<br />
bands are magnetized the way they would if they solidified<br />
with the present alignment of the magnetic poles. These areas<br />
have normal polarity. Other parts of the ocean floor show reversed<br />
polarity. These rocks crystallized when the magnetic<br />
north and south poles were opposite to the way they are now.<br />
These bands of normal and reversed polarity are the<br />
strongest near the ocean ridges. In addition, they show a symmetrical<br />
pattern. The striped pattern of normal and reversed<br />
polarity on one side of an ocean ridge is almost a mirror image<br />
of the pattern on the other side. (See Figure 8-3.) These magnetic<br />
bands provide evidence that new crust is forming as the<br />
plates move away from the ridges.<br />
Figure 8-3 New lithosphere<br />
is created at the mid-ocean<br />
ridges. That portion of the<br />
lithosphere takes on Earth’s<br />
magnetism and slowly<br />
moves away from the ridge.<br />
As the magnetic poles reverse,<br />
parallel bands of<br />
normal and reversed magnetic<br />
polarity are created at<br />
the mid-ocean ridge.
Figure 8-4 As new<br />
crust is created at<br />
the ocean ridges,<br />
the ocean floor<br />
moves like a slow<br />
conveyor belt toward<br />
the ocean trenches.<br />
The ocean trenches,<br />
also known as zones<br />
of subduction, are<br />
places where ocean<br />
bottom is drawn back<br />
into Earth. Continental<br />
rocks resist<br />
subduction.<br />
DO CONTINENTS MOVE? 199<br />
AGE OF ROCKS Geologists have been able to determine the<br />
age of rocks recovered from the ocean floors. In the 1950s, the<br />
Glomar Challenger was able to drill into the basaltic rock of<br />
the ocean floor to recover the solid bedrock of the oceans.<br />
When laboratory work on these samples revealed their age,<br />
a pattern emerged. Geologists discovered that the rocks recovered<br />
close to the ridges were younger than those collected<br />
far from the mid-ocean ridges. As the distance from the midocean<br />
ridges increases, so does the age of the ocean floor.<br />
These observations support the idea that ocean floor<br />
is being created continuously at the mid-ocean ridges, and<br />
moves like a conveyor belt toward the continents. But how<br />
can new lithosphere be created if Earth is not getting larger?<br />
In <strong>Chapter</strong> 6, you read about recycling as a way to conserve<br />
resources. Earth recycles its lithosphere. Old lithosphere<br />
moves back into Earth’s interior at locations known as subduction<br />
zones. As lithosphere is being created by magma<br />
moving to the surface at the mid-ocean ridges, the older lithosphere<br />
moves across the ocean bottom and away from the<br />
ridges. The rate of motion varies from ocean to ocean, but<br />
some move as fast as 10 cm/year. Typically, the plates move<br />
about as fast as your fingernails grow. Figure 8-4 illustrates<br />
that at the subduction zones sections of the lithosphere sink<br />
into Earth.<br />
At ocean trenches, the more mafic parts of the lithosphere<br />
are absorbed into the mantle. The felsic continental litho-
200 CHAPTER 8: PLATE TECTONICS<br />
sphere resists being drawn into Earth in the process of subduction.<br />
This lighter material forms intensely folded and<br />
faulted mountains near the subduction zones. Felsic rocks<br />
drawn into Earth often melt and come back to the surface in<br />
volcanic eruptions. Due to the water in these continental<br />
rocks changing to steam, volcanic eruptions of felsic rocks are<br />
often violent and explosive. Both the highest mountains and<br />
the deepest parts of the oceans occur near zones of subduction<br />
and both of them are related to the process of subduction.<br />
<strong>Plate</strong> <strong>Tectonics</strong><br />
You may recall that one of the most important objections to<br />
Wegener’s idea of continental drift was that there was no<br />
mechanism to explain how continents could move through the<br />
ocean basins. Seafloor spreading provided an explanation for<br />
the motion of Earth’s lithosphere. When the discoveries<br />
of seafloor spreading were added to Wegener’s ideas about continental<br />
drift, geologists recognized a larger theory of plate<br />
tectonics. (The word tectonics means large-scale motions of<br />
Earth’s crust.) Tectonic forces are responsible for uplift and<br />
mountain building. (See Figure 8-5.) In 1965, Canadian geologist<br />
J.Tuzo Wilson proposed that the whole Earth is covered by<br />
about a dozen rigid sections called lithospheric plates. The<br />
plates include the crust as well as the rigid upper mantle.<br />
Figure 8-5 The San Rafael<br />
Swell in Utah is the result<br />
of tectonic forces associated<br />
with the movement of<br />
Earth’s plates pushing up<br />
these formerly flat-lying rock<br />
layers. Note the large truck<br />
for scale.
DO CONTINENTS MOVE? 201<br />
<strong>Plate</strong>s are approximately 100 km in thickness, and ride over a<br />
portion of the mantle that is less rigid than the upper part of<br />
the mantle. Compared with Earth’s 6000-km radius, the<br />
plates are relatively thin. The lithospheric plates are created<br />
at the ocean ridges and destroyed at the subduction zones.<br />
Some plates contain only ocean floor, but most of the major<br />
lithospheric plates have oceanic and continental lithosphere.<br />
Zones of geological activity, such as the mid-ocean ridges and<br />
subduction zones, form the boundaries of the plates. In addition<br />
to the major plates, a number of smaller plates exist<br />
where the larger plates do not meet precisely.<br />
The motion of the plates is driven by Earth’s internal<br />
heat. While conduction does allow some of Earth’s energy to<br />
reach the surface, it is too slow to account for most of the heat<br />
flow from Earth’s center. The major form of heat flow outward<br />
from Earth’s interior is convection. The ocean ridges are<br />
places where convection brings heated matter to the surface.<br />
There the heat energy can radiate into space.<br />
Convection occurs only in fluids. A fluid is any substance<br />
that can flow. Generally, scientists consider gases and liquids<br />
to be fluids, but not solids. Convection in air produces the<br />
winds. Ocean currents are the result of convection in water.<br />
But how can solid rock flow as a fluid? If you could plunge<br />
into the mantle with a rock hammer, the rocks at depth would<br />
seem just as solid as similar rocks at the surface. If you were<br />
to hit mantle rock with the hammer, the hammer would<br />
bounce off the rock and make a high-pitched clink. The hammer<br />
does not deform the rock because it creates only a shortterm<br />
force. Although there are places where rock has melted,<br />
forming magma, nearly all the mantle is in the solid state.<br />
You may recall S-waves do not pass through liquids. The<br />
passage of S-waves through Earth’s mantle is an indication<br />
that the mantle is solid. Earth’s mantle is a solid, but it can<br />
flow to carry energy by convection. How can this be? The key<br />
to resolving this contradiction is the extreme heat and pressure<br />
inside Earth. Under extreme pressure and high temperature,<br />
solid rock can flow slowly like a fluid. In addition,<br />
the rate of movement of the plates is only a few centimeters<br />
per year. That is about the rate at which your fingernails<br />
grow. This is slow enough to allow convection in a material<br />
that otherwise behaves like a solid.
202 CHAPTER 8: PLATE TECTONICS<br />
Figure 8-6 Slow-moving convection currents within Earth carry heat energy toward<br />
the surface. Material rises and creates new oceanic crust at the ocean ridges, and it<br />
moves back into Earth at ocean trenches. This circular pattern is called a convection<br />
cell. The continents are carried by this motion like passive rafts floating on water.<br />
Convection is driven by density differences. Most materials<br />
expand when they are heated. Expansion increases volume<br />
and makes matter less dense. In places where a fluid is<br />
heated, it becomes less dense and tends to rise. Cooling usually<br />
causes matter to become more dense. This makes the<br />
substance heavier than an equal volume of the surrounding<br />
material. When fluids are cooled they usually sink. A heat<br />
source in one place, such as Earth’s interior, and cooling in<br />
another place, such as Earth’s surface, can set up a circular<br />
motion known as a convection cell as shown in Figure 8-6. In<br />
convection, the motion of the fluid occurs when heated material<br />
moves away from the source of heat. This is what is happening<br />
in Earth’s asthenosphere.<br />
WHAT IS EARTH’S INTERNAL STRUCTURE?<br />
In <strong>Chapter</strong> 7, you read about the four layers within Earth as<br />
determined by seismic waves: crust, mantle, outer core, and<br />
inner core. Motion of the plates leads us to consider a different<br />
way to divide the outer layers of Earth into lithosphere,<br />
asthenosphere, and stiffer mantle. Note that Figure 8-7 is
Figure 8-7 Inferred<br />
properties of Earth’s<br />
interior<br />
from the Earth Science Reference Tables. The following paragraphs<br />
explain this chart.<br />
Temperature<br />
WHAT IS EARTH’S INTERNAL STRUCTURE? 203<br />
The word “inferred” in the caption reminds you that this diagram<br />
is based on laboratory simulations and other investigative<br />
work rather than on direct observations. An inference
204 CHAPTER 8: PLATE TECTONICS<br />
is an interpretation or a conclusion based on indirect observations.<br />
This diagram has three parts: a temperature graph,<br />
a pressure graph, and a profile view inside Earth. All three<br />
parts of this figure refer to Earth’s interior. The temperature<br />
graph shows how scientists think Earth’s temperature<br />
changes with depth. It is easy to find an average temperature<br />
at Earth’s surface because people can travel freely over the<br />
surface. Scientists have observed that the deeper Earth is<br />
penetrated with mines and wells the higher the temperature<br />
becomes. Beyond the depths of mines and wells, scientists<br />
must use laboratory instruments to simulate conditions inside<br />
Earth.<br />
Observations of meteorites and the density of Earth support<br />
the inference that Earth’s core is mostly iron. If scientists<br />
subject iron to the pressure estimated to exist at Earth’s center,<br />
iron melts at just over 6000°C. That fact gives scientist<br />
enough information to begin to draw the dark line on this<br />
temperature graph. The dotted line on this graph shows the<br />
melting points of the substances geologists think occur in<br />
Earth’s interior. At the surface, both lines are close together.<br />
Since the rocks at the surface are solid, the surface temperature<br />
is clearly below the melting point of these rocks. At a<br />
depth of about 100 km, is the region in which the temperature<br />
line (orange) is higher than the melting point (dashed line).<br />
Much of the magma that erupts from volcanoes comes from<br />
this depth. This is also where the lithosphere, the crust and<br />
the rigid part of the mantle that moves with the plates, ends.<br />
Below 100 km, there is partly melted rock that is close to the<br />
melting temperature of mafic silicates. The plastic nature of<br />
that layer allows rigid lithospheric plates to slowly move over<br />
Earth’s surface. The asthenosphere is the plastic part of the<br />
mantle. Plastic refers to its state of matter. Have you ever<br />
played with Silly Putty? Silly Putty is a product that shatters<br />
like a solid when it is hit with a hammer. But leave a sphere of<br />
Silly Putty on a flat surface; it will slowly collapse into a puddle.<br />
A material is said to be plastic if it shows the properties<br />
of a solid under short-term stress, but flows like a liquid when<br />
stress is applied over a long period of time.<br />
Below the asthenosphere, the melting point increases due<br />
to higher pressure, and the mantle loses its plastic nature.
Pressure<br />
WHAT IS EARTH’S INTERNAL STRUCTURE? 205<br />
This is because the temperature of this part of the mantle is<br />
well below the melting temperature. The question marks on<br />
the melting point line show that scientists are not sure about<br />
this part of the dotted line. Under these conditions of pressure,<br />
the melting temperature should be well above the solid<br />
temperature line. However, recent research has shown that<br />
some magma does seem to originate within the stiffer mantle.<br />
This might indicate that variations in composition occur<br />
here. Some parts of the stiffer mantle might melt at lower<br />
temperatures than other parts.<br />
There is a sudden change in melting temperature at a<br />
depth of about 2900 km. Geophysicists, scientists who study<br />
the physical properties of Earth materials, believe that this<br />
is where the silicate composition of the mantle ends and the<br />
mostly iron outer core begins. Iron has a lower melting temperature<br />
than mafic silicate minerals. Therefore, the outer<br />
core is a molten liquid. Finally, there is a transition from the<br />
liquid part of the outer core to the solid phase of the inner<br />
core, even without a major change in composition. This indicates<br />
that the temperature at Earth’s center is again below<br />
the melting point, and therefore the inner core is probably<br />
solid.<br />
The graph at the center of the figure illustrates how the pressure<br />
within Earth changes with depth. This pressure is<br />
caused by the weight of the layers above. Therefore, as you<br />
might expect, pressure increases with depth. Note that the<br />
scale on the vertical axis is in millions of times normal atmospheric<br />
pressure.<br />
The top of the diagram illustrates Earth’s internal structure.<br />
By looking at the labels and surface features, you can<br />
tell that the diagram represents a region of earth from the<br />
middle of the Atlantic Ocean, across North America, and into<br />
the Pacific Ocean. The height of the Cascade Mountains is<br />
greatly exaggerated. It would be difficult to see the mountains<br />
if they were actually drawn to scale. Notice the arrows<br />
that show upwelling at the Mid-Atlantic Ridge and subduc-
206 CHAPTER 8: PLATE TECTONICS<br />
Hot Spots<br />
tion at the trench. This is a part of the internal convection explained<br />
earlier.<br />
The diagram also shows two ways to divide Earth’s interior.<br />
From studies of earthquakes, scientists have learned<br />
much about Earth’s crust, shown here by the dark line at the<br />
surface. (The thickness of this line has also been exaggerated.)<br />
The white, gray, and dotted sections are within Earth’s<br />
mantle. Below the mantle are the outer and inner cores. A different<br />
way to show the interior is based on motions of the<br />
lithospheric plates. In the plate tectonic model, Earth’s top<br />
layer is the lithosphere. The lithosphere includes the crust,<br />
shown in black, and the upper part of the mantle, shown in<br />
white. The asthenosphere and the stiffer, more solid part of<br />
the mantle are above the outer and inner cores.<br />
A hot spot is a long-lived source of magma within the asthenosphere<br />
and below the moving lithospheric plates. If the<br />
plates were not moving, people would observe repeated eruptions<br />
of a single volcano. Instead, people see a line of volcanoes<br />
in which the oldest volcanoes are at one end and the<br />
youngest are at the other end. Scientists interpret this pattern<br />
as evidence of the motion of a plate over a stationary hot<br />
spot under the lithosphere.<br />
The Hawaiian Islands (Figure 8-8) are an excellent example<br />
of volcanic eruptions at a hot spot. The oldest volcanoes<br />
in the Hawaiian chain are at the northwestern end of<br />
the chain. The volcanoes that produced the island of Kauai<br />
were active 3.8 to 5.6 million years ago. The Kauai volcanoes<br />
have not erupted since then. The major islands of Oahu,<br />
Molokai, and Maui were built by successive eruptions of volcanoes<br />
approximately 2.5, 1.5, and 1 million years ago, respectively.<br />
The youngest of the Hawaiian Islands is Hawaii,<br />
which gave its name to the whole chain of islands. Kilauea<br />
volcano on the island of Hawaii has been erupting continuously<br />
for nearly half a century.<br />
If you did not know about plate motions, you would think<br />
that the source of lava was moving southeast. However, sci-
Figure 8-8 The<br />
progression of ages<br />
in the Hawaiian<br />
Islands shows that<br />
the Pacific <strong>Plate</strong> is<br />
moving over a deep<br />
hot spot below the<br />
lithospheric plate.<br />
Kilauea volcano on<br />
the largest island is<br />
currently active.<br />
entists now realize that the northwestward motion of the Pacific<br />
<strong>Plate</strong> has transported the ocean floor over the hot spot.<br />
Successive eruptions created new islands while the older islands<br />
were carried northwest on the moving Pacific <strong>Plate</strong>.<br />
ACTIVITY 8-2 GRAPHING HAWAIIAN VOLCANOES<br />
WHAT IS EARTH’S INTERNAL STRUCTURE? 207<br />
Use the information in Figure 8-8 to draw a graph that shows ages<br />
of the Hawaiian Islands compared with their distance from Kilauea.<br />
The position of Kilauea is shown by a black dot on the island<br />
of Hawaii. Then, from your graph, determine the rate at<br />
which the Pacific <strong>Plate</strong> is moving over the stationary hot spot.<br />
The line of Hawaiian volcanoes did not begin at Kauai.<br />
Oceanographers (scientists who study Earth’s oceans) have<br />
analyzed basalt from the Emperor Chain of islands and<br />
seamounts that extends from the Hawaiian Islands northwestward<br />
nearly to Alaska. The age of these islands and<br />
seamounts steadily increases in that direction to a maximum<br />
age of approximately 60 million years. It seems clear that the
208 CHAPTER 8: PLATE TECTONICS<br />
Hawaiian hot spot below the lithosphere has been supplying<br />
magma for at least the past 60 million years. During this<br />
time, the Pacific <strong>Plate</strong> has moved thousands of kilometers to<br />
the northwest. Even at a pace of a just few centimeters per<br />
year, over a period of millions of years the lithospheric plate<br />
can move great distances.<br />
ACTIVITY 8-3 ZONES OF CRUSTAL ACTIVITY<br />
You can find worldwide lists of active volcanoes and earthquakes,<br />
which provide latitude and longitude, on the Internet. Use this information<br />
to plot the position of at least 25 volcanoes or earthquake<br />
epicenters (choose one) on an outline map of the world.<br />
Compare the location of the features on your map with the features<br />
that others have plotted from different lists. Can you see<br />
similarities? Do the maps show any kind of pattern? Why do earthquakes<br />
and volcanoes often occur in the same places?<br />
Locating <strong>Plate</strong>s and <strong>Plate</strong> Boundaries<br />
A tectonic plate moves over Earth’s surface as a single unit.<br />
The rigid nature of the plates generally transfers force applied<br />
anywhere in the plate to the edges of the plates. Although<br />
large earthquakes can and do occur within the plates, earthquake<br />
epicenters are more common where one plate meets another.<br />
When seismologists were able to record and locate<br />
earthquakes all over the globe, they noticed that there are distinct<br />
zones of crustal activity that stretch around the world.<br />
These zones of earthquake activity are also regions in which<br />
there are many volcanic eruptions and where tectonic mountain<br />
building is occurring. Compare Figure 8-9 with the map of<br />
plate boundaries in the Earth Science Reference Tables.<br />
At the ocean ridges where new crust is forming, the plates<br />
are relatively thin. Deep earthquakes do not occur in this region<br />
because the upwelling material is relatively plastic, so it<br />
tends to flow and bend rather than break suddenly. Although<br />
there are many earthquakes at the mid-ocean ridges, their
Figure 8-9 Dots on<br />
this map indicate the<br />
distribution of earthquake<br />
epicenters.<br />
Note that the greatest<br />
concentration of<br />
epicenters is at the<br />
boundaries of the<br />
lithospheric plates.<br />
WHAT IS EARTH’S INTERNAL STRUCTURE? 209<br />
foci are shallow. However, where plates descend into the asthenosphere,<br />
the earthquake foci are deep. As they sink into<br />
Earth, plates remain rigid until they are heated enough to<br />
become plastic and pliable. Figure 8-10 shows the concentration<br />
of shallow seismic foci near a mid-ocean ridge and the<br />
persistence of deep foci where subduction occurs near an<br />
ocean trench. Seismologists can locate sinking plates by plotting<br />
deep focus earthquakes.<br />
XX<br />
X<br />
X<br />
X<br />
X<br />
X<br />
X X X<br />
X X<br />
X<br />
Figure 8-10 Epicenters and plate boundaries. Each “X” on this diagram represents<br />
an earthquake focus. At the mid-ocean ridges, heated lithosphere remains plastic<br />
until it rises to a position near the surface. Although earthquakes are numerous at<br />
the ridges, they are shallow. But a plate descending at an ocean trench remains<br />
cool long enough to support deep-focus earthquakes.<br />
X
210 CHAPTER 8: PLATE TECTONICS<br />
Types of <strong>Plate</strong> Boundaries<br />
Figure 8-11 is a world map from the Earth Science Reference<br />
Tables. This map shows the boundaries of Earth’s lithospheric<br />
plates. <strong>Plate</strong> boundaries are some of the most active zones of<br />
earthquakes and volcanic eruptions. These boundaries can be<br />
classified into four types based on the relative plate motions.<br />
DIVERGENT BOUNDARIES The double lines on the map indicate<br />
rift boundaries. These are places such as the Mid-Atlantic<br />
Ridge where heated material rises toward the surface. At the<br />
Figure 8-11 <strong>Plate</strong> boundaries are places where Earth’s rigid lithospheric plates<br />
meet. At these boundaries, new lithosphere is created, destroyed, or the plate<br />
moves parallel to the boundary.
WHAT IS EARTH’S INTERNAL STRUCTURE? 211<br />
same time, the lithosphere is spreading away from the ridge<br />
allowing magma to come to the surface, cool, and make new<br />
lithosphere. At the mid-ocean ridges new ocean floor spreads<br />
away from the plate boundary. For this reason these areas<br />
are called divergent plate boundaries. Recall that this is<br />
also a region of many small and shallow earthquakes. Ocean<br />
ridges are where heat energy is escaping from Earth’s interior<br />
most rapidly.<br />
CONVERGENT BOUNDARIES The lines with black rectangles indicate<br />
subduction zones. These are the places where old, cool<br />
lithosphere sinks into Earth. Because the motion of the lithosphere<br />
is toward the plate boundary, zones of subduction are<br />
also known as convergent plate boundaries. It is common<br />
to find continental and oceanic lithosphere meeting near subduction<br />
zones. You may recall that the rock of the continents<br />
is granitic and therefore resists subduction.<br />
A good example of a convergent plate boundary is the<br />
Peru-Chile Trench along the western coast of South America.<br />
The Nazca <strong>Plate</strong> is ocean floor and mafic in composition. It is<br />
therefore easily drawn into Earth. As it descends, the edge of<br />
the plate bends and shifts causing earthquakes. Descending<br />
plates are cooler than their surroundings so they stay rigid<br />
until the have absorbed heat. Seismologists therefore observe<br />
many earthquakes in these regions. Subduction zone earthquakes<br />
can be large because the brittle rock can absorb a<br />
great deal of energy before it breaks. The earthquakes can<br />
also have deep foci because the descending slab of lithosphere<br />
is cooler and less bendable than other rocks at the same<br />
depth. Observation of deep-focus earthquakes has given geologists<br />
an important tool that allows them to locate the plates<br />
as they move into Earth at subduction zones. Descending<br />
plates are the only place where earthquakes can originate<br />
from deep within Earth.<br />
On the eastern side of the Peru-Chile Trench, most of the<br />
continental, felsic rocks are too light to be drawn down by<br />
subduction. They therefore bend, break, and pile up to make<br />
intensely folded and faulted mountains. In fact, the Andes<br />
Mountains along the western side of South America are second<br />
only to mountains of Asia in height. Some of the felsic
212 CHAPTER 8: PLATE TECTONICS<br />
rocks from the South American side of the subduction zone<br />
are drawn down.<br />
You may recall from <strong>Chapter</strong> 5 that felsic minerals generally<br />
melt at a lower temperature than do mafic minerals.<br />
Therefore, as they absorb heat from their surroundings and<br />
from friction caused by plate movements, felsic rocks are the<br />
first to melt. The change to magma makes the rock fluid. Due<br />
to felsic magma’s low density, it rises toward the surface. For<br />
this reason, subduction zones are regions of volcanic activity.<br />
Unlike the mafic volcanoes of Hawaii, which generate longlasting<br />
streams of lava, felsic volcanoes tend to be more violent.<br />
Felsic magma is likely to contain water, which expands<br />
explosively when it reaches the surface. The 1980 eruption of<br />
Mount St. Helens in Washington is a good example of the<br />
eruption of less mafic lava.<br />
The edges of converging plates may both be continental<br />
crust. Because continental crust resists subduction, this type<br />
of collision can produce a great mass of jumbled rock that<br />
builds the world’s highest mountains. The Himalaya Mountains<br />
of Asia are the result of a collision between the northmoving<br />
Indian-Australian <strong>Plate</strong> and the giant plate that<br />
contains most of Europe and Asia. Measurements conducted<br />
in the Himalaya Mountains have shown uplift of several centimeters<br />
per year.<br />
Volcanoes are not restricted to land areas. Volcanoes are<br />
common where the oceanic portion of one plate dives under<br />
another ocean floor segment. Partial melting of the descending<br />
plate may result in a curved line of volcanic islands<br />
known an island arc. The Aleutian Islands, which extend to<br />
the westward from Alaska, and the islands of Japan are island<br />
arcs created at subduction zones.<br />
TRANSFORM BOUNDARIES Some plates do not converge or diverge.<br />
A transform boundary occurs when two plates slip<br />
past each other without creating new lithosphere or destroying<br />
old lithosphere. If you could straddle a transform fault for<br />
a long enough time, you would see one foot heading in one<br />
direction parallel to the fault and your other foot going in the<br />
opposite direction. The San Andreas Fault in California is
DOES EARTH’S GEOGRAPHY CHANGE? 213<br />
an excellent example of a transform boundary. In this area,<br />
the Pacific <strong>Plate</strong> is moving northwest with respect to the<br />
North American <strong>Plate</strong>. Motion along the fault is not continuous.<br />
At any place along the fault, the plates may be locked together<br />
by friction. When the force on the fault becomes great<br />
enough to overcome friction, the fault breaks suddenly and<br />
the plates move. This motion generates an earthquake.<br />
DOES EARTH’S GEOGRAPHY CHANGE?<br />
Scientists have used a wide variety of evidence to document<br />
how the continents have moved over millions of years. Ocean<br />
basins are known to be younger than the continents. This is<br />
because as new seafloor is created at the ocean ridges, old<br />
parts of the seafloor are drawn back into Earth’s interior at<br />
the ocean trenches. The dense basaltic rock of the ocean floor<br />
is constantly recycling. However, the continents resist subduction<br />
due to their lower density. Large parts of the continents<br />
are composed of rock much older than the rocks found<br />
anywhere on the ocean floor.<br />
Figure 8-12 on page 214 from the Earth Science Reference<br />
Tables shows the evolution of Earth’s surface over a period of<br />
more than 300 million years. Notice that 362 million years<br />
ago North America was located along the equator. As time<br />
passed, North America moved north along with Africa and<br />
South America. In the past 200 million years, North America<br />
separated from Africa and Europe, opening the North Atlantic<br />
Ocean. Africa and South America split apart more recently,<br />
forming the South Atlantic Ocean.<br />
Scientists cannot be sure how the plates will move in the<br />
future. But, if present trends continue, the Atlantic Ocean will<br />
become wider as separation continues at the Mid-Atlantic<br />
Ridge. As the American <strong>Plate</strong>s continue to push into the Nazca<br />
and Pacific plates, the mountains near the western edges of<br />
Americas could grow higher. (Mountain heights also depend<br />
on how fast erosion takes place.) In a few tens of millions of
214 CHAPTER 8: PLATE TECTONICS<br />
Figure 8-12 Movement of<br />
the North American continent<br />
(shown in black) and<br />
other continents over the<br />
past 362 million years. Note<br />
that the North American<br />
landmass initially moved<br />
north and then moved westward<br />
as the Atlantic Ocean<br />
opened.<br />
years, movement along the San Andreas Fault will carry Los<br />
Angeles northward to a position near San Francisco.<br />
One of the important principles in geology is sometimes<br />
stated as the present is the key to the past. This means that<br />
events in the prehistoric past are likely to be similar to<br />
changes that you can observe. It also means that if scientists<br />
understand the geological processes that are happening today,<br />
they can better predict what will happen in the future.
TERMS TO KNOW<br />
asthenosphere meteorologist polarity<br />
convergent plate boundary mid-ocean ridges radiation<br />
divergent plate boundary ocean trenches seafloor spreading<br />
fluid paradigm subduction zone<br />
hot spot plastic tectonics<br />
island arc plate tectonics transform boundary<br />
lithospheric plates<br />
CHAPTER REVIEW QUESTIONS<br />
CHAPTER REVIEW QUESTIONS 215<br />
1. Remains of Mesosaurus, an extinct freshwater reptile, have been found in<br />
bedrock of similar ages at locations X and Y on the map below.<br />
Which statement below represents the most logical conclusion to draw<br />
from this evidence?<br />
(1) Mesosaurus migrated across the ocean from location X to location Y.<br />
(2) Mesosaurus came into existence at widely separated locations at different<br />
times.<br />
(3) South America and Africa were joined when Mesosaurus was alive.<br />
(4) The present climates at locations X and Y are similar.
216 CHAPTER 8: PLATE TECTONICS<br />
2. Which form of heat flow is responsible for the slow circulation within<br />
Earth’s asthenosphere?<br />
(1) insolation<br />
(2) convection<br />
(3) conduction<br />
(4) radiation<br />
3. Convection currents within Earth’s mantle are making the Atlantic Ocean<br />
(1) less salty.<br />
(2) cooler.<br />
(3) wider.<br />
(4) narrower.<br />
4. What is the approximate temperature at the boundary between the asthenosphere<br />
and the stiffer mantle?<br />
(1) 600°C (3) 2600°C<br />
(2) 1000°C (4) 3000°C<br />
Use the information in the following map and data table to answer questions<br />
5 and 6. The map shows the locations of volcanic islands and seamounts that<br />
erupted on the sea floor of the Pacific <strong>Plate</strong> as it moved northwest over a<br />
stationary hot spot beneath the lithosphere. The hot spot is currently under<br />
Kilauea.
Data Table<br />
Age of Volcanic Features<br />
Volcanic Feature Distance from Kilauea (km) Age (millions of years)<br />
. .<br />
Kauai 545 5.6<br />
Nihoa 800 6.9<br />
Necker 1070 10.4<br />
Midway 2450 16.2<br />
Suiko seamount 4950 41.0<br />
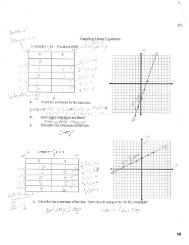
5. Approximately how far has location X moved from its original position over<br />
the hot spot?<br />
(1) 3600 km<br />
(2) 2500 km<br />
(3) 1800 km<br />
(4) 20 km<br />
6. According to the data table, what is the approximate speed at which the<br />
island of Kauai has been moving away from the mantle hot spot, in kilometers<br />
per million years?<br />
(1) 1<br />
(2) 10<br />
(3) 100<br />
(4) 1000<br />
CHAPTER REVIEW QUESTIONS 217<br />
7. Which lithospheric plate boundary features are located at Y and Z?<br />
(1) trenches created by the subduction of the Pacific <strong>Plate</strong><br />
(2) rift valleys created by seafloor spreading of the Pacific <strong>Plate</strong><br />
(3) secondary plates created by volcanic activity within the Pacific <strong>Plate</strong><br />
(4) mid-ocean ridges created by faulting below the Pacific <strong>Plate</strong><br />
8. The Himalaya Mountains are located along a portion of the southern<br />
boundary of the Eurasian <strong>Plate</strong>. Near the top of Mt. Everest (29,028 feet)<br />
in the Himalaya Mountains climbers have found fossilized marine shells
218 CHAPTER 8: PLATE TECTONICS<br />
in the surface bedrock. From this observation, which statement is the best<br />
inference about the origin of the Himalaya Mountains?<br />
(1) The Himalaya Mountains were formed by volcanic activity.<br />
(2) Sea level has been lowered about 29,000 feet since the shells were<br />
fossilized.<br />
(3) The bedrock containing the fossil shells is part of an uplifted seafloor.<br />
(4) The Himalaya Mountains formed at a divergent plate boundary.<br />
9. The diagram below shows land features that have been disrupted by an<br />
earthquake.<br />
Which type of crustal movement most likely caused the displacement of<br />
features in this area?<br />
(1) vertical lifting of surface rock (3) downwarping of the crust<br />
(2) folding of surface rock (4) movement along a transform fault<br />
Use the information in the diagram below to answer questions 10 and 11. The<br />
diagram shows the locations of deep-sea core drilling sites numbered 1–4.
10. At point A, the East Pacific Ridge is the boundary between the<br />
(1) Cocos <strong>Plate</strong> and the North American <strong>Plate</strong>.<br />
(2) South American <strong>Plate</strong> and the Nazca <strong>Plate</strong>.<br />
(3) Pacific <strong>Plate</strong> and the South American <strong>Plate</strong>.<br />
(4) Pacific <strong>Plate</strong> and the Nazca <strong>Plate</strong>.<br />
11. At which drilling site would the oldest bedrock most likely be found?<br />
(1) 1 (3) 3<br />
(2) 2 (4) 4<br />
12. Compared with the thickness and density of the continental crust of South<br />
America, the oceanic crust of the Pacific floor is<br />
(1) thinner and less dense.<br />
(2) thinner and more dense.<br />
(3) thicker and less dense.<br />
(4) thicker and more dense.<br />
Base your answers to questions 13–15 on the following diagram.<br />
13. The Peru-Chile Trench marks the boundary between the<br />
(1) Pacific <strong>Plate</strong> and the Antarctic <strong>Plate</strong>.<br />
(2) Nazca <strong>Plate</strong> and the South American <strong>Plate</strong>.<br />
(3) North American <strong>Plate</strong> and the Cocos <strong>Plate</strong>.<br />
(4) Caribbean <strong>Plate</strong> and the Scotia <strong>Plate</strong>.<br />
CHAPTER REVIEW QUESTIONS 219
220 CHAPTER 8: PLATE TECTONICS<br />
14. In which diagram do the arrows best represent the motion of Earth’s crust<br />
at the Peru-Chile Trench?<br />
15. Which observation provides the best evidence for the pattern of crustal<br />
movement at the Peru-Chile Trench?<br />
(1) the direction of flow of warm ocean currents<br />
(2) the mineral composition of samples of mafic mantle rock<br />
(3) comparison of the rates of sediment deposition<br />
(4) the locations of shallow focus and deep focus earthquakes<br />
Open-Ended Questions<br />
16. What evidence indicates that lithospheric plates move over Earth’s surface.<br />
17. How is energy moved from one place to another in heat flow by convection?<br />
18. Earthquakes are not evenly distributed over Earth. Why are earthquakes<br />
common along the west coast of the continental United States?<br />
19. How can plates move apart at the mid-ocean ridges and not leave a deep<br />
gap in the lithosphere?<br />
20. Classify each of the plate boundaries listed below as divergent, convergent,<br />
or transform.<br />
(a) East Pacific Ridge<br />
(b) Aleutian Trench<br />
(c) Western side of South American <strong>Plate</strong><br />
(d) San Andreas Fault