2011-2012 Common Data Set - Framingham State University
2011-2012 Common Data Set - Framingham State University
2011-2012 Common Data Set - Framingham State University

Create successful ePaper yourself
Turn your PDF publications into a flip-book with our unique Google optimized e-Paper software.
B1<br />
<strong>Common</strong> <strong>Data</strong> <strong>Set</strong> <strong>2011</strong>-<strong>2012</strong><br />
B1<br />
FULL-TIME PART-TIME<br />
B1 Men Women Men Women<br />
B1 Undergraduates<br />
B1 Degree-seeking, first-time<br />
freshmen 326 594 3 1<br />
B1 Other first-year, degree-seeking 147 211 23 51<br />
B1 All other degree-seeking 759 1,460 126 184<br />
B1 Total degree-seeking 1,232 2,265 152 236<br />
B1 All other undergraduates enrolled<br />
in credit courses 73 51 153 159<br />
B1 Total undergraduates 1,305 2,316 305 395<br />
B1 Graduate<br />
B1 Degree-seeking, first-time 10 23 55 162<br />
B1 All other degree-seeking 3 47 128 503<br />
B1 All other graduates enrolled in<br />
credit courses 1 2 180 980<br />
B1 Total graduate 14 72 363 1645<br />
B1 Total all undergraduates<br />
4,321<br />
B1 Total all graduate<br />
2,094<br />
B1 GRAND TOTAL ALL STUDENTS<br />
6,415<br />
B2<br />
B2<br />
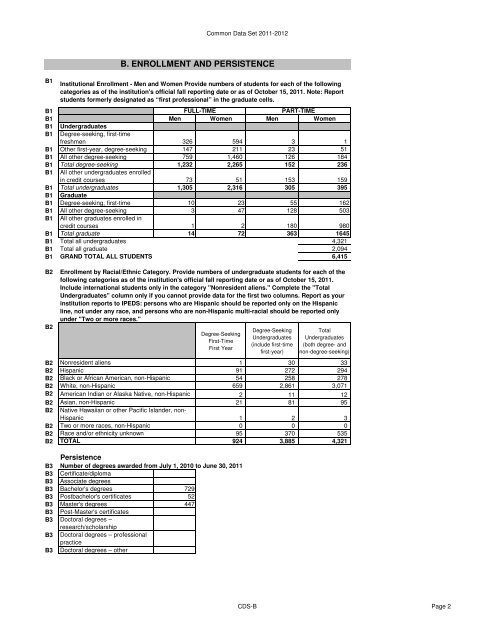
B. ENROLLMENT AND PERSISTENCE<br />
Institutional Enrollment - Men and Women Provide numbers of students for each of the following<br />
categories as of the institution's official fall reporting date or as of October 15, <strong>2011</strong>. Note: Report<br />
students formerly designated as “first professional” in the graduate cells.<br />
Enrollment by Racial/Ethnic Category. Provide numbers of undergraduate students for each of the<br />
following categories as of the institution's official fall reporting date or as of October 15, <strong>2011</strong>.<br />
Include international students only in the category "Nonresident aliens." Complete the "Total<br />
Undergraduates" column only if you cannot provide data for the first two columns. Report as your<br />
institution reports to IPEDS: persons who are Hispanic should be reported only on the Hispanic<br />
line, not under any race, and persons who are non-Hispanic multi-racial should be reported only<br />
under "Two or more races."<br />
Degree-Seeking<br />
First-Time<br />
First Year<br />
Degree-Seeking<br />
Undergraduates<br />
(include first-time<br />
first-year)<br />
Total<br />
Undergraduates<br />
(both degree- and<br />
non-degree-seeking)<br />
B2 Nonresident aliens<br />
1 30 33<br />
B2 Hispanic<br />
91 272 294<br />
B2 Black or African American, non-Hispanic<br />
54 258 278<br />
B2 White, non-Hispanic<br />
659 2,861 3,071<br />
B2 American Indian or Alaska Native, non-Hispanic<br />
2 11 12<br />
B2 Asian, non-Hispanic<br />
21 81 95<br />
B2 Native Hawaiian or other Pacific Islander, non-<br />
Hispanic<br />
1 2 3<br />
B2 Two or more races, non-Hispanic<br />
0 0 0<br />
B2 Race and/or ethnicity unknown<br />
95 370 535<br />
B2 TOTAL<br />
924 3,885 4,321<br />
Persistence<br />
B3 Number of degrees awarded from July 1, 2010 to June 30, <strong>2011</strong><br />
B3 Certificate/diploma<br />
B3 Associate degrees<br />
B3 Bachelor's degrees 729<br />
B3 Postbachelor's certificates 52<br />
B3 Master's degrees 447<br />
B3 Post-Master's certificates<br />
B3 Doctoral degrees –<br />
research/scholarship<br />
B3 Doctoral degrees – professional<br />
practice<br />
B3 Doctoral degrees – other<br />
CDS-B Page 2