2011-2012 Common Data Set - Framingham State University
2011-2012 Common Data Set - Framingham State University
2011-2012 Common Data Set - Framingham State University

You also want an ePaper? Increase the reach of your titles
YUMPU automatically turns print PDFs into web optimized ePapers that Google loves.
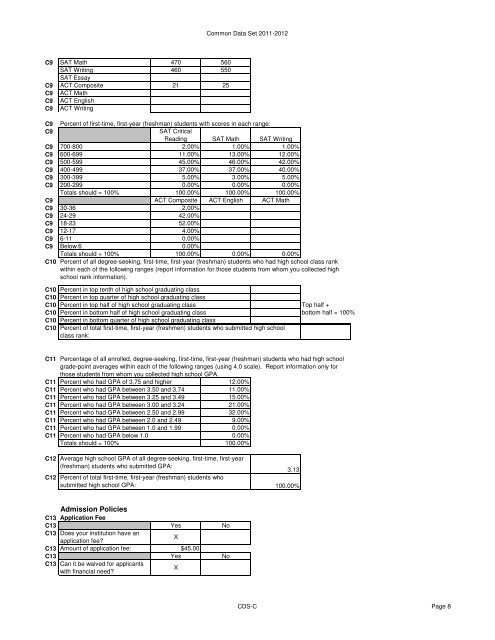
C9 SAT Math 470 560<br />
SAT Writing 460 550<br />
SAT Essay<br />
C9 ACT Composite 21 25<br />
C9 ACT Math<br />
C9 ACT English<br />
C9 ACT Writing<br />
<strong>Common</strong> <strong>Data</strong> <strong>Set</strong> <strong>2011</strong>-<strong>2012</strong><br />
C9 Percent of first-time, first-year (freshman) students with scores in each range:<br />
C9 SAT Critical<br />
Reading SAT Math SAT Writing<br />
C9 700-800 2.00% 1.00% 1.00%<br />
C9 600-699 11.00% 13.00% 12.00%<br />
C9 500-599 45.00% 46.00% 42.00%<br />
C9 400-499 37.00% 37.00% 40.00%<br />
C9 300-399 5.00% 3.00% 5.00%<br />
C9 200-299 0.00% 0.00% 0.00%<br />
Totals should = 100% 100.00% 100.00% 100.00%<br />
C9 ACT Composite ACT English ACT Math<br />
C9 30-36 2.00%<br />
C9 24-29 42.00%<br />
C9 18-23 52.00%<br />
C9 12-17 4.00%<br />
C9 6-11 0.00%<br />
C9 Below 6 0.00%<br />
Totals should = 100% 100.00% 0.00% 0.00%<br />
C10 Percent of all degree-seeking, first-time, first-year (freshman) students who had high school class rank<br />
within each of the following ranges (report information for those students from whom you collected high<br />
school rank information).<br />
C10 Percent in top tenth of high school graduating class<br />
C10 Percent in top quarter of high school graduating class<br />
C10 Percent in top half of high school graduating class<br />
Top half +<br />
C10 Percent in bottom half of high school graduating class<br />
bottom half = 100%<br />
C10<br />
C10<br />
C11 Percentage of all enrolled, degree-seeking, first-time, first-year (freshman) students who had high school<br />
grade-point averages within each of the following ranges (using 4.0 scale). Report information only for<br />
those students from whom you collected high school GPA.<br />
C11 Percent who had GPA of 3.75 and higher<br />
12.00%<br />
C11 Percent who had GPA between 3.50 and 3.74<br />
11.00%<br />
C11 Percent who had GPA between 3.25 and 3.49<br />
15.00%<br />
C11 Percent who had GPA between 3.00 and 3.24<br />
21.00%<br />
C11 Percent who had GPA between 2.50 and 2.99<br />
32.00%<br />
C11 Percent who had GPA between 2.0 and 2.49<br />
9.00%<br />
C11 Percent who had GPA between 1.0 and 1.99<br />
0.00%<br />
C11 Percent who had GPA below 1.0<br />
0.00%<br />
Totals should = 100%<br />
100.00%<br />
C12<br />
C12<br />
Percent in bottom quarter of high school graduating class<br />
Percent of total first-time, first-year (freshmen) students who submitted high school<br />
class rank:<br />
Average high school GPA of all degree-seeking, first-time, first-year<br />
(freshman) students who submitted GPA:<br />
Percent of total first-time, first-year (freshman) students who<br />
submitted high school GPA:<br />
Admission Policies<br />
C13 Application Fee<br />
C13 Yes No<br />
C13 Does your institution have an<br />
application fee?<br />
X<br />
C13 Amount of application fee: $45.00<br />
C13 Yes No<br />
C13 Can it be waived for applicants<br />
with financial need?<br />
X<br />
3.13<br />
100.00%<br />
CDS-C Page 8