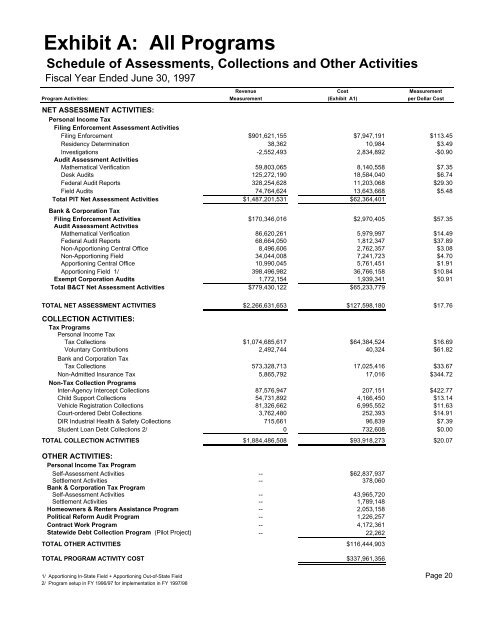
Exhibit A: All Programs Schedule <strong>of</strong> Assessments, Collections and Other Activities Fis<strong>ca</strong>l Year Ended June 30, 1997 Revenue Cost Measurement Program Activities: Measurement (Exhibit A1) per Dollar Cost NET ASSESSMENT ACTIVITIES: Personal Income Tax Filing Enforcement Assessment Activities Filing Enforcement $901,621,155 $7,947,191 $113.45 Residency Determination 38,362 10,984 $3.49 Investigations -2,552,493 2,834,892 -$0.90 Audit Assessment Activities Mathemati<strong>ca</strong>l Verifi<strong>ca</strong>tion 59,803,065 8,140,558 $7.35 Desk Audits 125,272,190 18,584,040 $6.74 Federal Audit Reports 328,254,628 11,203,068 $29.30 Field Audits 74,764,624 13,643,668 $5.48 Total PIT Net Assessment Activities $1,487,201,531 $62,364,401 Bank & Corporation Tax Filing Enforcement Activities $170,346,016 $2,970,405 $57.35 Audit Assessment Activities Mathemati<strong>ca</strong>l Verifi<strong>ca</strong>tion 86,620,261 5,979,997 $14.49 Federal Audit Reports 68,664,050 1,812,347 $37.89 Non-Apportioning Central Office 8,496,606 2,762,357 $3.08 Non-Apportioning Field 34,044,008 7,241,723 $4.70 Apportioning Central Office 10,990,045 5,761,451 $1.91 Apportioning Field 1/ 398,496,982 36,766,158 $10.84 Exempt Corporation Audits 1,772,154 1,939,341 $0.91 Total B&CT Net Assessment Activities $779,430,122 $65,233,779 TOTAL NET ASSESSMENT ACTIVITIES $2,266,631,653 $127,598,180 $17.76 COLLECTION ACTIVITIES: Tax Programs Personal Income Tax Tax Collections $1,074,685,617 $64,384,524 $16.69 Voluntary Contributions 2,492,744 40,324 $61.82 Bank and Corporation Tax Tax Collections 573,328,713 17,025,416 $33.67 Non-Admitted Insurance Tax 5,865,792 17,016 $344.72 Non-Tax Collection Programs Inter-Agency Intercept Collections 87,576,947 207,151 $422.77 Child Support Collections 54,731,892 4,166,450 $13.14 Vehicle Registration Collections 81,326,662 6,995,552 $11.63 Court-ordered Debt Collections 3,762,480 252,393 $14.91 DIR Industrial Health & Safety Collections 715,661 96,839 $7.39 Student Loan Debt Collections 2/ 0 732,608 $0.00 TOTAL COLLECTION ACTIVITIES $1,884,486,508 $93,918,273 $20.07 OTHER ACTIVITIES: Personal Income Tax Program Self-Assessment Activities -- $62,837,937 Settlement Activities -- 378,060 Bank & Corporation Tax Program Self-Assessment Activities -- 43,965,720 Settlement Activities -- 1,789,148 Homeowners & Renters Assistance Program -- 2,053,158 Politi<strong>ca</strong>l Reform Audit Program -- 1,226,257 Contract Work Program -- 4,172,361 <strong>State</strong>wide Debt Collection Program (Pilot Project) -- 22,262 TOTAL OTHER ACTIVITIES $116,444,903 TOTAL PROGRAM ACTIVITY COST $337,961,356 1/ Apportioning In-<strong>State</strong> Field + Apportioning Out-<strong>of</strong>-<strong>State</strong> Field Page 20 2/ Program setup in FY 1996/97 for implementation in FY 1997/98
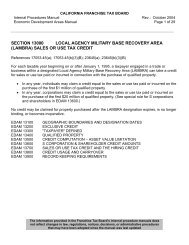
Exhibit A1: All Programs <strong>State</strong>ment <strong>of</strong> Operation Costs Fis<strong>ca</strong>l Year Ended June 30, 1997 Technology Accounts Receivable Executive & Research Legal Audit & Tax Policy Operations Departmental Totals Tax Programs Personal Income Tax Self-Assessment Activities Legislation and Development $ 22,457 $ 3,156,372 $ 1,094,445 $ 132,061 $ 627,659 $ 2,501,467 $ 2,110,653 $ 9,645,114 Return Forms 7,918 1,886,447 78,543 481 351,667 533,743 3,714,047 6,572,846 Return Processing 21,172 768,299 132 103 23,297 17,448,915 5,892,643 24,154,561 Estimate Processing 5,484 223,464 34 3 6,034 1,570,884 813,367 2,619,270 Taxpayer Assistance 37,633 1,715,835 27,387 3,345,861 1,833,195 6,879,191 4,088,248 17,927,350 Claims 4,703 108,283 29 556,025 6,053 813,198 430,505 1,918,796 Filing Enforcement $ 99,367 $ 7,858,700 $ 1,200,570 $ 4,034,534 $ 2,847,905 $ 29,747,398 $ 17,049,463 $ 62,837,937 Filing Enforcement $ 16,424 $ 1,879,984 $ 102 $ 515,543 $ 107,418 $ 2,806,460 $ 2,621,260 $ 7,947,191 Residence Determination 25 568 0 5,808 58 16 4,509 10,984 Investigation 7,187 1,548,196 85 25,092 846,401 233,606 174,325 2,834,892 $ 23,636 $ 3,428,748 $ 187 $ 546,443 $ 953,877 $ 3,040,082 $ 2,800,094 $ 10,793,067 Audit Activities Math Verifi<strong>ca</strong>tion $ 13,699 $ 319,850 $ 85 $ 8 $ 15,074 $ 6,266,448 $ 1,525,394 $ 8,140,558 Desk Audits 46,672 1,930,476 1,800,452 9,276,992 80,671 2,153,101 3,295,676 18,584,040 Federal Audit Reports 24,638 570,694 371,478 6,104,674 27,112 772,772 3,331,700 11,203,068 Field Audits 35,942 1,649,281 537,504 7,842,803 39,654 1,984,733 1,553,751 13,643,668 $ 120,951 $ 4,470,301 $ 2,709,519 $ 23,224,477 $ 162,511 $ 11,177,054 $ 9,706,521 $ 51,571,334 Tax Collections $ 151,531 $ 9,278,628 $ 12,638 $ 21,012,748 $ 11,231,676 $ 9,641,183 $ 13,056,120 $ 64,384,524 Settlement Authority 872 20,082 310,072 18 960 575 45,481 378,060 Voluntary Contributions 68 1,580 0 0 76 46 38,554 40,324 $ 396,425 $ 25,058,039 $ 4,232,986 $ 48,818,220 $ 15,197,005 $ 53,606,338 $ 42,696,233 $ 190,005,246 Bank and Corporation Tax Self-Assessment Activities Legislation and Development $ 10,585 $ 1,496,967 $ 1,098,852 $ 95,381 $ 618,486 $ 510,309 $ 2,112,837 $ 5,943,417 Return Forms 2,171 327,649 83,090 1 153,582 239,205 731,119 1,536,817 Return Processing 30,302 882,175 188 559,453 80,570 8,796,257 8,931,814 19,280,759 Estimate Processing 632 53,425 4 0 695 189,082 230,707 474,545 Taxpayer Assistance 18,415 463,364 30,850 1,611,307 184,019 4,060,527 4,624,095 10,992,577 Claims 9,976 229,713 62 2,168,598 16,094 993,151 2,320,011 5,737,605 $ 72,081 $ 3,453,293 $ 1,213,046 $ 4,434,740 $ 1,053,446 $ 14,788,531 $ 18,950,583 $ 43,965,720 Filing Enforcement 5,643 460,184 35 488,481 111,161 1,000,063 904,838 2,970,405 Audit Activities Math Verifi<strong>ca</strong>tion $ 10,948 $ 252,092 $ 68 $ 140 $ 12,047 $ 3,608,785 $ 2,095,917 $ 5,979,997 Federal Audit Reports 3,694 85,063 27,076 1,050,833 4,065 150,253 491,363 1,812,347 Non-Apportioning -- Central Office 4,771 194,811 152,711 1,256,740 5,249 416,483 731,592 2,762,357 Non-Apportioning -- Field 15,429 515,754 88,300 3,756,724 17,109 704,035 2,144,372 7,241,723 Apportioning -- Central Office 9,049 863,598 222,027 1,453,076 9,993 1,629,072 1,574,636 5,761,451 Apportioning -- Field 68,563 1,740,493 1,315,697 24,159,228 75,446 45,170 9,361,561 36,766,158 Exempt Corporations 4,162 135,104 15,609 1 29,526 1,168,054 586,885 1,939,341 $ 116,616 $ 3,786,915 $ 1,821,488 $ 31,676,742 $ 153,435 $ 7,721,852 $ 16,986,326 $ 62,263,374 Tax Collections 33,732 1,453,617 9,046 5,404,135 3,074,587 1,464,995 5,585,304 17,025,416 Settlement Authority 3,755 86,463 1,283,600 6,916 4,132 5,050 399,232 1,789,148 $ 231,827 $ 9,240,472 $ 4,327,215 $ 42,011,014 $ 4,396,761 $ 24,980,491 $ 42,826,283 $ 128,014,063 Non-Admitted Insurance Tax 19 429 0 0 21 14,541 2,006 17,016 $ 628,271 $ 34,298,940 $ 8,560,201 $ 90,829,234 $ 19,593,787 $ 78,601,370 $ 85,524,522 $ 318,036,325 Non-Tax Collection Program Inter-Agency Intercept Collections $ 390 $ 14,904 $ 5 $ 73,647 $ 35,253 $ 8,328 $ 74,624 $ 207,151 Child Support Collections 8,518 365,132 3,695 1,598,494 1,164,735 368,773 657,103 4,166,450 Vehicle Registration Collections 15,275 522,211 5,545 2,877,862 1,662,250 435,847 1,476,562 6,995,552 Court-ordered Debt Collections 0 26 0 189,757 49,381 39 13,190 252,393 Industrial Health & Safety Collections 235 15,793 2 38,909 24,674 2,726 14,500 96,839 Student Loan Debt Collections 0 0 0 95,733 597,400 16,458 23,017 732,608 <strong>State</strong>wide Debt Collections 116 2,678 1 19,262 128 77 0 22,262 $ 24,534 $ 920,744 $ 9,248 $ 4,893,664 $ 3,533,821 $ 832,248 $ 2,258,996 $ 12,473,255 Other Non-Tax Programs Homeowners & Renters Assistance $ 5,180 $ 563,375 $ 32 $ 102,202 $ 196,541 $ 892,776 $ 293,052 $ 2,053,158 Politi<strong>ca</strong>l Reform Audit 2938 796169 18 86 404299 14965 7782 1,226,257 Other Contracts 5,584 248,056 36 2 10,790 2,708,329 1,199,564 4,172,361 $ 13,702 $ 1,607,600 $ 86 $ 102,290 $ 611,630 $ 3,616,070 $ 1,500,398 $ 7,451,776 Total Departmental Costs $ 666,507 $ 36,827,284 $ 8,569,535 $ 95,825,188 $ 23,739,238 $ 83,049,688 $ 89,283,916 $ 337,961,356 Page 21 Page 22