Auswirkungen des Klimawandels auf den thermischen Komfort in ...
Auswirkungen des Klimawandels auf den thermischen Komfort in ...
Auswirkungen des Klimawandels auf den thermischen Komfort in ...

You also want an ePaper? Increase the reach of your titles
YUMPU automatically turns print PDFs into web optimized ePapers that Google loves.
Impacts of Climate Change on the Thermal Comfort of Office Build<strong>in</strong>gs<br />
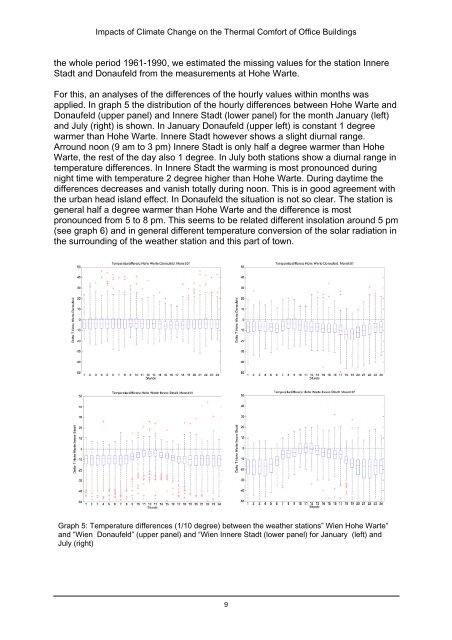
the whole period 1961-1990, we estimated the miss<strong>in</strong>g values for the station Innere<br />
Stadt and Don<strong>auf</strong>eld from the measurements at Hohe Warte.<br />
For this, an analyses of the differences of the hourly values with<strong>in</strong> months was<br />
applied. In graph 5 the distribution of the hourly differences between Hohe Warte and<br />
Don<strong>auf</strong>eld (upper panel) and Innere Stadt (lower panel) for the month January (left)<br />
and July (right) is shown. In January Don<strong>auf</strong>eld (upper left) is constant 1 degree<br />
warmer than Hohe Warte. Innere Stadt however shows a slight diurnal range.<br />
Arround noon (9 am to 3 pm) Innere Stadt is only half a degree warmer than Hohe<br />
Warte, the rest of the day also 1 degree. In July both stations show a diurnal range <strong>in</strong><br />
temperature differences. In Innere Stadt the warm<strong>in</strong>g is most pronounced dur<strong>in</strong>g<br />
night time with temperature 2 degree higher than Hohe Warte. Dur<strong>in</strong>g daytime the<br />
differences decreases and vanish totally dur<strong>in</strong>g noon. This is <strong>in</strong> good agreement with<br />
the urban head island effect. In Don<strong>auf</strong>eld the situation is not so clear. The station is<br />
general half a degree warmer than Hohe Warte and the difference is most<br />
pronounced from 5 to 8 pm. This seems to be related different <strong>in</strong>solation around 5 pm<br />
(see graph 6) and <strong>in</strong> general different temperature conversion of the solar radiation <strong>in</strong><br />
the surround<strong>in</strong>g of the weather station and this part of town.<br />
Graph 5: Temperature differences (1/10 degree) between the weather stations” Wien Hohe Warte”<br />
and “Wien Don<strong>auf</strong>eld” (upper panel) and “Wien Innere Stadt (lower panel) for January (left) and<br />
July (right)<br />
9