Auswirkungen des Klimawandels auf den thermischen Komfort in ...
Auswirkungen des Klimawandels auf den thermischen Komfort in ...
Auswirkungen des Klimawandels auf den thermischen Komfort in ...

Create successful ePaper yourself
Turn your PDF publications into a flip-book with our unique Google optimized e-Paper software.
Impacts of Climate Change on the Thermal Comfort of Office Build<strong>in</strong>gs<br />
1.5 Results of Analysis of climate data sets<br />
1.5.1 Average external air temperature<br />
The comparison of air temperatures of the employed data sets displays a difference<br />
<strong>in</strong> mean monthly temperatures between data sets 61 and 2050 respectively of nearly<br />
3K on a yearly basis. A dist<strong>in</strong>ct difference is already discernable between “howa 61”<br />
and “howa 80”: the further one is roughly represent<strong>in</strong>g the immediate past, while the<br />
latter one can be regarded as represent<strong>in</strong>g today’s situation; In this, an overall<br />
<strong>in</strong>crease <strong>in</strong> average temperature of more than 1 K has <strong>in</strong> fact already been recorded.<br />
This is a bigger difference than is to be expected for the time lap between “howa 80”<br />
and “howa 2025”.<br />
It has to be kept <strong>in</strong> m<strong>in</strong>d that various climate data sets frequently <strong>in</strong> use today <strong>in</strong><br />
thermal simulations for siz<strong>in</strong>g of cool<strong>in</strong>g and heat<strong>in</strong>g plants <strong>in</strong> newly to be build office<br />
blocks roughly date to the period of “howa 61”. Here<strong>in</strong> lays a considerable danger:<br />
while energy requirements under the use of such climate data sets tend to be<br />
oversized <strong>in</strong> the case of heat<strong>in</strong>g, they run risk of underestimat<strong>in</strong>g the cool<strong>in</strong>g demand<br />
and may even result <strong>in</strong> too low maximum cool<strong>in</strong>g loads and consequent non<br />
satisfy<strong>in</strong>g comfort conditions, e.g. frequent overheat<strong>in</strong>g <strong>in</strong> rooms of these new<br />
build<strong>in</strong>gs.<br />
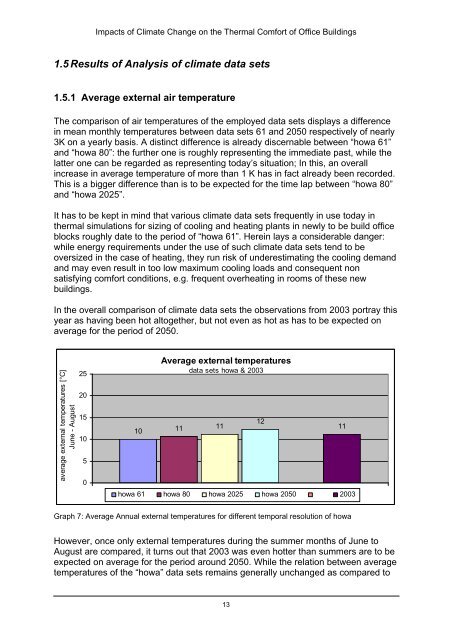
In the overall comparison of climate data sets the observations from 2003 portray this<br />
year as hav<strong>in</strong>g been hot altogether, but not even as hot as has to be expected on<br />
average for the period of 2050.<br />
average external temperatures [°C]<br />
June - August<br />
25<br />
20<br />
15<br />
10<br />
5<br />
0<br />
Average external temperatures<br />
data sets howa & 2003<br />
10 11 11<br />
howa 61 howa 80 howa 2025 howa 2050 2003<br />
12<br />
11<br />
Graph 7: Average Annual external temperatures for different temporal resolution of howa<br />
However, once only external temperatures dur<strong>in</strong>g the summer months of June to<br />
August are compared, it turns out that 2003 was even hotter than summers are to be<br />
expected on average for the period around 2050. While the relation between average<br />
temperatures of the “howa” data sets rema<strong>in</strong>s generally unchanged as compared to<br />
13