Presentation Deutsche Bank German & Austrian ... - Gerresheimer
Presentation Deutsche Bank German & Austrian ... - Gerresheimer
Presentation Deutsche Bank German & Austrian ... - Gerresheimer

You also want an ePaper? Increase the reach of your titles
YUMPU automatically turns print PDFs into web optimized ePapers that Google loves.
<strong>Deutsche</strong> <strong>Bank</strong><br />
<strong>German</strong> & <strong>Austrian</strong> Corporate Conference<br />
Frankfurt, May 19 & 20, 2011<br />
Uwe Röhrhoff, CEO<br />
1
Disclaimer<br />
• This presentation may contain certain forward-looking statements, including<br />
assumptions, opinions and views of the Company or cited from third party sources.<br />
Various known and unknown risks, uncertainties and other factors could cause the<br />
actual results, financial position, development or performance of the Company to<br />
differ materially from the estimations expressed or implied herein.<br />
• The Company does not guarantee that the assumptions underlying such forwardlooking<br />
statements are free from errors nor does the Company accept any<br />
responsibility for the future accuracy of the opinions expressed in this presentation or<br />
the actual occurrence of the forecast development.<br />
• No representation or warranty (express or implied) is made as to, and no reliance<br />
should be placed on, any information, including projections, estimates, targets and<br />
opinions, contained herein, and no liability whatsoever is accepted as to any errors,<br />
omissions or misstatements contained herein, and, accordingly, none of the Company<br />
or any of its parent or subsidiary undertakings or any of such person‘s officers,<br />
directors or employees accepts any liability whatsoever arising directly or indirectly<br />
from the use of this document.<br />
2
Agenda<br />
1<br />
Company description<br />
2<br />
Appendix<br />
3
<strong>Gerresheimer</strong> at a glance<br />
Key facts<br />
• Leading international manufacturer high-quality specialty products<br />
made of glass and plastic for the global pharma and healthcare industry<br />
• Whole range of pharmaceutical products enable easy drug administration<br />
1) Financial year ends on 30 November<br />
4
Clear focus on pharma and healthcare<br />
82%<br />
Pharma and<br />
Healthcare<br />
12%<br />
Cosmetics<br />
Revenues 2010<br />
EUR 1,025m<br />
6%<br />
Other<br />
5
Organizational structure<br />
Consolidated net revenues FY 2010: EUR 1,024.8m<br />
Tubular Glass Plastic Systems Moulded Glass<br />
Life Science<br />
Research<br />
EUR 310.4m<br />
30% of total revenues<br />
EUR 307.9m<br />
30% of total revenues<br />
EUR 327.3m<br />
31% of total revenues<br />
EUR 95.0m<br />
9% of total revenues<br />
6
<strong>Gerresheimer</strong> is a leading global player<br />
Region Locations Employees<br />
Europe 20 5,116<br />
North America 9 1,709<br />
Other regions 15 2,650<br />
Total 44 9,475<br />
As of November 30, 2010<br />
Locations<br />
7
Europe & North America most important,<br />
pharmerging markets gaining in significance<br />
63%<br />
Europe (23% <strong>German</strong>y)<br />
24%<br />
North America<br />
Revenues 2010<br />
EUR 1,025m<br />
13%<br />
Other regions<br />
8
Highly attractive end market trends<br />
• Aging of world population<br />
• Development of healthcare systems in emerging countries<br />
• Growing number of acute and chronic diseases<br />
• Accelerating pace in drug development<br />
• Growth in biotech drugs and generics<br />
• Outsourcing trend of drug delivery and primary packaging solutions<br />
• Trend towards self-medication<br />
9
Well-diversified blue-chip customer base<br />
Pharma and healthcare<br />
Other<br />
Net revenues to TOP 50 customers<br />
(FY 2010) in EUR m<br />
374<br />
49%<br />
57%<br />
62%<br />
65%<br />
Cumulative<br />
share<br />
36%<br />
125<br />
88<br />
48<br />
33<br />
Top 10 11-20 21-30 31-40 41-50<br />
<strong>Gerresheimer</strong> has close long-term relationships with<br />
leading global accounts…<br />
…with limited dependence on individual customers.<br />
10
Leading market positions in attractive<br />
niche markets<br />
Division<br />
Tubular Glass<br />
(Injectable Glass<br />
and Systems)<br />
Plastic Systems<br />
(Plastic Drug Delivery<br />
and Systems)<br />
Moulded<br />
Glass<br />
Life<br />
Science<br />
Research<br />
Product<br />
Tubing<br />
Syringes<br />
Other<br />
Injectables<br />
Plastic<br />
Packaging<br />
Inhalation<br />
(DPI) 1<br />
Diabetes<br />
Diagnostics<br />
2<br />
Pens<br />
Pharma<br />
(Type I)<br />
Glass<br />
Consumables &<br />
Equipment<br />
Europe # 2<br />
# 2 # 2# 2 # 1 # 1 # 2 started<br />
# 2<br />
North<br />
America<br />
# 1 # 2 # # 1 1 # 3<br />
# 1 # 1<br />
2<br />
Emerging<br />
Markets<br />
# 2 # 1 # 1<br />
started<br />
# 1<br />
# 1 (South America)<br />
# 1<br />
(China)<br />
(China)<br />
(South America)<br />
(China)<br />
1) DPI = Dry Powder Inhaler<br />
2) Includes lancets and lancing devices only<br />
Source: Company estimates<br />
11
<strong>Gerresheimer</strong> provides solutions across all key<br />
product categories<br />
Division<br />
Product<br />
Tubular Glass<br />
(Injectable Glass and<br />
Systems)<br />
Glass<br />
Tubing<br />
Syringes<br />
Other<br />
Injectables<br />
Plastic Systems<br />
(Plastic Drug Delivery and Systems)<br />
Inhalers<br />
Plastic<br />
Packaging<br />
Diabetes<br />
Diagnostics<br />
2<br />
Pens<br />
Moulded Glass<br />
Pharma<br />
(Type I)<br />
OTC liquids and<br />
Syrups (Type II<br />
& III)<br />
Life Science<br />
Research<br />
Glass<br />
Consumables &<br />
Equipment<br />
<strong>Gerresheimer</strong> <br />
<br />
Schott<br />
Becton Dickinson 1 <br />
Amcor Alcan 1<br />
Ompi<br />
Consort Medical 1<br />
<br />
<br />
<br />
West Pharma 1 <br />
<br />
<br />
Rexam 1 <br />
Facet<br />
Ypsomed 1<br />
<br />
Desjonquères <br />
Rocco Bormioli <br />
<br />
Duran<br />
Corning 1<br />
<br />
<br />
Nypro <br />
<br />
<br />
<br />
<br />
<br />
<br />
1) Public company<br />
2) Includes lancets and lancing devices only<br />
Source: Company estimates<br />
12
<strong>Gerresheimer</strong>’s strategy<br />
Organic<br />
growth<br />
Growth<br />
through<br />
acquisitions<br />
• Base growth: Existing<br />
customers and regions<br />
• New products for existing<br />
customers<br />
• New regions and customers<br />
• Extension of product<br />
offerings/technology<br />
• Extension of geographic<br />
footprint<br />
• Consolidation/scale<br />
• Pharma and<br />
healthcare<br />
• Global<br />
market<br />
leadership<br />
positions<br />
13
Strong operational performance in financial year 2010<br />
Key group figures (EUR m)<br />
EBITDA 2<br />
TPS 1<br />
29.4<br />
+ 5.6%<br />
1,000.2<br />
Revenues 2 1,024.8<br />
186.2<br />
adjusted EBITDA<br />
+ 9.8%<br />
Margin<br />
204.5<br />
Group ex TPS<br />
970.8<br />
19.2% 20.0%<br />
2009 2010<br />
2009 2010<br />
Net income<br />
>100%<br />
46.7<br />
Net financial debt<br />
- 16.7%<br />
373.3<br />
311.0<br />
7.0<br />
2009 2010<br />
2009 2010<br />
1) The Technical Plastic Systems ("TPS") business was sold with effect from July 1, 2009<br />
2) Revenue growth for FY 2010 and adjusted EBITDA / adjusted EBITDA margin for FY2009 are shown excluding TPS<br />
14
Strong improvement of financial ratios in 2010<br />
Key financial ratios/figures<br />
Net debt 1 / adjusted EBITDA<br />
Capital expenditure (EUR m)<br />
2.0x<br />
1.5x<br />
86.4<br />
73.2<br />
2009 2010<br />
Capex / Revenues<br />
2009 2010<br />
8.6% 7.1%<br />
35.8%<br />
Equity ratio<br />
39.0%<br />
Net working capital 2 (EUR m)<br />
182.3 177.0<br />
2009 2010<br />
2009 2010<br />
NWC / Revenues 18.2% 17.3%<br />
1) Total amount of debt less cash and cash equivalents<br />
2) Average net working capital: Inventories (incl. prepayments) and trade receivables less trade payables and payments received on account of orders<br />
15
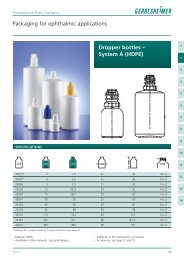
Good start to the financial year 2011<br />
Key group figures (EUR m)<br />
Revenues<br />
+ 5.2%<br />
224.8 236.6<br />
EBITDA<br />
adjusted EBITDA<br />
+ 9.0%<br />
38.3<br />
Margin<br />
41.8<br />
17.0% 17.7%<br />
Q1 2010 Q1 2011<br />
Q1 2010 Q1 2011<br />
Net income<br />
>100%<br />
7.1<br />
Net financial debt<br />
- 21.0%<br />
402.6<br />
318.2<br />
2.4<br />
Q1 2010 Q1 2011<br />
Q1 2010 Q1 2011<br />
16
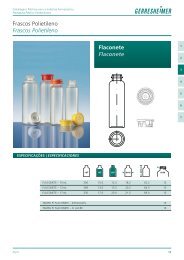
Vedat acquisition in April 2011 more than doubles revenues in South America<br />
Current setup<br />
in South America<br />
• Since 2007/2008 Buenos Aires<br />
Argentina<br />
• 3 plants in Sao Paulo<br />
• 1 plant in Buenos Plastic Packaging Aires<br />
• 500 employees<br />
Cotia<br />
Sao Paulo<br />
• Main products<br />
Brazil<br />
• plastic Plastic containers Packaging<br />
• insulin pens<br />
Vedat<br />
Embu, Sao Paulo, Brazil<br />
• Founded in 1962<br />
• 450 employees<br />
• 2010 revenues<br />
approx. EUR 45m<br />
• Clean room facilities<br />
• Main Products<br />
• closures<br />
• plastic containers<br />
• PET bottles<br />
17
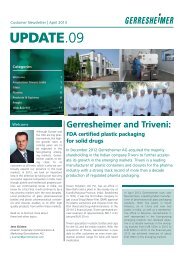
<strong>Gerresheimer</strong> Plastic Systems – Providing full service in South America<br />
The established <strong>Gerresheimer</strong> Plastic Systems products<br />
The expanded portfolio – Vedat‘s additional products<br />
18
Guidance FY 2011 update reflects inclusion of Vedat acquisition<br />
FY 2010<br />
as reported<br />
Guidance FY 2011<br />
As of Feb. 10, 2011<br />
Guidance FY 2011<br />
As of April 7, 2011<br />
Net revenues<br />
EUR 1,024.8m<br />
+3% to 4% at const. FX<br />
+6% to 7% at const. FX<br />
Adj. EBITDA margin<br />
20.0%<br />
About 20.0%<br />
About 20.0%<br />
Capex<br />
EUR 73.2m<br />
About EUR 80m<br />
About EUR 80m<br />
19
Agenda<br />
1<br />
Company description<br />
2<br />
Appendix<br />
20
Q1 2011 P&L overview<br />
Q1 2011<br />
EUR m<br />
Q1 2010<br />
EUR m<br />
Change<br />
in %<br />
Total revenues 236.6 224.8 +5.2<br />
Adjusted EBITDA 1 41.8 38.3 +9.0<br />
EBITA 21.5 18.6 +15.6<br />
Amortization of FV adjustments 4.7 6.3 -25.4<br />
Profit before interest and taxes<br />
(EBIT) 16.8 12.3 +36.6<br />
Financial result -6.9 -8.9 +22.5<br />
Profit before taxes 9.9 3.4 >100<br />
Net income 7.1 2.4 >100<br />
EPS in EUR 0.20 0.06 >100<br />
Adjusted EPS in EUR 2 0.30 0.22 +36.4<br />
1<br />
Earnings before financial result, income taxes, amortization of fair value adjustments, extraordinary depreciation, depreciation and<br />
amortization, restructuring expenses and one-off income and expenses<br />
2<br />
Adjusted net income after non-controlling interests divided by 31.4m shares<br />
21
Q1 2011: Revenues by division<br />
EUR m<br />
Q1 2011<br />
Change<br />
in %<br />
Change in % at const.<br />
FX<br />
Total Group 236.6 +5.2 +2.9<br />
Tubular Glass 66.8 -5.8 -8.1<br />
Plastic Systems 72.1 +11.4 +8.8<br />
Moulded Glass 80.3 +10.9 +9.8<br />
Life Science Research 21.3 +4.3 -1.4<br />
22
Q1 2011: Adjusted EBITDA 1 and margin by division<br />
EUR m<br />
Q1 2011 Q1 2010<br />
Change<br />
in % Margin Margin<br />
Total Group 41.8 +9.0 17.7 17.0<br />
Tubular Glass 13.8 -16.8 20.6 23.4<br />
Plastic Systems 14.4 +7.3 20.0 20.7<br />
Moulded Glass 16.1 +36.6 20.1 16.3<br />
Life Science Research 2.2 +24.3 10.4 8.8<br />
1<br />
Earnings before financial result, income taxes, amortization of fair value adjustments, extraordinary depreciation, depreciation and<br />
amortization, restructuring expenses and one-off income and expenses<br />
23
Key financial figures<br />
February 28, 2011<br />
EUR m<br />
February 28, 2010<br />
EUR m<br />
Change<br />
in %<br />
Equity<br />
Equity ratio in %<br />
536.7<br />
40.2<br />
482.6<br />
35.9<br />
+11.2<br />
Net Working Capital 1<br />
in % of LTM revenues<br />
172.3<br />
16.6<br />
175.1<br />
17.7<br />
-1.6<br />
Net Financial Debt 2 318.2 402.6 -21.0<br />
Adjusted EBITDA leverage 1.5 2.2 -31.8<br />
Q1 2011<br />
EUR m<br />
Q1 2010<br />
EUR m<br />
Change<br />
in %<br />
Capital expenditure 9.7 15.9 -39.0<br />
Free cash flow -13.8 -13.2 -4.5<br />
1<br />
Inventories (incl. prepayments) and trade receivables less trade payables and payments received on account of orders<br />
2<br />
Total amount of debt less cash and cash equivalents<br />
24
Reconciliation from adjusted EBITDA to net income<br />
EUR m FY 2009 FY 2010<br />
Adjusted EBITDA 185.9 204.5<br />
Restructuring expenses 3.6 3.7<br />
One-off income/expense 2.0 0.0<br />
EBITDA 180.3 200.8<br />
Amortization of fair value adjustments 38.3 24.8<br />
Depreciation 76.2 81.0<br />
Book loss from disinvestment 5.3 0.0<br />
Result from operations 60.5 95.0<br />
Financial result -40.3 -34.3<br />
Income taxes -13.2 -14.0<br />
Net income 7.0 46.7<br />
Attributable to non-controlling interests 1.2 3.5<br />
Attributable to GX shareholders 5.8 43.2<br />
Adjusted net income 45.2 65.8<br />
25
Contact details: Investor & Creditor Relations<br />
• Phone +49 211 6181-257<br />
• Fax +49 211 6181-121<br />
• E-mail gerresheimer.ir@gerresheimer.com<br />
• IR website www.gerresheimer.com/ir<br />
26