Analysis of Flow and Baseflow Trends in the Usangu ... - GEUS
Analysis of Flow and Baseflow Trends in the Usangu ... - GEUS
Analysis of Flow and Baseflow Trends in the Usangu ... - GEUS

You also want an ePaper? Increase the reach of your titles
YUMPU automatically turns print PDFs into web optimized ePapers that Google loves.
Photo: David Brazier/IWMI<br />
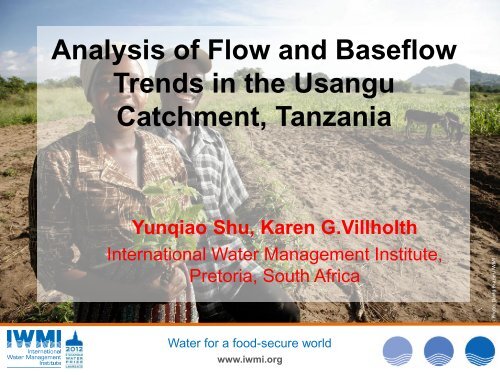
<strong>Analysis</strong> <strong>of</strong> <strong>Flow</strong> <strong>and</strong> <strong>Baseflow</strong><br />
<strong>Trends</strong> <strong>in</strong> <strong>the</strong> <strong>Usangu</strong><br />
Catchment, Tanzania<br />
Yunqiao Shu, Karen G.Villholth<br />
International Water Management Institute,<br />
Pretoria, South Africa<br />
Water for a food-secure world<br />
www.iwmi.org
Interaction between surface<br />
water/groundwater<br />
Stream flow = Storm flow + Base <strong>Flow</strong><br />
<strong>Baseflow</strong> trend variations not only reflect <strong>the</strong> surficial hydrological system regime<br />
change but also changes <strong>in</strong> groundwater storage <strong>and</strong> discharge with<strong>in</strong> <strong>the</strong> bas<strong>in</strong>.<br />
Water for a food-secure world<br />
www.iwmi.org
The objectives<br />
• (1) Quantify <strong>and</strong> analyse bas<strong>in</strong>-scale temporal <strong>and</strong><br />
spatial trends <strong>in</strong> total stream flow <strong>and</strong> baseflow <strong>in</strong> <strong>the</strong><br />
<strong>Usangu</strong> catchment;<br />
• (2) Contribute to underst<strong>and</strong><strong>in</strong>g <strong>the</strong> hydrological system,<br />
<strong>and</strong> recent observed changes, particularly related to dry<br />
season impacts <strong>and</strong> groundwater.<br />
Water for a food-secure world<br />
www.iwmi.org
Study area <strong>and</strong> stream stations<br />
Downstream:1KA59<br />
Eastern<br />
highl<strong>and</strong>s:<br />
1KA15<br />
Western<br />
highl<strong>and</strong>s:<br />
1KA8A<br />
1KA11<br />
Water for a food-secure world<br />
www.iwmi.org
Methodology<br />
• <strong>Baseflow</strong> separation method<br />
q<br />
Q<br />
m<br />
b<br />
<br />
Q<br />
q<br />
m<br />
m1<br />
q<br />
0.5(1<br />
)(<br />
Qm<br />
Qm<br />
1)<br />
• <strong>Baseflow</strong> Index (BFI)<br />
m<br />
BFI Q b<br />
Q m<br />
• Time series trend analysis<br />
– 1960-2009<br />
– Mann-Kendall test<br />
Water for a food-secure world<br />
www.iwmi.org
Data on <strong>the</strong> stream flow stations <strong>and</strong> sub-catchments<br />
Station<br />
Altitude<br />
(masl)<br />
1KA8A 1145<br />
Length from<br />
headwater to<br />
station (km)<br />
41<br />
Subcatchment<br />
size<br />
(km 2 )<br />
Mean annual<br />
total flow<br />
(Std.dev.)<br />
(10 6 m 3 /yr)<br />
Mean annual<br />
BFI (Std.dev.)<br />
785 488.9 (200.0) 0.34(0.07) 21.0<br />
Contribution to<br />
downstream flow<br />
(%)<br />
1KA11 1115 68 1542 452.4 (127.5) 0.44(0.07) 19.4<br />
1KA15 1665 76 1107 190.7 (99.6) 0.28(0.06) 8.2<br />
1KA59 815<br />
243<br />
23520 2327.5 (2508.0) 0.24(0.05) -<br />
Water for a food-secure world<br />
www.iwmi.org
Total stream flow (m 3 /year)<br />
Total stream flow (m 3 /year)<br />
Millions<br />
Millions<br />
Total stream flow (m 3 /year)<br />
Total stream flow (m 3 /year)<br />
Millions<br />
Millions<br />
Stream flow trend<br />
1500<br />
1000<br />
1000<br />
1KA8A<br />
Stream flow<br />
L<strong>in</strong>ear (Stream<br />
flow)<br />
800<br />
600<br />
1KA11<br />
400<br />
500<br />
Stream flow<br />
200<br />
L<strong>in</strong>ear (Stream<br />
flow)<br />
0<br />
1960 1964 1968 1972 1976 1980 1984 1988 1992 1996 2000 2004 2008<br />
0<br />
1960 1964 1968 1972 1976 1980 1984 1988 1992 1996 2000 2004 2008<br />
600<br />
13500<br />
12000<br />
10500<br />
1KA59<br />
400<br />
1KA15<br />
Stream flow<br />
9000<br />
Stream flow<br />
L<strong>in</strong>ear (Stream flow)<br />
L<strong>in</strong>ear (Stream<br />
flow)<br />
7500<br />
6000<br />
200<br />
4500<br />
0<br />
1960 1964 1968 1972 1976 1980 1984 1988 1992 1996 2000 2004 2008<br />
Water for a food-secure 1500 world<br />
www.iwmi.org<br />
3000<br />
0<br />
1960 1964 1968 1972 1976 1980 1984 1988 1992 1996 2000 2004 2008
<strong>Baseflow</strong> (m 3 /yr)<br />
<strong>Baseflow</strong> (m 3 /yr)<br />
Millions<br />
Millions<br />
<strong>Baseflow</strong> (m 3 /yr)<br />
<strong>Baseflow</strong> (m 3 /yr)<br />
Millions<br />
Millions<br />
<strong>Baseflow</strong><br />
350<br />
400<br />
300<br />
250<br />
1KA8A<br />
350<br />
300<br />
1KA11<br />
250<br />
200<br />
200<br />
150<br />
150<br />
100<br />
100<br />
50<br />
50<br />
0<br />
1960 1964 1968 1972 1976 1980 1984 1988 1992 1996 2000 2004 2008<br />
0<br />
1960 1964 1968 1972 1976 1980 1984 1988 1992 1996 2000 2004 2008<br />
160<br />
3000<br />
140<br />
120<br />
1KA15<br />
2500<br />
1KA59<br />
100<br />
2000<br />
80<br />
1500<br />
60<br />
1000<br />
40<br />
20<br />
500<br />
0<br />
1960 1964 1968 1972 1976 1980 1984 1988 1992 1996 2000 2004 2008<br />
0<br />
Water for a food-secure world<br />
www.iwmi.org<br />
1960 1964 1968 1972 1976 1980 1984 1988 1992 1996 2000 2004 2008
Mann-Kendall test results for annual total stream flow<br />
(TF) <strong>and</strong> baseflow (BF) from 1960 to 2009<br />
Station<br />
1KA8A<br />
Annual TF Annual BF Wet season BF Dry season BF<br />
T-statistics / Sign.<br />
level<br />
-2.18 (0.05)<br />
T-statistics / Sign.<br />
level<br />
T-statistics / Sign.<br />
level<br />
T-statistics / Sign.<br />
level<br />
-2.37 (0.05) -2.22 (0.05) -2.46 (0.05)<br />
1KA11<br />
1KA15<br />
1KA59<br />
-2.41 (0.05)<br />
-1.79 (0.1)<br />
-1.79 (0.1)<br />
-3.3 (0.01) -3.16 (0.01) -2.54 (0.05)<br />
-2.31 (0.05) -1.67 (0.1) -3.11 (0.01)<br />
-2.83 (0.01) -2.34(0.05) -3.70 (0.01)<br />
Water for a food-secure world<br />
www.iwmi.org
Annual bseflow m 3 /yr<br />
Annual bseflow m 3 /yr<br />
3.00E+09<br />
2.50E+09<br />
2.00E+09<br />
1KA59:1960-1989<br />
1KA59:1990-2009<br />
1.50E+09<br />
1.00E+09<br />
5.00E+08<br />
0.00E+00<br />
0 10 20 30 40 50 60 70 80 90 100<br />
Probablity <strong>of</strong> exceedance (%)<br />
4.00E+08<br />
3.50E+08<br />
3.00E+08<br />
1KA8:1960-1989<br />
1KA8:1990-2009<br />
1KA11:1960-1989<br />
1KA11:1990-2009<br />
2.50E+08<br />
1KA15:1960-1989<br />
1KA15:1990-2009<br />
<strong>Flow</strong> duration curves <strong>of</strong> annual<br />
baseflow curves for 1960-1989 <strong>and</strong><br />
1990-2009<br />
2.00E+08<br />
1.50E+08<br />
1.00E+08<br />
5.00E+07<br />
0.00E+00<br />
0 10 20 30 40 50 60 70 80 90 100<br />
Probablity <strong>of</strong> exceedance (%)<br />
Water for a food-secure world<br />
www.iwmi.org
Annual Ra<strong>in</strong>fall (mm)<br />
Annual ra<strong>in</strong>fall over <strong>Usangu</strong> catchment<br />
1600<br />
1400<br />
P > 0.1<br />
1200<br />
1000<br />
800<br />
600<br />
400<br />
200<br />
0<br />
1960 1964 1968 1972 1976 1980 1984 1988 1992 1996 2000 2004 2008<br />
Water for a food-secure world<br />
www.iwmi.org
Annual potential evapotranspirtion (mm)<br />
Annual potential evapotranspiration<br />
3000<br />
2500<br />
Change Po<strong>in</strong>t: Year 1990<br />
(p
Annual baseflow (m3)<br />
3E+09<br />
2.5E+09<br />
2E+09<br />
p=0.005<br />
R² = 0.151<br />
1.5E+09<br />
n=50<br />
1E+09<br />
500000000<br />
0<br />
600 800 1000 1200 1400<br />
Annual ra<strong>in</strong>fall (mm)<br />
Water for a food-secure world<br />
www.iwmi.org
Annual <strong>Baseflow</strong> (m3)<br />
3E+09<br />
2.5E+09<br />
2E+09<br />
1.5E+09<br />
p=0.175<br />
R² = 0.038<br />
n=50<br />
1E+09<br />
500000000<br />
0<br />
1900 2000 2100 2200 2300<br />
Annual potential evapotranspiration (mm)<br />
Water for a food-secure world<br />
www.iwmi.org
Irrigation<br />
area<br />
Water for a food-secure world<br />
www.iwmi.org
Grow<strong>in</strong>g irrigation area <strong>in</strong> <strong>Usangu</strong> (SMUWC,2001)<br />
Water for a food-secure world<br />
www.iwmi.org
Annual baseflow (m 3 )<br />
3E+09<br />
2.5E+09<br />
2E+09<br />
p=0.002<br />
R² = 0.299<br />
1.5E+09<br />
n=10<br />
1E+09<br />
500000000<br />
0<br />
0 5000 10000 15000 20000 25000 30000 35000 40000 45000<br />
Irrigated rice area (ha)<br />
Water for a food-secure world<br />
www.iwmi.org
Water for a food-secure world<br />
www.iwmi.org
Deforestation<br />
• Deforestation <strong>in</strong> <strong>the</strong> highl<strong>and</strong>s may <strong>in</strong>creased<br />
evapotranspiration, could decrease <strong>the</strong> groundwater<br />
recharge <strong>the</strong>n baseflow. However, do detail data <strong>and</strong><br />
experiment <strong>in</strong> h<strong>and</strong> can support this explanation.<br />
Water for a food-secure world<br />
www.iwmi.org
Pump<strong>in</strong>g<br />
Wells<br />
Increased use<br />
<strong>of</strong> groundwater<br />
due to<br />
population<br />
<strong>in</strong>creases <strong>and</strong><br />
proliferation <strong>of</strong><br />
wells primarily<br />
for domestic<br />
uses has been<br />
observed <strong>in</strong><br />
<strong>the</strong>se areas<br />
Water for a food-secure world<br />
www.iwmi.org
Conclusions <strong>of</strong> factors on hydrological<br />
change<br />
• Climatic factors may expla<strong>in</strong> part, but not all <strong>of</strong> <strong>the</strong><br />
change <strong>in</strong> hydrological <strong>and</strong> baseflow observed.<br />
• Human activities<br />
– Irrigation from river ---downstream<br />
– Deforestation, groundwater abstraction--upstream<br />
• Fur<strong>the</strong>r analysis <strong>and</strong> data related to <strong>the</strong> l<strong>and</strong>use <strong>and</strong><br />
water use changes (groundwater abstraction) <strong>in</strong> <strong>the</strong><br />
upper catchments are needed.<br />
Water for a food-secure world<br />
www.iwmi.org
Thank you for your attention!<br />
Water for a food-secure world<br />
www.iwmi.org