weekly release - New York Giants
weekly release - New York Giants
weekly release - New York Giants

Create successful ePaper yourself
Turn your PDF publications into a flip-book with our unique Google optimized e-Paper software.
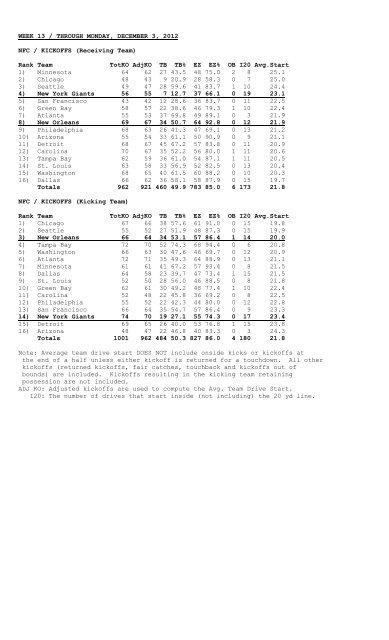
WEEK 13 / THROUGH MONDAY, DECEMBER 3, 2012<br />
NFC / KICKOFFS (Receiving Team)<br />
Rank Team<br />
TotKO AdjKO TB TB% EZ EZ% OB I20 Avg.Start<br />
1) Minnesota 64 62 27 43.5 48 75.0 2 8 25.1<br />
2) Chicago 48 43 9 20.9 28 58.3 0 7 25.0<br />
3) Seattle 49 47 28 59.6 41 83.7 1 10 24.4<br />
4) <strong>New</strong> <strong>York</strong> <strong>Giants</strong> 56 55 7 12.7 37 66.1 0 19 23.1<br />
5) San Francisco 43 42 12 28.6 36 83.7 0 11 22.5<br />
6) Green Bay 58 57 22 38.6 46 79.3 1 10 22.4<br />
7) Atlanta 55 53 37 69.8 49 89.1 0 3 21.9<br />
8) <strong>New</strong> Orleans 69 67 34 50.7 64 92.8 0 12 21.9<br />
9) Philadelphia 68 63 26 41.3 47 69.1 0 13 21.2<br />
10) Arizona 55 54 33 61.1 50 90.9 0 9 21.1<br />
11) Detroit 68 67 45 67.2 57 83.8 0 11 20.9<br />
12) Carolina 70 67 35 52.2 56 80.0 1 11 20.6<br />
13) Tampa Bay 62 59 36 61.0 54 87.1 1 11 20.5<br />
14) St. Louis 63 58 33 56.9 52 82.5 0 13 20.4<br />
15) Washington 68 65 40 61.5 60 88.2 0 10 20.3<br />
16) Dallas 66 62 36 58.1 58 87.9 0 15 19.7<br />
Totals 962 921 460 49.9 783 85.0 6 173 21.8<br />
NFC / KICKOFFS (Kicking Team)<br />
Rank Team<br />
TotKO AdjKO TB TB% EZ EZ% OB I20 Avg.Start<br />
1) Chicago 67 66 38 57.6 61 91.0 0 15 19.8<br />
2) Seattle 55 52 27 51.9 48 87.3 0 15 19.9<br />
3) <strong>New</strong> Orleans 66 64 34 53.1 57 86.4 1 14 20.0<br />
4) Tampa Bay 72 70 52 74.3 68 94.4 0 6 20.8<br />
5) Washington 66 63 30 47.6 46 69.7 0 12 20.9<br />
6) Atlanta 72 71 35 49.3 64 88.9 0 13 21.1<br />
7) Minnesota 61 61 41 67.2 57 93.4 0 8 21.5<br />
8) Dallas 64 58 23 39.7 47 73.4 1 15 21.5<br />
9) St. Louis 52 50 28 56.0 46 88.5 0 8 21.8<br />
10) Green Bay 62 61 30 49.2 48 77.4 1 10 22.4<br />
11) Carolina 52 48 22 45.8 36 69.2 0 8 22.5<br />
12) Philadelphia 55 52 22 42.3 44 80.0 0 12 22.8<br />
13) San Francisco 66 64 35 54.7 57 86.4 0 9 23.3<br />
14) <strong>New</strong> <strong>York</strong> <strong>Giants</strong> 74 70 19 27.1 55 74.3 0 17 23.4<br />
15) Detroit 69 65 26 40.0 53 76.8 1 15 23.8<br />
16) Arizona 48 47 22 46.8 40 83.3 0 3 24.3<br />
Totals 1001 962 484 50.3 827 86.0 4 180 21.8<br />
Note: Average team drive start DOES NOT include onside kicks or kickoffs at<br />
the end of a half unless either kickoff is returned for a touchdown. All other<br />
kickoffs (returned kickoffs, fair catches, touchback and kickoffs out of<br />
bounds) are included. Kickoffs resulting in the kicking team retaining<br />
possession are not included.<br />
ADJ KO: Adjusted kickoffs are used to compute the Avg. Team Drive Start.<br />
I20: The number of drives that start inside (not including) the 20 yd line.