south florida commercial real estate review - Broward Alliance
south florida commercial real estate review - Broward Alliance
south florida commercial real estate review - Broward Alliance

You also want an ePaper? Increase the reach of your titles
YUMPU automatically turns print PDFs into web optimized ePapers that Google loves.
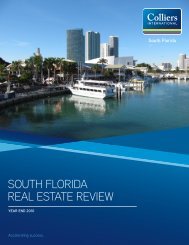
SOUTH FLORIDA COMMERCIAL<br />
REAL ESTATE REVIEW<br />
Q4 2012<br />
Accelerating success.
TABLE OF CONTENTS<br />
SOUTH FLORIDA COMMERCIAL REAL ESTATE REVIEW | Q4 2012<br />
SOUTH FLORIDA REAL ESTATE REVIEW<br />
Letter from Leadership 3<br />
Executive Summary 4<br />
MIAMI-DADE COUNTY<br />
Office Market 5<br />
Industrial Market 8<br />
Retail Market 10<br />
BROWARD COUNTY<br />
Office Market 12<br />
Industrial Market 15<br />
Retail Market 17<br />
PALM BEACH COUNTY<br />
Office Market 19<br />
Industrial Market 21<br />
Retail Market 23<br />
COMPANY INFORMATION<br />
Colliers International South Florida Team 25<br />
Market Report Criteria<br />
Office: Properties classified class A, B, and C that are both existing and under construction measuring greater than 10,000 square feet of rentable area for single and<br />
multi-tenant, non-government and non-medical tenant users. Criteria is also pulled for properties classified class A, B, and C that are both existing and under construction<br />
measuring greater than 25,000 square feet of rentable area for single and multi-tenant, non-government, non-medical tenant and non-owner occupied users.<br />
Industrial: Properties that are both existing and under construction measuring greater than 20,000 square feet of rentable area for single and multi-tenant users.<br />
Retail: Properties measuring greater than 10,000 square feet of rentable area located in a shopping center.<br />
Cover photo courtesy of the Greater Miami Convention & Visitors Bureau<br />
Contact: Crystal Proenza—crystal.proenza@colliers.com | Research: Alex Morcate—alex.morcate@colliers.com
SOUTH FLORIDA COMMERCIAL REAL ESTATE REVIEW | Q4 2012<br />
Dear Valued Client,<br />
The Colliers International<br />
South Florida<br />
Commercial Real<br />
Estate Review provides<br />
market data<br />
for the Tri-County<br />
area, highlighting the<br />
office, industrial and<br />
retail markets.<br />
Throughout 2012 we looked ahead with caution, understanding that the market was changing and<br />
direction was positive but uncertain. Looking back at 2012 we see that we’ve come a long way from<br />
this time last year. Transaction activity is up. Interest and inquiries are up. Confidence and outlook are<br />
up too. Overall, the South Florida market made improvements virtually across the board, both at the<br />
macro and micro level.<br />
This consistent increase in activity is fueled by several factors, many of which we expect to see<br />
continue into the first half of 2013. CMBS is coming back into the picture which will provide a solid<br />
foundation of growth from which to springboard. Each of our primary lines of business benefits from<br />
the resolution of distress across the local and national market. While the market is improving, we<br />
estimate that roughly one third of the market is still distressed. We are also seeing a pick up in the<br />
private sector with 1031 exchanges getting active.<br />
Net absorption has been positive across almost every major property type in every major market, an<br />
obvious indication of leasing strength and a narrower gap between bid and ask for <strong>commercial</strong> space.<br />
Some of this has to do with negligible construction activity, at least when compared to the first part<br />
of the 2000’s.<br />
These observations are more than just commentary though. We’ve seen a continued evolution in our<br />
book of business to include a greater proportion of institutional and headline-worthy deals. We closed<br />
nearly $400 million in investment sales transaction value and leased approximately 1.5 million square<br />
feet of space across South Florida in 2012.<br />
As we mark an end to the year we acknowledge that the recovery is still well under way. This means<br />
the local market will still be subject to short-term volatility as talk about the fiscal cliff and national<br />
level budget concerns pump the brakes on what looks like a smoother road through 2013. The<br />
residential market is still roaring back fueled by foreign demand and we expect this demand will begin<br />
to taper off gradually.<br />
In short, the local market saw widespread improvement when compared to 2011 and we expect to see<br />
more of the same during 2013. However, we remain cautiously optimistic.<br />
Sincerely,<br />
DONNA ABOOD MICHAEL T. FAY STEPHEN NOSTRAND<br />
Chairman - Founding Partner Chairman - Founding Partner Chief Executive Officer<br />
donna.abood@colliers.com michael.fay@colliers.com stephen.nostrand@colliers.com<br />
Contact: Crystal Proenza—crystal.proenza@colliers.com | Research: Alex Morcate—alex.morcate@colliers.com<br />
COLLIERS INTERNATIONAL | P. 3
SOUTH FLORIDA COMMERCIAL REAL ESTATE REVIEW | Q4 2012<br />
South Florida Market Overall<br />
Executive Summary<br />
Last quarter we brought up the issue of confidence and how hesitation was<br />
leading to mixed results across the local market. Several months later<br />
moderate confidence has given way to positive momentum. As we closed<br />
the books on 2012 we made history on a number of different fronts.<br />
MARKET INDICATORS<br />
Rent Vacancy<br />
MIAMI-DADE OFFICE —<br />
BROWARD OFFICE — —<br />
PALM BEACH OFFICE<br />
MIAMI-DADE INDUSTRIAL<br />
BROWARD INDUSTRIAL —<br />
PALM BEACH INDUSTRIAL<br />
MIAMI-DADE RETAIL<br />
BROWARD RETAIL<br />
PALM BEACH RETAIL<br />
While Q3 saw sluggish transaction activity, Q4 recorded a 200% increase<br />
over three months and a 15% increase year-over-year across all property<br />
types. Here’s the <strong>real</strong>ly interesting part: annual transaction volume hasn’t<br />
been this high since the go-go days of 2007. Average deal-level cap rates<br />
have fallen to a multi-year low near 7.00% and for the first half of 2013 this<br />
trend is expected to continue.<br />
One of the most obvious examples of this momentum are the numerous<br />
large sales and leases closed throughout the year. Deals like Miami Center<br />
($260M – class A office), 10201 Collins Avenue ($220M – oceanfront<br />
development site) and Lincoln Center ($139M – Lincoln Road retail) continued<br />
to up the ante on investment deals of the year.<br />
As you’d expect, industrial deals took the top spot in terms of largest deal by<br />
total square footage with the likes of Schenker (150,000 SF – Miami Airport)<br />
and Perez Trading (140,000 SF – Hialeah). But retail and office leases aren’t<br />
to be outdone in terms of overall value with leases like Lord and Taylor<br />
(80,000 SF - Mizner Park) or Sapient (42,000 SF – Coconut Grove).<br />
Even though 2012 holiday sales didn’t deliver (sorry Santa, no pun intended)<br />
and unemployment figures for the Tri-County area rose higher than expected<br />
to 8.1% after six months of gradual declines, the market appears to have<br />
more confidence and positive momentum than it did this time last year.<br />
Looking ahead, we expect to see this trend continue through the first half of<br />
2013 as CMBS continues to play a larger role in the market, institutional<br />
investors continue to leverage cheap capital, landlords and tenants become<br />
more open minded and foreign buyers continue to do what they do best in<br />
Miami – buy.<br />
P. 4 | COLLIERS INTERNATIONAL<br />
Contact: Crystal Proenza—crystal.proenza@colliers.com | Research: Alex Morcate—alex.morcate@colliers.com
SOUTH FLORIDA COMMERCIAL REAL ESTATE REVIEW | Q4 2012<br />
$32.00/fs<br />
RENTAL RATE VS. VACANCY RATE<br />
17.0%<br />
Miami-Dade County Office<br />
$30.00/fs<br />
$28.00/fs<br />
$26.00/fs<br />
$24.00/fs<br />
16.5%<br />
16.0%<br />
15.5%<br />
15.0%<br />
14.5%<br />
• The largest office sale of the quarter was closed by NGF<br />
Properties, LLC, which purchased the US Century Bank<br />
headquarters in Doral. They paid $16M for the 75,000 SF,<br />
class A building from the bank just after US Century<br />
announced their merger.<br />
$22.00/fs<br />
$20.00/fs<br />
2010 3Q 2010 4Q 2011 1Q 2011 2Q 2011 3Q 2011 4Q 2012 1Q 2012 2Q 2012 3Q 2012 4Q<br />
14.0%<br />
13.5%<br />
• The largest lease of the quarter was signed by the Ferraro<br />
Law Firm at Brickell World Plaza. They signed 21,400 SF<br />
at roughly $47 PSF, full service.<br />
700,000<br />
600,000<br />
500,000<br />
400,000<br />
300,000<br />
200,000<br />
100,000<br />
(100,000)<br />
(200,000)<br />
$40.00/fs<br />
$35.00/fs<br />
$30.00/fs<br />
$25.00/fs<br />
$20.00/fs<br />
$15.00/fs<br />
0<br />
2010<br />
3Q<br />
2010<br />
4Q<br />
RENTAL RATE<br />
VACANCY RATE<br />
ABSORPTION / DELIVERIES / VACANCY RATE<br />
2011<br />
1Q<br />
2011<br />
2Q<br />
2011<br />
3Q<br />
2011<br />
4Q<br />
2012<br />
1Q<br />
2012<br />
2Q<br />
2012<br />
3Q<br />
DELIVERIES ABSORPTION VACANCY RATE<br />
AVERAGE RENTAL RATES, $ / SF FULL SERVICE<br />
2012<br />
4Q<br />
17.0%<br />
16.5%<br />
16.0%<br />
15.5%<br />
15.0%<br />
14.5%<br />
14.0%<br />
13.5%<br />
2010 3Q 2010 4Q 2011 1Q 2011 2Q 2011 3Q 2011 4Q 2012 1Q 2012 2Q 2012 3Q 2012 4Q<br />
CLASS A CLASS B CLASS C<br />
• Average asking rent rates are still fluctuating near $28.50<br />
PSF and have trended within a $0.50 PSF range since<br />
the summer of 2011. This trend points to a broader signal<br />
that the market is still recovering, although already well<br />
on its way.<br />
• Miami Dade County has recorded 12 consecutive months<br />
of strong positive net absorption, closing out 2012 with<br />
nearly 270,000 SF of net space signed. For the year, this<br />
brings the total positive net to just over 1.2M SF, a sign of<br />
the continuing improvement of office activity in the<br />
market.<br />
• This strong absorption has had an obvious impact on<br />
vacancy rates which have fallen across every class of<br />
space to an average just below 15.0% through the end of<br />
the year. Year-to-date this is down noticeably from the<br />
16.0% of Q4 2011.<br />
Colliers Broker Quick Commentary: We’ve seen a<br />
significant uptick since Q3 2012. We believe much of this<br />
is due to pent up tenant demand, and we expect momentum<br />
to continue through the middle of 2013, after which<br />
activity will stabilize. Transaction volume will keep pace<br />
as we approach 2014, marking similar year-over-year<br />
growth across all property types. We expect owners will<br />
start to tighten up the amount of concessions offered to<br />
tenants and that they’ll continue to push rent rates more<br />
aggressively.<br />
-Donna Abood<br />
Chairman - Founding Partner<br />
Office 25,000 Square Feet + : Institutional office product continued to slowly improve through the end of the 2012.<br />
Vacancy rates trended lower, slightly below 22% and off the highs of over 23% seen during 2011. This trend is due to a<br />
general lack of construction activity. There is always inventory under construction, however construction activity remains<br />
at an all-time low, helping the market recover without the fear of new supply. The average quarterly volume of product<br />
under construction between 2005 and 2010 was 2.6M SF. The 2012 average was 260,000 SF. Also affecting the change<br />
in vacancy is overall leasing activity which saw roughly 250,000 SF of net positive absorption for the year. While average<br />
asking rent rates saw a decline to $29.25 PSF gross, the rate of decline has slowed.<br />
Contact: Crystal Proenza—crystal.proenza@colliers.com | Research: Alex Morcate—alex.morcate@colliers.com<br />
COLLIERS INTERNATIONAL | P. 5
SOUTH FLORIDA COMMERCIAL REAL ESTATE REVIEW | Q4 2012<br />
Miami-Dade County Office Submarket Statistics<br />
CLASS<br />
TOTAL<br />
INVENTORY<br />
(SF)<br />
% OF<br />
SUBMARKET<br />
RBA<br />
TOTAL<br />
VACANCY<br />
(SF)<br />
TOTAL<br />
VACANCY<br />
RATE<br />
TOTAL NET<br />
ABSORPTION<br />
TOTAL RBA<br />
DELIVERED<br />
TOTAL RBA<br />
UNDER<br />
CONSTRUCTION<br />
WEIGHTED AVERAGE<br />
RENTAL RATE (FULL<br />
SERVICE)<br />
AVENTURA<br />
CLASS A 706,881 59.1% 72,354 10.2% 7,234 0 84,990 $37.67<br />
CLASS B 420,292 35.2% 26,079 6.2% 3,378 0 0 $34.10<br />
CLASS C 68,303 5.7% 4,108 6.0% 894 0 0 $0.00<br />
SUBTOTAL 1,195,476 100.0% 102,541 8.6% 11,506 0 84,990 $34.26<br />
BISCAYNE CORRIDOR<br />
CLASS A 699,000 12.9% 246,925 35.3% 0 0 0 $30.19<br />
CLASS B 2,777,626 51.4% 480,907 17.3% -14,043 0 0 $26.84<br />
CLASS C 1,926,083 35.7% 205,036 10.6% 44,368 0 0 $20.92<br />
SUBTOTAL 5,402,709 100.0% 932,868 17.3% 30,325 0 0 $25.16<br />
CBD / BRICKELL<br />
CLASS A 4,590,806 59.7% 1,056,257 23.0% 50,069 0 0 $42.11<br />
CLASS B 2,807,714 36.5% 346,859 12.4% 27,158 0 0 $29.67<br />
CLASS C 295,274 3.8% 8,400 2.8% 13,800 0 0 $23.51<br />
SUBTOTAL 7,693,794 100.0% 1,411,516 18.3% 91,027 0 0 $36.86<br />
CENTRAL MIAMI<br />
CLASS A 588,343 20.1% 72,122 12.3% 24,575 0 0 $0.00<br />
CLASS B 999,329 34.1% 93,766 9.4% -600 0 0 $16.54<br />
CLASS C 1,340,353 45.8% 50,818 3.8% -600 0 0 $18.75<br />
SUBTOTAL 2,928,025 100.0% 216,706 7.4% 23,375 0 0 $14.23<br />
COCONUT GROVE<br />
CLASS A 515,216 37.1% 58,386 11.3% 3,415 0 0 $32.30<br />
CLASS B 630,431 45.3% 34,393 5.5% 15,015 0 0 $27.97<br />
CLASS C 244,881 17.6% 57,062 23.3% 0 0 0 $26.61<br />
SUBTOTAL 1,390,528 100.0% 149,841 10.8% 18,430 0 0 $29.33<br />
CORAL GABLES<br />
CLASS A 4,461,079 47.7% 1,037,866 23.3% 54,035 0 0 $35.18<br />
CLASS B 3,510,270 37.6% 344,767 9.8% 14,480 0 0 $28.18<br />
CLASS C 1,372,106 14.7% 60,741 4.4% 2,254 0 0 $25.54<br />
SUBTOTAL 9,343,455 100.0% 1,443,374 15.4% 70,769 0 0 $31.13<br />
CORAL WAY<br />
CLASS A 24,000 1.7% 0 0.0% 0 0 0 $0.00<br />
CLASS B 826,547 59.4% 56,855 6.9% -9,523 0 0 $22.65<br />
CLASS C 541,202 38.9% 33,146 6.1% 1,540 0 0 $24.35<br />
SUBTOTAL 1,391,749 100.0% 90,001 6.5% -7,983 0 0 $22.92<br />
DORAL / AIRPORT WEST<br />
CLASS A 6,575,972 41.8% 1,010,777 15.4% 77,173 0 0 $26.13<br />
CLASS B 6,813,900 43.3% 1,537,498 22.6% -32,628 0 80,000 $22.50<br />
CLASS C 2,332,135 14.8% 84,074 3.6% 7,761 0 0 $18.79<br />
SUBTOTAL 15,722,007 100.0% 2,632,349 16.7% 52,306 0 80,000 $23.47<br />
continued on the next page...<br />
P. 6 | COLLIERS INTERNATIONAL<br />
Contact: Crystal Proenza—crystal.proenza@colliers.com | Research: Alex Morcate—alex.morcate@colliers.com
Miami-Dade County Office Submarket Statistics continued...<br />
CLASS<br />
CBD / DOWNTOWN<br />
TOTAL<br />
INVENTORY<br />
(SF)<br />
% OF<br />
SUBMARKET<br />
RBA<br />
TOTAL<br />
VACANCY<br />
(SF)<br />
TOTAL<br />
VACANCY<br />
RATE<br />
TOTAL NET<br />
ABSORPTION<br />
TOTAL RBA<br />
DELIVERED<br />
TOTAL RBA<br />
UNDER<br />
CONSTRUCTION<br />
WEIGHTED AVERAGE<br />
RENTAL RATE (FULL<br />
SERVICE)<br />
CLASS A 5,167,642 47.9% 1,023,407 19.8% -31,248 0 0 $39.31<br />
CLASS B 4,482,170 41.5% 920,844 20.5% -75,551 0 0 $26.42<br />
CLASS C 1,148,008 10.6% 38,493 3.4% 2,869 0 0 $15.91<br />
SUBTOTAL 10,797,820 100.0% 1,982,744 18.4% -103,930 0 0 $31.47<br />
HIALEAH / MIAMI GARDENS<br />
CLASS A 0 0.0% 0 0.0% 0 0 0 $0.00<br />
CLASS B 586,947 47.3% 145,684 24.8% 11,890 10,078 0 $20.40<br />
CLASS C 652,915 52.7% 68,048 10.4% 4,502 0 0 $18.65<br />
SUBTOTAL 1,239,862 100.0% 213,732 17.2% 16,392 10,078 0 $19.48<br />
KENDALL<br />
CLASS A 1,290,267 12.4% 240,835 18.7% -14,653 0 51,000 $33.97<br />
CLASS B 5,921,069 56.8% 590,852 10.0% 15,201 0 31,063 $22.72<br />
CLASS C 3,204,145 30.8% 102,368 3.2% 2,737 0 0 $20.59<br />
SUBTOTAL 10,415,481 100.0% 934,055 9.0% 3,285 0 82,063 $23.46<br />
MIAMI BEACH<br />
CLASS A 636,411 16.7% 61,278 9.6% 1,715 0 0 $33.22<br />
CLASS B 2,250,506 58.9% 256,695 11.4% -16,744 0 0 $34.63<br />
CLASS C 934,149 24.4% 22,051 2.4% 20,585 0 0 $24.66<br />
SUBTOTAL 3,821,066 100.0% 340,024 8.9% 5,556 0 0 $31.96<br />
MIAMI LAKES<br />
CLASS A 416,748 13.8% 120,811 29.0% 13,641 0 0 $25.09<br />
CLASS B 2,367,456 78.3% 550,015 23.2% -9,783 0 0 $21.50<br />
CLASS C 240,001 7.9% 25,140 10.5% 6,750 0 0 $17.57<br />
SUBTOTAL 3,024,205 100.0% 695,966 23.0% 10,608 0 0 $21.68<br />
NE DADE<br />
CLASS A 160,000 4.1% 96,197 60.1% 0 0 0 $35.07<br />
CLASS B 1,523,362 39.4% 195,832 12.9% 13,862 23,852 0 $20.78<br />
CLASS C 2,183,196 56.5% 264,266 12.1% -22,348 0 0 $17.40<br />
SUBTOTAL 3,866,558 100.0% 556,295 14.4% -8,486 23,852 0 $19.46<br />
SOUTH DADE / HOMESTEAD<br />
SOUTH FLORIDA COMMERCIAL REAL ESTATE REVIEW | Q4 2012<br />
CLASS A 190,719 10.6% 30,497 16.0% 13,621 0 0 $29.06<br />
CLASS B 1,209,703 67.4% 105,492 8.7% -1,136 0 0 $21.02<br />
CLASS C 395,124 22.0% 88,697 22.4% -6,420 0 0 $24.88<br />
SUBTOTAL 1,795,546 100.0% 224,686 12.5% 6,065 0 0 $22.72<br />
CLASS A TOTAL 26,023,084 NA 5,127,712 19.7% 199,577 0 135,990 $33.67<br />
CLASS B TOTAL 37,127,322 NA 5,686,538 15.3% -59,024 33,930 111,063 $25.00<br />
CLASS C TOTAL 16,877,875 NA 1,112,448 6.6% 78,692 0 0 $20.29<br />
MIAMI DADE<br />
OFFICE TOTAL<br />
80,028,281 NA 11,926,698 14.9% 219,245 33,930 247,053 $26.82<br />
Contact: Crystal Proenza—crystal.proenza@colliers.com | Research: Alex Morcate—alex.morcate@colliers.com<br />
COLLIERS INTERNATIONAL | P. 7
SOUTH FLORIDA COMMERCIAL REAL ESTATE REVIEW | Q4 2012<br />
Miami-Dade County Industrial<br />
$9.00/nnn<br />
$8.00/nnn<br />
$7.00/nnn<br />
RENTAL RATE VS. VACANCY RATE<br />
10.0%<br />
9.0%<br />
8.0%<br />
7.0%<br />
6.0%<br />
• Vacancy rates have resumed their decline on strong<br />
leasing activity through the end of the year. Rates are<br />
now closer to 6.5% and are down almost 1.0% from this<br />
time last year. Warehouse product has seen an uptick in<br />
demand through the end of the year after a slower than<br />
usual third quarter.<br />
$6.00/nnn<br />
$5.00/nnn<br />
$4.00/nnn<br />
2010 3Q 2010 4Q 2011 1Q 2011 2Q 2011 3Q 2011 4Q 2012 1Q 2012 2Q 2012 3Q 2012 4Q<br />
5.0%<br />
4.0%<br />
3.0%<br />
2.0%<br />
1.0%<br />
0.0%<br />
• After recording a surprising negative absorption in Q3,<br />
the county bounced back racking up over 1.2M square<br />
feet of positive net absorption in Q4. This marks one of<br />
the best performing quarters in several years and brings<br />
the year-to-date total for 2012 to almost 2.3M SF of<br />
space absorbed.<br />
1,600,000<br />
1,400,000<br />
1,200,000<br />
1,000,000<br />
800,000<br />
600,000<br />
400,000<br />
200,000<br />
0<br />
(200,000)<br />
(400,000)<br />
(600,000)<br />
2010<br />
3Q<br />
2010<br />
4Q<br />
RENTAL RATE<br />
2011<br />
1Q<br />
2011<br />
2Q<br />
2011<br />
3Q<br />
VACANCY RATE<br />
ABSORPTION / DELIVERIES / VACANCY RATE<br />
2011<br />
4Q<br />
2012<br />
1Q<br />
2012<br />
2Q<br />
2012<br />
3Q<br />
DELIVERIES ABSORPTION VACANCY RATE<br />
2012<br />
4Q<br />
10.0%<br />
9.0%<br />
8.0%<br />
7.0%<br />
6.0%<br />
5.0%<br />
4.0%<br />
3.0%<br />
2.0%<br />
1.0%<br />
0.0%<br />
• Similar to absorption, after taking a breather in Q3, rent<br />
rates have resumed their climb to close out the year on a<br />
high note. Average asking rent rates for warehouse<br />
product have jumped to one of their highest levels near<br />
$7.75 PSF, triple net with flex space following suit<br />
increasing to almost $10.00 PSF.<br />
• The largest industrial sale for the quarter also marks<br />
what will likely become one of the highest priced sales on<br />
a price per square foot basis for industrial product in the<br />
county for quite some time. A Spanish buyer, MDR<br />
Inversiones, purchased the recently completed 56,000-<br />
SF DEA testing facility at 2205 NW 132nd Place in Doral<br />
for $43.8M. This represents a 7.0% cap rate on the 20<br />
year single-tenant lease and a whopping $782 PSF on<br />
rentable area.<br />
$12.00/nnn<br />
$11.00/nnn<br />
$10.00/nnn<br />
AVERAGE RENTAL RATES, $ / SF FULL SERVICE<br />
• One of the largest new leases of the quarter was signed<br />
by an undisclosed tenant at the Fowler Transfer building<br />
in the Airport West submarket. They signed 38,000 SF at<br />
roughly $9.75 PSF, gross.<br />
$9.00/nnn<br />
$8.00/nnn<br />
$7.00/nnn<br />
$6.00/nnn<br />
$5.00/nnn<br />
$4.00/nnn<br />
2010 3Q 2010 4Q 2011 1Q 2011 2Q 2011 3Q 2011 4Q 2012 1Q 2012 2Q 2012 3Q 2012 4Q<br />
INDUSTRIAL<br />
FLEX<br />
Colliers Broker Quick Commentary: South Florida’s<br />
industrial market is extremely healthy despite the fact that<br />
our overall economy is operating in an artificial<br />
environment. The overvalued stock market, residential<br />
housing values driven by FHA loans and foreign cash<br />
buyers, as well as the looming ramifications of healthcare<br />
reform, are all of symptoms of an economy without sound<br />
fundamentals.<br />
-Mort Fetterolf<br />
Director of Industrial Services<br />
P. 8 | COLLIERS INTERNATIONAL<br />
Contact: Crystal Proenza—crystal.proenza@colliers.com | Research: Alex Morcate—alex.morcate@colliers.com
SOUTH FLORIDA COMMERCIAL REAL ESTATE REVIEW | Q4 2012<br />
Miami-Dade County Industrial Submarket Statistics<br />
TYPE<br />
TOTAL<br />
INVENTORY<br />
(SF)<br />
TOTAL<br />
VACANCY<br />
(SF)<br />
TOTAL<br />
VACANCY<br />
RATE<br />
TOTAL NET<br />
ABSORPTION<br />
TOTAL RBA<br />
DELIVERED<br />
# OF<br />
DELIVERIES<br />
TOTAL RBA<br />
UNDER<br />
CONSTRUCTION<br />
WEIGHTED<br />
AVERAGE<br />
RENTAL<br />
RATE (NNN)<br />
AIRPORT WEST<br />
INDUSTRIAL 53,215,032 4,095,976 7.7% 612,165 0 0 547,435 $7.67<br />
FLEX 6,684,392 810,111 12.1% 30,846 0 0 0 $13.88<br />
SUBTOTAL 59,899,424 4,906,087 8.2% 643,011 0 0 547,435 $8.36<br />
BIRD / TAMIAMI<br />
INDUSTRIAL 10,404,503 319,814 3.1% -8,231 0 0 0 $8.23<br />
FLEX 1,608,533 61,703 3.8% -14,095 0 0 0 $0.00<br />
SUBTOTAL 12,013,036 381,517 3.2% -22,326 0 0 0 $7.13<br />
CENTRAL DADE<br />
INDUSTRIAL 16,890,096 1,488,007 8.8% 39,422 0 0 0 $9.02<br />
FLEX 533,329 84,338 15.8% 0 0 0 0 $0.00<br />
SUBTOTAL 17,423,425 1,572,345 9.0% 39,422 0 0 0 $8.74<br />
HIALEAH / MIAMI<br />
GARDENS<br />
INDUSTRIAL 21,091,999 1,550,772 7.4% 432,608 0 0 0 $6.14<br />
FLEX 514,027 14,370 2.8% 0 0 0 0 $0.00<br />
SUBTOTAL 21,606,026 1,565,142 7.2% 432,608 0 0 0 $5.99<br />
MEDLEY<br />
INDUSTRIAL 30,947,998 1,566,824 5.1% -35,254 53,000 1 397,188 $7.83<br />
FLEX 2,496,691 69,573 2.8% 28,885 0 0 0 $8.10<br />
SUBTOTAL 33,444,689 1,636,397 4.9% -6,369 53,000 1 397,188 $7.85<br />
NORTH DADE<br />
INDUSTRIAL 38,534,398 2,102,817 5.5% 640,630 0 0 0 $6.80<br />
FLEX 2,403,812 435,733 18.1% 29,674 0 0 0 $8.35<br />
SUBTOTAL 40,938,210 2,538,550 6.2% 670,304 0 0 0 $6.89<br />
SOUTH DADE /<br />
HOMESTEAD<br />
INDUSTRIAL 4,899,084 324,512 6.6% -7,186 0 0 0 $8.87<br />
FLEX 532,594 23,543 4.4% -8,758 0 0 0 $0.00<br />
SUBTOTAL 5,431,678 348,055 6.4% -15,944 0 0 0 $8.00<br />
TOTAL INDUSTRIAL 175,983,110 11,448,722 6.0% 1,674,154 53,000 1 944,623 $7.52<br />
TOTAL FLEX 14,773,378 1,499,371 0.8% 66,552 0 0 0 $9.01<br />
MIAMI DADE<br />
TOTAL INDUSTRIAL<br />
190,756,488 12,948,093 6.8% 1,740,706 53,000 1 944,623 $7.64<br />
Contact: Crystal Proenza—crystal.proenza@colliers.com | Research: Alex Morcate—alex.morcate@colliers.com<br />
COLLIERS INTERNATIONAL | P. 9
SOUTH FLORIDA COMMERCIAL REAL ESTATE REVIEW | Q4 2012<br />
Miami-Dade County Retail<br />
$26.50/nnn<br />
$26.00/nnn<br />
$25.50/nnn<br />
$25.00/nnn<br />
$24.50/nnn<br />
$24.00/nnn<br />
$23.50/nnn<br />
$23.00/nnn<br />
$22.50/nnn<br />
RENTAL RATE VS. VACANCY RATE<br />
2010 3Q 2010 4Q 2011 1Q 2011 2Q 2011 3Q 2011 4Q 2012 1Q 2012 2Q 2012 3Q 2012 4Q<br />
6.0%<br />
5.0%<br />
4.0%<br />
3.0%<br />
2.0%<br />
1.0%<br />
0.0%<br />
• Miami Dade County has seen a record year in<br />
investment sales, recording some of the largest and<br />
highest priced sales in recent history. The largest<br />
sale of the quarter was closed by a joint venture<br />
between Terranova (a local retail investor) and<br />
Acadia Realty Trust (a retail REIT). They purchased<br />
a string of retail shops measuring 55,500 SF along<br />
Lincoln Road for $139M. This represents a price per<br />
square foot of above $2,500.<br />
250,000<br />
RENTAL RATE VACANCY RATE<br />
ABSORPTION / DELIVERIES / VACANCY RATE<br />
6.0%<br />
• One of the largest leases of the quarter was signed<br />
by an undisclosed tenant at Opa Locka Shopping<br />
Center in the former Badcock Furniture space. The<br />
tenant signed 23,000 SF at roughly $5.95 PSF, triple<br />
net.<br />
200,000<br />
150,000<br />
100,000<br />
5.0%<br />
4.0%<br />
3.0%<br />
2.0%<br />
• After seeing little change during Q3, vacancy rates<br />
have fallen again, now down to 4.0% through the<br />
end of the year and well off the almost 6.0% highs<br />
seen a few years ago.<br />
50,000<br />
0<br />
2010 3Q 2010 4Q 2011 1Q 2011 2Q 2011 3Q 2011 4Q 2012 1Q 2012 2Q 2012 3Q 2012 4Q<br />
DELIVERIES ABSORPTION VACANCY RATE<br />
1.0%<br />
0.0%<br />
• Average asking rent rates slid during Q4 down to<br />
$25.75 PSF, triple net. The decline from Q3 is modest<br />
and typical of fluctuations throughout the year. A<br />
good sign of the strength of asking rates in the county<br />
is that of sub-lease space, which has seen asking<br />
rates almost double over the last two years.<br />
700,000<br />
600,000<br />
500,000<br />
400,000<br />
300,000<br />
CONSTRUCTION ACTIVITY, SF<br />
• Net absorption recorded one of the strongest<br />
quarters on recent record with almost 225,000 SF<br />
of positive net absorption. With a strong end to 2012,<br />
the total year-to-date positive net absorption is<br />
nearly 600,000 SF on almost 2.0M SF of total deals.<br />
200,000<br />
100,000<br />
0<br />
2010 3Q 2010 4Q 2011 1Q 2011 2Q 2011 3Q 2011 4Q 2012 1Q 2012 2Q 2012 3Q 2012 4Q<br />
SF UNDER CONSTRUCTION<br />
Colliers Broker Quick Commentary: Vacancy and cap<br />
rates are close to all time lows. Rents continue to climb.<br />
New concepts needing multiple sites could find entry to<br />
Miami-Dade County difficult at best at this time.<br />
-Rob Warstler<br />
Director of Retail Services<br />
P. 10 | COLLIERS INTERNATIONAL<br />
Contact: Crystal Proenza—crystal.proenza@colliers.com | Research: Alex Morcate—alex.morcate@colliers.com
SOUTH FLORIDA COMMERCIAL REAL ESTATE REVIEW | Q4 2012<br />
Miami-Dade County Retail Statistics by Product Type<br />
TYPE<br />
TOTAL<br />
INVENTORY<br />
(SF)<br />
TOTAL<br />
VACANCY<br />
(SF)<br />
TOTAL<br />
VACANCY<br />
RATE<br />
TOTAL NET<br />
ABSORPTION<br />
TOTAL RBA<br />
DELIVERED<br />
WEIGHTED<br />
TOTAL RBA<br />
AVERAGE<br />
UNDER<br />
RENTAL RATE<br />
CONSTRUCTION<br />
(NNN)<br />
NEIGHBORHOOD CENTER 18,523,519 988,535 5.3% 92,915 64,862 44,862 $23.54<br />
COMMUNITY CENTER 14,703,715 558,705 3.8% 46,591 0 0 $22.97<br />
LIFESTYLE CENTER 1,459,477 61,012 4.2% 10,191 0 0 $0.00<br />
OUTLET CENTER 207,873 0 0.0% 0 0 0 $0.00<br />
POWER CENTER 3,062,139 13,216 0.4% 14,202 0 0 $39.76<br />
REGIONAL CENTER 3,809,040 176,856 4.6% 561 0 520,000 $40.45<br />
STRIP CENTER 7,788,553 474,469 6.1% 4,917 0 0 $21.89<br />
SUPER REGIONAL CENTER 10,447,309 173,635 1.7% 51,400 35,000 0 $81.87<br />
ENTERTAINMENT CENTER 473,588 57,191 12.1% 2,454 0 0 $21.31<br />
MIAMI DADE<br />
RETAIL TOTAL<br />
60,475,213 2,503,619 4.1% 223,231 99,862 564,862 $35.46<br />
Contact: Crystal Proenza—crystal.proenza@colliers.com | Research: Alex Morcate—alex.morcate@colliers.com<br />
COLLIERS INTERNATIONAL | P. 11
SOUTH FLORIDA COMMERCIAL REAL ESTATE REVIEW | Q4 2012<br />
$25.00/fs<br />
RENTAL RATE VS. VACANCY RATE<br />
14.8%<br />
<strong>Broward</strong> County Office<br />
$24.80/fs<br />
$24.60/fs<br />
$24.40/fs<br />
$24.20/fs<br />
$24.00/fs<br />
$23.80/fs<br />
$23.60/fs<br />
$23.40/fs<br />
$23.20/fs<br />
2010 3Q 2010 4Q 2011 1Q 2011 2Q 2011 3Q 2011 4Q 2012 1Q 2012 2Q 2012 3Q 2012 4Q<br />
14.7%<br />
14.6%<br />
14.5%<br />
14.4%<br />
14.3%<br />
14.2%<br />
14.1%<br />
14.0%<br />
13.9%<br />
13.8%<br />
• The largest sale of the quarter was closed by Transatlantic<br />
Pine Island Property, LLC which purchased the 136,000-<br />
SF class B office building located at 1776 N Pine Island<br />
Road, also known as Bank of America Plaza. The sale<br />
took place just before the end of the year for $17.5M.<br />
• The largest lease of the quarter was signed by Red<br />
Ventures at Miramar Park of Commerce. They signed<br />
31,800 SF at $9.95 PSF, triple net.<br />
RENTAL RATE VACANCY RATE<br />
ABSORPTION / DELIVERIES / VACANCY RATE<br />
300,000<br />
14.8%<br />
250,000<br />
14.7%<br />
200,000<br />
14.6%<br />
150,000<br />
14.5%<br />
100,000<br />
14.4%<br />
50,000<br />
14.3%<br />
0<br />
(50,000)<br />
14.2%<br />
(100,000)<br />
14.1%<br />
(150,000)<br />
14.0%<br />
(200,000)<br />
13.9%<br />
(250,000)<br />
13.8%<br />
2010 3Q2010 4Q2011 1Q2011 2Q2011 3Q2011 4Q2012 1Q2012 2Q2012 3Q2012 4Q<br />
DELIVERIES ABSORPTION VACANCY RATE<br />
AVERAGE RENTAL RATES, $ / SF FULL SERVICE<br />
$35.00/fs<br />
$30.00/fs<br />
$25.00/fs<br />
$20.00/fs<br />
$15.00/fs<br />
$10.00/fs<br />
2010 3Q 2010 4Q 2011 1Q 2011 2Q 2011 3Q 2011 4Q 2012 1Q 2012 2Q 2012 3Q 2012 4Q<br />
CLASS A CLASS B CLASS C<br />
• Vacancy rates across all office product in <strong>Broward</strong> County<br />
have gone unchanged from the previous quarter, still at<br />
roughly 14.0%. While vacancy rates have improved over<br />
the last year, progress has been slow. This is true for<br />
class A, B and C space, which remained virtually flat at<br />
19%, 14% and 7% respectively.<br />
• Just like vacancy rates have remained unchanged,<br />
average asking rent rates are flat from the previous<br />
quarter. In fact, at the close of Q4 2012, average asking<br />
rates were only off 3.5% from 2010 will little fluctuation<br />
in between. There is some softness in class A space at<br />
$28.40 PSF, down 2% year-over-year.<br />
• Net absorption was near 0 for the quarter. But, with a<br />
longer-term view, net absorption ended the year with a<br />
total year-to-date positive net absorption of over 250,000<br />
square feet. Also, absorption was not negative for each<br />
quarter during 2012, the first time this has happened in<br />
several years.<br />
Colliers Broker Quick Commentary: The year finished<br />
on a positive note in <strong>Broward</strong>. Activity was most evident<br />
in SW <strong>Broward</strong>. Cypress Creek also <strong>real</strong>ized significant<br />
absorption, however much of this was the result of several<br />
user purchases of vacant, or near vacant, office buildings.<br />
Major purchases by buyers such as Citrix, Zimmerman<br />
Advertising, One Blood and Nipro absorbed the vacancy<br />
in the market.<br />
-Robert Listokin, SIOR<br />
Executive Vice President<br />
Office 25,000 Square Feet + : Unlike the improvements seen in Miami Dade County, institutional office performance<br />
in <strong>Broward</strong> County has remained nearly flat over the last year and has actually worsened when compared over<br />
a longer term trend. Vacancy rates ended the year at approximately 22%, but this is up from 19% during 2010.<br />
After a tough year in 2011 (net negative absorption of 500,000 SF), 2012 saw some improvement but it wasn’t<br />
enough to make up for the lost ground, recording net negative absorption of 30,000 SF for the year. On the<br />
bright side, there is no inventory under construction, which helps the short-term recovery. Average asking rent<br />
rates fell slightly in Q4 down to $24.50 PSF, gross.<br />
Contact: Crystal Proenza—crystal.proenza@colliers.com | Research: Alex Morcate—alex.morcate@colliers.com<br />
COLLIERS INTERNATIONAL | P. 12
SOUTH FLORIDA COMMERCIAL REAL ESTATE REVIEW | Q4 2012<br />
<strong>Broward</strong> County Office Submarket Statistics<br />
CLASS<br />
COMMERCIAL CORRIDOR<br />
TOTAL<br />
INVENTORY<br />
(SF)<br />
% OF<br />
SUBMARKET<br />
RBA<br />
TOTAL<br />
VACANCY<br />
(SF)<br />
TOTAL<br />
VACANCY<br />
RATE<br />
TOTAL NET<br />
ABSORPTION<br />
TOTAL RBA<br />
DELIVERED<br />
TOTAL RBA<br />
UNDER<br />
CONSTRUCTION<br />
WEIGHTED<br />
AVERAGE<br />
RENTAL<br />
RATE (FULL<br />
SERVICE)<br />
CLASS A 52,000 2.5% 23,743 45.7% 1,190 0 0 $16.46<br />
CLASS B 1,191,738 58.4% 177,793 14.9% 4,351 0 0 $16.87<br />
CLASS C 797,246 39.1% 68,301 8.6% -4,220 0 0 $15.34<br />
SUBTOTAL 2,040,984 100.0% 269,837 13.2% 1,321 0 0 $16.26<br />
CYPRESS CREEK<br />
CLASS A 1,204,462 26.5% 246,775 20.5% 25,255 0 0 $26.96<br />
CLASS B 2,462,707 54.1% 455,431 18.5% 6,933 0 0 $20.63<br />
CLASS C 883,963 19.4% 116,656 13.2% 1,571 0 0 $14.13<br />
SUBTOTAL 4,551,132 100.0% 818,862 18.0% 33,759 0 0 $21.04<br />
CBD / DOWNTOWN FT. LAUDERDALE<br />
CLASS A 4,454,238 55.6% 947,385 21.3% 1,229 0 0 $31.36<br />
CLASS B 2,166,579 27.1% 297,130 13.7% 7,130 0 0 $24.52<br />
CLASS C 1,383,990 17.3% 62,514 4.5% 4,175 0 0 $19.13<br />
SUBTOTAL 8,004,807 100.0% 1,307,029 16.3% 12,534 0 0 $27.39<br />
FT. LAUDERDALE<br />
CLASS A 399,254 8.8% 117,005 29.3% -2,564 0 0 $25.82<br />
CLASS B 2,867,820 63.1% 478,603 16.7% -44,765 0 0 $24.31<br />
CLASS C 1,276,925 28.1% 119,907 9.4% -6,213 0 0 $16.45<br />
SUBTOTAL 4,543,999 100.0% 715,515 15.7% -53,542 0 0 $22.23<br />
HOLLYWOOD<br />
CLASS A 335,037 8.8% 27,011 8.1% 7,727 0 0 $30.69<br />
CLASS B 1,720,468 45.0% 238,674 13.9% 10,759 0 0 $24.41<br />
CLASS C 1,770,590 46.3% 76,578 4.3% 19,869 0 0 $16.53<br />
SUBTOTAL 3,826,095 100.0% 342,263 8.9% 38,355 0 0 $21.31<br />
NE BROWARD / DEERFIELD BEACH<br />
CLASS A 357,676 12.2% 151,665 42.4% 5,661 0 0 $25.08<br />
CLASS B 2,077,682 71.1% 259,210 12.5% 138 0 0 $19.25<br />
CLASS C 487,351 16.7% 38,440 7.9% -602 0 0 $16.80<br />
SUBTOTAL 2,922,709 100.0% 449,315 15.4% 5,197 0 0 $19.55<br />
NW BROWARD / CORAL SPRINGS<br />
CLASS A 819,563 20.6% 255,904 31.2% -34,321 0 0 $25.61<br />
CLASS B 2,086,239 52.4% 315,559 15.1% 13,520 0 0 $21.66<br />
CLASS C 1,077,068 27.0% 51,124 4.7% 1,222 0 0 $17.09<br />
SUBTOTAL 3,982,870 100.0% 622,587 15.6% -19,579 0 0 $21.24<br />
continued on the next page...<br />
P. 13 | COLLIERS INTERNATIONAL<br />
Contact: Crystal Proenza—crystal.proenza@colliers.com | Research: Alex Morcate—alex.morcate@colliers.com
<strong>Broward</strong> County Office Submarket Statistics continued...<br />
CLASS<br />
PLANTATION<br />
TOTAL<br />
INVENTORY<br />
(SF)<br />
% OF<br />
SUBMARKET<br />
RBA<br />
TOTAL<br />
VACANCY<br />
(SF)<br />
TOTAL<br />
VACANCY<br />
RATE<br />
TOTAL NET<br />
ABSORPTION<br />
TOTAL RBA<br />
DELIVERED<br />
TOTAL RBA<br />
UNDER<br />
CONSTRUCTION<br />
WEIGHTED<br />
AVERAGE<br />
RENTAL<br />
RATE (FULL<br />
SERVICE)<br />
CLASS A 1,663,724 28.6% 303,641 18.3% 316 0 0 $29.66<br />
CLASS B 3,071,920 52.9% 330,783 10.8% -6,455 0 0 $21.11<br />
CLASS C 1,075,194 18.5% 86,755 8.1% -8,156 0 0 $17.65<br />
SUBTOTAL 5,810,838 100.0% 721,179 12.4% -14,295 0 0 $22.92<br />
POMPANO BEACH<br />
CLASS A 1,249,524 29.9% 330,884 26.5% -21,828 0 0 $26.17<br />
CLASS B 2,013,600 48.3% 331,138 16.4% 2,603 0 0 $19.43<br />
CLASS C 910,086 21.8% 88,067 9.7% 7,055 0 0 $14.10<br />
SUBTOTAL 4,173,210 100.0% 750,089 18.0% -12,170 0 0 $20.29<br />
SUNRISE / SAWGRASS<br />
CLASS A 1,757,603 49.0% 287,454 16.4% -30,311 0 0 $26.79<br />
CLASS B 1,496,369 41.7% 191,110 12.8% -43,334 0 0 $23.23<br />
CLASS C 332,710 9.3% 45,330 13.6% 0 0 0 $21.83<br />
SUBTOTAL 3,586,682 100.0% 523,894 14.6% -73,645 0 0 $24.84<br />
SW BROWARD<br />
SOUTH FLORIDA COMMERCIAL REAL ESTATE REVIEW | Q4 2012<br />
CLASS A 2,710,105 39.2% 328,151 12.1% 69,225 0 806,572 $29.93<br />
CLASS B 3,354,400 48.5% 295,393 8.8% 16,554 0 0 $23.44<br />
CLASS C 852,865 12.3% 56,171 6.6% -9,701 0 0 $22.00<br />
SUBTOTAL 6,917,370 100.0% 679,715 9.8% 76,078 0 806,572 $25.81<br />
CLASS A TOTAL 15,003,186 NA 3,019,618 20.1% 21,579 0 806,572 $28.91<br />
CLASS B TOTAL 24,509,522 NA 3,370,824 13.8% -32,566 0 0 $21.96<br />
CLASS C TOTAL 10,847,988 NA 809,843 7.5% 5,000 0 0 $17.14<br />
BROWARD<br />
OFFICE TOTAL<br />
50,360,696 NA 7,200,285 14.3% -5,987 0 806,572 $22.99<br />
Contact: Crystal Proenza—crystal.proenza@colliers.com | Research: Alex Morcate—alex.morcate@colliers.com<br />
COLLIERS INTERNATIONAL | P. 14
SOUTH FLORIDA COMMERCIAL REAL ESTATE REVIEW | Q4 2012<br />
<strong>Broward</strong> County Industrial<br />
$8.00/nnn<br />
$7.00/nnn<br />
$6.00/nnn<br />
$5.00/nnn<br />
600,000<br />
500,000<br />
400,000<br />
300,000<br />
200,000<br />
100,000<br />
0<br />
(100,000)<br />
(200,000)<br />
(300,000)<br />
(400,000)<br />
RENTAL RATE VS. VACANCY RATE<br />
2010 3Q 2010 4Q 2011 1Q 2011 2Q 2011 3Q 2011 4Q 2012 1Q 2012 2Q 2012 3Q 2012 4Q<br />
2010<br />
3Q<br />
2010<br />
4Q<br />
RENTAL RATE<br />
VACANCY RATE<br />
ABSORPTION / DELIVERIES / VACANCY RATE<br />
2011<br />
1Q<br />
2011<br />
2Q<br />
2011<br />
3Q<br />
2011<br />
4Q<br />
2012<br />
1Q<br />
2012<br />
2Q<br />
2012<br />
3Q<br />
2012<br />
4Q<br />
10.0%<br />
9.5%<br />
9.0%<br />
8.5%<br />
8.0%<br />
7.5%<br />
10.0%<br />
9.5%<br />
9.0%<br />
8.5%<br />
8.0%<br />
7.5%<br />
• Industrial product has continued to show marked<br />
improvement across all counties in South Florida,<br />
and <strong>Broward</strong> is no exception. County-wide, industrial<br />
vacancies have fallen to just above 8.0%. While the<br />
quarterly change is minor, year-over-year<br />
improvement is noticeable from the mid-9.0% range<br />
seen last year.<br />
• The gradual improvement in vacancy is attributable<br />
to consistent positive net absorption for 2012. The<br />
quarter ended with +100,000 SF of positive net<br />
space. While this is modest compared to the rest of<br />
2012, the year ended strong with above 1.35M SF of<br />
positive net, marking 2012 to be one of the best<br />
performing years over the last five.<br />
• After recording a steady decline in average asking<br />
rent rates, Q4 actually saw a slight bump back to<br />
approximately $6.50 PSF, triple net.<br />
• The largest sale of the quarter was closed by Fields<br />
Realty, which purchased the mixed-use center at<br />
6810 N State Road 7 in Coconut Creek during<br />
October. The 400,000-SF asset is approximately<br />
50% occupied, part of which by Carl’s Furniture. The<br />
build-to-suit asset was completed in 2002 and was<br />
sold for $12.7M.<br />
$11.00/nnn<br />
DELIVERIES ABSORPTION VACANCY RATE<br />
AVERAGE RENTAL RATES, $ / SF FULL SERVICE<br />
• One of the largest new leases of the quarter was<br />
signed by an undisclosed tenant at Prospect Park III<br />
in Fort Lauderdale. They signed 62,400 SF at roughly<br />
$5.90 PSF, triple net.<br />
$10.00/nnn<br />
$9.00/nnn<br />
$8.00/nnn<br />
$7.00/nnn<br />
$6.00/nnn<br />
$5.00/nnn<br />
2010 3Q 2010 4Q 2011 1Q 2011 2Q 2011 3Q 2011 4Q 2012 1Q 2012 2Q 2012 3Q 2012 4Q<br />
INDUSTRIAL<br />
FLEX<br />
Colliers Broker Quick Commentary: The <strong>Broward</strong><br />
industrial market remains strong in the newer dock height<br />
buildings. However, the base rental rates remain in flux<br />
and creditworthiness and length of lease still drives the<br />
best deal.<br />
-Ronald Schagrin, SIOR<br />
Senior Vice President<br />
P. 15 | COLLIERS INTERNATIONAL<br />
Contact: Crystal Proenza—crystal.proenza@colliers.com | Research: Alex Morcate—alex.morcate@colliers.com
SOUTH FLORIDA COMMERCIAL REAL ESTATE REVIEW | Q4 2012<br />
<strong>Broward</strong> County Industrial Submarket Statistics<br />
TYPE<br />
TOTAL<br />
INVENTORY<br />
(SF)<br />
TOTAL<br />
VACANCY<br />
(SF)<br />
TOTAL<br />
VACANCY<br />
RATE<br />
TOTAL NET<br />
ABSORPTION<br />
TOTAL RBA<br />
DELIVERED<br />
WEIGHTED<br />
TOTAL RBA<br />
AVERAGE<br />
UNDER<br />
RENTAL RATE<br />
CONSTRUCTION<br />
(NNN)<br />
CENTRAL BROWARD<br />
INDUSTRIAL 12,388,555 1,007,941 8.1% 64,856 0 0 $5.26<br />
FLEX 1,401,310 128,262 9.2% -25,852 0 0 $8.73<br />
SUBTOTAL 13,789,865 1,136,203 8.2% 39,004 0 0 $5.61<br />
NORTH BROWARD<br />
INDUSTRIAL 36,091,167 3,744,096 10.4% 55,084 0 0 $5.93<br />
FLEX 4,491,343 697,596 15.5% -10,804 0 0 $8.71<br />
SUBTOTAL 40,582,510 4,441,692 10.9% 44,280 0 0 $6.24<br />
SE BROWARD<br />
INDUSTRIAL 19,960,498 1,068,497 5.4% 22,430 0 0 $5.90<br />
FLEX 2,434,268 124,992 5.1% 16,197 0 0 $10.39<br />
SUBTOTAL 22,394,766 1,193,489 5.3% 38,627 0 0 $6.39<br />
SW BROWARD<br />
INDUSTRIAL 14,725,903 1,191,797 8.1% 15,370 0 351,614 $6.83<br />
FLEX 2,890,184 258,398 8.9% 6,590 0 0 $9.31<br />
SUBTOTAL 17,616,087 1,450,195 8.2% 21,960 0 351,614 $7.24<br />
WEST BROWARD<br />
INDUSTRIAL 13,815,487 1,093,187 7.9% 8,410 0 0 $6.13<br />
FLEX 3,052,900 478,413 15.7% -16,006 0 0 $9.35<br />
SUBTOTAL 16,868,387 1,571,600 9.3% -7,596 0 0 $6.71<br />
TOTAL INDUSTRIAL 96,981,610 8,105,518 7.3% 166,150 0 351,614 $6.00<br />
TOTAL FLEX 14,270,005 1,687,661 1.5% -29,875 0 0 $9.26<br />
BROWARD<br />
INDUSTRIAL TOTAL<br />
111,251,615 9,793,179 8.8% 136,275 0 351,614 $6.42<br />
Contact: Crystal Proenza—crystal.proenza@colliers.com | Research: Alex Morcate—alex.morcate@colliers.com<br />
COLLIERS INTERNATIONAL | P. 16
SOUTH FLORIDA COMMERCIAL REAL ESTATE REVIEW | Q4 2012<br />
<strong>Broward</strong> County Retail<br />
$18.00/nnn<br />
$17.00/nnn<br />
RENTAL RATE VS. VACANCY RATE<br />
12.0%<br />
10.0%<br />
8.0%<br />
6.0%<br />
• The largest investment sale of the quarter was<br />
closed by Prudential Real Estate Investors, a national<br />
REIT, which paid $23.15M or $223 PSF for the<br />
104,000-SF Coral Landings shopping center during<br />
December. The in-place cap rate for the stabilized<br />
center was 6.00%. Tate Enterprises was the seller.<br />
$16.00/nnn<br />
$15.00/nnn<br />
2010 3Q 2010 4Q 2011 1Q 2011 2Q 2011 3Q 2011 4Q 2012 1Q 2012 2Q 2012 3Q 2012 4Q<br />
RENTAL RATE VACANCY RATE<br />
4.0%<br />
2.0%<br />
0.0%<br />
• One of the largest leases of the quarter was signed<br />
by Smart Gym at the Lauderhill Mall in Fort<br />
Lauderdale. They signed 27,000 SF at roughly $9.00<br />
PSF, triple net.<br />
500,000<br />
400,000<br />
ABSORPTION / DELIVERIES / VACANCY RATE<br />
12.0%<br />
10.0%<br />
• Average asking rent rates are still showing an overall<br />
upward trend. Even though rates are down slightly<br />
from the previous quarter they are still showing a<br />
positive trend year-over-year, ending 2012 at $17.30<br />
PSF, triple net.<br />
300,000<br />
200,000<br />
100,000<br />
0<br />
(100,000)<br />
(200,000)<br />
2010 3Q2010 4Q2011 1Q2011 2Q2011 3Q2011 4Q2012 1Q2012 2Q2012 3Q2012 4Q<br />
DELIVERIES ABSORPTION VACANCY RATE<br />
8.0%<br />
6.0%<br />
4.0%<br />
2.0%<br />
0.0%<br />
• Vacancy rates for retail spaces have followed the<br />
broader market trend through the end of the year,<br />
closing 2012 out at roughly 8.3% This is down from<br />
8.9% this time last year and down from above 10.5%<br />
seen during 2010. This change is directly related to<br />
strong positive net absorption of over 200,000 SF<br />
for the quarter and +540,000 SF for the whole year.<br />
160,000<br />
140,000<br />
120,000<br />
100,000<br />
CONSTRUCTION ACTIVITY, SF<br />
Colliers Broker Quick Commentary: The market has<br />
stabilized overall and is trending up for class A locations.<br />
The “wave “ from Miami is driving this.<br />
-Rob Warstler<br />
Director of Retail Services<br />
80,000<br />
60,000<br />
40,000<br />
20,000<br />
0<br />
2010 3Q 2010 4Q 2011 1Q 2011 2Q 2011 3Q 2011 4Q 2012 1Q 2012 2Q 2012 3Q 2012 4Q<br />
SF UNDER CONSTRUCTION<br />
P. 17 | COLLIERS INTERNATIONAL<br />
Contact: Crystal Proenza—crystal.proenza@colliers.com | Research: Alex Morcate—alex.morcate@colliers.com
SOUTH FLORIDA COMMERCIAL REAL ESTATE REVIEW | Q4 2012<br />
<strong>Broward</strong> County Retail Statistics by Product Type<br />
TYPE<br />
TOTAL<br />
INVENTORY<br />
(SF)<br />
TOTAL<br />
VACANCY<br />
(SF)<br />
TOTAL<br />
VACANCY<br />
RATE<br />
TOTAL NET<br />
ABSORPTION<br />
TOTAL RBA<br />
DELIVERED<br />
TOTAL RBA<br />
UNDER<br />
CONSTRUCTION<br />
WEIGHTED<br />
AVERAGE<br />
RENTAL<br />
RATE (NNN)<br />
NEIGHBORHOOD CENTER 23,017,161 2,262,967 9.8% 125,792 35,190 0 $16.63<br />
COMMUNITY CENTER 14,555,030 1,207,123 8.3% 14,727 0 0 $19.50<br />
LIFESTYLE CENTER 1,714,793 174,733 10.2% 5,597 0 0 $21.67<br />
OUTLET CENTER 167,180 6,467 3.9% 0 0 0 $0.00<br />
POWER CENTER 4,094,545 111,745 2.7% 16,852 0 0 $24.10<br />
REGIONAL CENTER 1,975,383 370,637 18.8% 4,640 0 0 $9.71<br />
STRIP CENTER 6,002,414 512,406 8.5% 32,479 12,204 0 $15.94<br />
SUPER REGIONAL CENTER 7,514,689 229,318 3.1% 0 0 0 $18.30<br />
ENTERTAINMENT CENTER 131,680 0 0.0% 0 0 0 $0.00<br />
BROWARD<br />
RETAIL TOTAL<br />
59,172,875 4,875,396 8.2% 200,087 47,394 0 $17.92<br />
Contact: Crystal Proenza—crystal.proenza@colliers.com | Research: Alex Morcate—alex.morcate@colliers.com<br />
COLLIERS INTERNATIONAL | P. 18
SOUTH FLORIDA COMMERCIAL REAL ESTATE REVIEW | Q4 2012<br />
$30.00/fs<br />
RENTAL RATE VS. VACANCY RATE<br />
21.5%<br />
Palm Beach County Office<br />
$29.00/fs<br />
$28.00/fs<br />
$27.00/fs<br />
21.0%<br />
20.5%<br />
20.0%<br />
19.5%<br />
19.0%<br />
18.5%<br />
18.0%<br />
• The largest office sale of the quarter was the 114,000-SF<br />
Sabadell United bank building in West Palm Beach owned<br />
by Pebb Enterprises. They sold the class B property for<br />
$15.42M or $135 PSF. The property was 83% occupied at<br />
the time of sale.<br />
$26.00/fs<br />
$25.00/fs<br />
2010 3Q 2010 4Q 2011 1Q 2011 2Q 2011 3Q 2011 4Q 2012 1Q 2012 2Q 2012 3Q 2012 4Q<br />
RENTAL RATE VACANCY RATE<br />
17.5%<br />
17.0%<br />
16.5%<br />
• The largest lease of the quarter was signed by an<br />
undisclosed tenant at Arvida Park of Commerce in Boca<br />
Raton. The 18,000-SF tenant closed the lease in October<br />
with a starting rent rate of $23.50 PSF, gross.<br />
400,000<br />
300,000<br />
200,000<br />
ABSORPTION / DELIVERIES / VACANCY RATE<br />
21.5%<br />
21.0%<br />
20.5%<br />
20.0%<br />
19.5%<br />
• Vacancy rates are still showing a consistent downward<br />
trend since the end of 2011, near 18% through the end of<br />
Q4. Class A vacancies showed a strong decline thanks to<br />
strong positive net absorption. Class B vacancies are flat<br />
from the previous quarter but still improving overall, yearover-year.<br />
100,000<br />
0<br />
(100,000)<br />
(200,000)<br />
2010 3Q2010 4Q2011 1Q2011 2Q2011 3Q2011 4Q2012 1Q2012 2Q2012 3Q2012 4Q<br />
19.0%<br />
18.5%<br />
18.0%<br />
17.5%<br />
17.0%<br />
16.5%<br />
• Average asking rent rates for the county are near $25.50<br />
PSF gross. This is nearly flat for the year. In fact, rents<br />
are flat for each class of office space. Class A space has<br />
remained consistent near $32 PSF since early 2011.<br />
Class B rents show a similar trend near $22 PSF.<br />
$35.00/fs<br />
$33.00/fs<br />
$31.00/fs<br />
$29.00/fs<br />
$27.00/fs<br />
$25.00/fs<br />
$23.00/fs<br />
$21.00/fs<br />
$19.00/fs<br />
$17.00/fs<br />
$15.00/fs<br />
DELIVERIES ABSORPTION VACANCY RATE<br />
AVERAGE RENTAL RATES, $ / SF FULL SERVICE<br />
2010 3Q 2010 4Q 2011 1Q 2011 2Q 2011 3Q 2011 4Q 2012 1Q 2012 2Q 2012 3Q 2012 4Q<br />
CLASS A CLASS B CLASS C<br />
• Absorption ended the year with positive net 360,000 SF<br />
for the quarter and a positive net absorption of over<br />
675,000 SF for the year. 2012 saw four consecutive<br />
quarters of positive net absorption, taking up more than<br />
double the space than during 2011. With negligible<br />
construction activity, this trend is expected to continue<br />
over the short-term.<br />
Colliers Broker Quick Commentary: The Palm Beach<br />
County office market continued to recover on a slow but<br />
sustained basis in Q4 2012. The predominant drivers in<br />
the market are the small and medium business owners<br />
that have paralleled the same recovery. As employment<br />
and the housing market expand, demand for office space<br />
will continue to increase on both a long and short term<br />
basis.<br />
-Kevin McCarthy<br />
Senior Vice President<br />
Office 25,000 Square Feet + : Institutional office product benefited from strong positive net absorption to close<br />
out 2012 on a high note. Q4 recorded more net absorption than had been seen since 2006, with over 175,000<br />
SF. This had a direct impact on vacancy rates which dipped to nearly 24.5%. Average asking rent rates are near<br />
$25.90 PSF, down slightly from the previous quarter, but flat from this time last year.<br />
P. 19 | COLLIERS INTERNATIONAL<br />
Contact: Crystal Proenza—crystal.proenza@colliers.com | Research: Alex Morcate—alex.morcate@colliers.com
SOUTH FLORIDA COMMERCIAL REAL ESTATE REVIEW | Q4 2012<br />
Palm Beach County Office Submarket Statistics<br />
CLASS<br />
TOTAL<br />
INVENTORY<br />
(SF)<br />
TOTAL<br />
VACANCY<br />
(SF)<br />
TOTAL<br />
VACANCY<br />
RATE<br />
TOTAL NET<br />
ABSORPTION<br />
TOTAL RBA<br />
DELIVERED<br />
TOTAL RBA<br />
UNDER<br />
CONSTRUCTION<br />
WEIGHTED AVERAGE RENTAL<br />
RATE (FULL SERVICE)<br />
BOCA RATON<br />
CLASS A 6,731,800 1,237,358 18.4% 58,625 0 0 $30.88<br />
CLASS B 7,821,906 2,260,147 28.9% 67,193 0 0 $22.41<br />
CLASS C 1,113,241 119,372 10.7% 5,062 0 0 $19.71<br />
SUBTOTAL 15,666,947 3,616,877 23.1% 130,880 0 0 $25.86<br />
DELRAY BEACH / BOYNTON BEACH<br />
CLASS A 262,204 90,648 34.6% 22,434 0 0 $24.30<br />
CLASS B 1,620,583 197,625 12.2% 7,550 0 0 $20.89<br />
CLASS C 455,437 50,167 11.0% 229 0 0 $19.45<br />
SUBTOTAL 2,338,224 338,440 14.5% 30,213 0 0 $20.99<br />
JUPITER<br />
CLASS A 1,372,451 158,934 11.6% -1,603 0 0 $29.24<br />
CLASS B 4,005,586 501,656 12.5% 78,071 0 0 $22.77<br />
CLASS C 467,340 51,128 10.9% 2,921 0 0 $20.36<br />
SUBTOTAL 5,845,377 711,718 12.2% 79,389 0 0 $24.10<br />
LAKE WORTH / ROYAL PALM BEACH<br />
CLASS A 528,608 30,203 5.7% -2,000 0 30,000 $29.31<br />
CLASS B 1,024,176 165,918 16.2% 4,210 0 0 $22.36<br />
CLASS C 649,024 65,542 10.1% -5,462 0 0 $17.31<br />
SUBTOTAL 2,201,808 261,663 11.9% -3,252 0 30,000 $22.54<br />
NORTH PALM BEACH<br />
CLASS A 112,665 29,907 26.5% 0 0 0 $20.07<br />
CLASS B 675,162 78,766 11.7% 0 0 0 $17.41<br />
CLASS C 250,912 35,919 14.3% 0 0 0 $14.07<br />
SUBTOTAL 1,038,739 144,592 13.9% 0 0 0 $16.89<br />
PALM BEACH GARDENS<br />
CLASS A 222,351 45,844 20.6% 5,636 0 0 $30.38<br />
CLASS B 636,021 59,466 9.3% 7,821 0 0 $21.66<br />
CLASS C 17,000 0 0.0% 0 0 0 $0.00<br />
SUBTOTAL 875,372 105,310 12.0% 13,457 0 0 $23.45<br />
WEST PALM BEACH (CBD)<br />
CLASS A 3,337,557 690,430 20.7% 60,785 0 0 $37.54<br />
CLASS B 4,849,763 853,770 17.6% -13,201 0 0 $23.63<br />
CLASS C 1,942,793 146,906 7.6% 63,169 0 0 $16.03<br />
SUBTOTAL 10,130,113 1,691,106 16.7% 110,753 0 0 $26.76<br />
CLASS A TOTAL 12,567,636 2,283,324 18.2% 143,877 0 30,000 $32.16<br />
CLASS B TOTAL 20,633,197 4,117,348 20.0% 151,644 0 0 $22.46<br />
CLASS C TOTAL 4,895,747 469,034 9.6% 65,919 0 0 $17.61<br />
PALM BEACH<br />
OFFICE TOTAL<br />
38,096,580 6,869,706 18.0% 361,440 0 30,000 $25.04<br />
Contact: Crystal Proenza—crystal.proenza@colliers.com | Research: Alex Morcate—alex.morcate@colliers.com<br />
COLLIERS INTERNATIONAL | P. 20
SOUTH FLORIDA COMMERCIAL REAL ESTATE REVIEW | Q4 2012<br />
$12.00/nnn<br />
RENTAL RATE VS. VACANCY RATE<br />
12.0%<br />
Palm Beach County Industrial<br />
$11.00/nnn<br />
$10.00/nnn<br />
$9.00/nnn<br />
$8.00/nnn<br />
$7.00/nnn<br />
$6.00/nnn<br />
10.0%<br />
8.0%<br />
6.0%<br />
4.0%<br />
2.0%<br />
• County-level vacancy rates continue to lead South<br />
Florida in terms of fundamental improvement.<br />
Vacancy rates have fallen to nearly 7.0%, down from<br />
almost 10.0% during 2010. Flex space has seen the<br />
largest improvement, falling from over 14% to 10%<br />
over the last three years.<br />
$5.00/nnn<br />
700,000<br />
0.0%<br />
2010 3Q 2010 4Q 2011 1Q 2011 2Q 2011 3Q 2011 4Q 2012 1Q 2012 2Q 2012 3Q 2012 4Q<br />
RENTAL RATE VACANCY RATE<br />
ABSORPTION / DELIVERIES / VACANCY RATE<br />
12.0%<br />
• This strong trend is attributable to continued positive<br />
net absorption, closing out the year with over<br />
750,000 SF of positive net, year-to-date. While this<br />
is only 15% better than 2011, the trend has been<br />
more consistent with five consecutive quarters of<br />
positive net absorption if one includes Q4 2011.<br />
600,000<br />
500,000<br />
400,000<br />
300,000<br />
200,000<br />
100,000<br />
0<br />
(100,000)<br />
2010<br />
3Q<br />
2010<br />
4Q<br />
2011<br />
1Q<br />
2011<br />
2Q<br />
2011<br />
3Q<br />
2011<br />
4Q<br />
2012<br />
1Q<br />
2012<br />
2Q<br />
2012<br />
3Q<br />
DELIVERIES ABSORPTION VACANCY RATE<br />
2012<br />
4Q<br />
10.0%<br />
8.0%<br />
6.0%<br />
4.0%<br />
2.0%<br />
0.0%<br />
• Average asking rent rates have shown slight growth<br />
during 2012, up to $7.90 PSF, triple net. This is flat<br />
from 2011 and still down from 2010. Warehouse<br />
space accounts for the majority of this trend, seeing<br />
little change over the last few years.<br />
• The largest industrial sale for the quarter was closed<br />
by CubeSmart, which purchased the 101,000-SF<br />
Forest Hill Self Storage in West Palm Beach for<br />
$5.8M or $57 PSF. The property was built in 2008.<br />
$12.00/nnn<br />
AVERAGE RENTAL RATES, $ / SF FULL SERVICE<br />
• The largest lease of the quarter was signed by Solar<br />
Tech, which took up 75,000 SF at Lewis Terminals<br />
in December.<br />
$11.00/nnn<br />
$10.00/nnn<br />
$9.00/nnn<br />
$8.00/nnn<br />
$7.00/nnn<br />
$6.00/nnn<br />
$5.00/nnn<br />
2010 3Q 2010 4Q 2011 1Q 2011 2Q 2011 3Q 2011 4Q 2012 1Q 2012 2Q 2012 3Q 2012 4Q<br />
Colliers Broker Quick Commentary: Palm Beach still<br />
lags behind Miami-Dade and <strong>Broward</strong>. However, it still<br />
has the most amount of industrial land to develop. We see<br />
this as a strong play for the future, unfortunately not in<br />
the immediate picture.<br />
-Elias Porras, SIOR, CCIM<br />
Senior Vice President<br />
INDUSTRIAL<br />
FLEX<br />
P. 21 | COLLIERS INTERNATIONAL<br />
Contact: Crystal Proenza—crystal.proenza@colliers.com | Research: Alex Morcate—alex.morcate@colliers.com
Palm Beach County Industrial Statistics<br />
SOUTH FLORIDA COMMERCIAL REAL ESTATE REVIEW | Q4 2012<br />
TYPE<br />
TOTAL<br />
INVENTORY<br />
(SF)<br />
TOTAL<br />
VACANCY<br />
(SF)<br />
TOTAL<br />
VACANCY<br />
RATE<br />
TOTAL NET<br />
ABSORPTION<br />
TOTAL RBA<br />
DELIVERED<br />
TOTAL RBA<br />
UNDER<br />
CONSTRUCTION<br />
WEIGHTED<br />
AVERAGE<br />
RENTAL RATE<br />
(NNN)<br />
BOCA RATON<br />
INDUSTRIAL 4,379,006 298,767 6.8% 10,851 0 0 $8.55<br />
FLEX 3,145,210 373,663 11.9% -6,883 0 0 $11.42<br />
SUBTOTAL 7,524,216 672,430 8.9% 3,968 0 0 $9.75<br />
CENTRAL PALM BEACH<br />
INDUSTRIAL 16,191,464 938,560 5.8% 45,672 0 0 $6.49<br />
FLEX 2,124,466 162,771 7.7% 24,311 0 0 $11.60<br />
SUBTOTAL 18,315,930 1,101,331 6.0% 69,983 0 0 $7.08<br />
NORTH PALM BEACH<br />
INDUSTRIAL 16,659,772 1,246,547 7.5% 91,594 0 0 $6.21<br />
FLEX 2,590,348 359,275 13.9% -13,590 0 20,900 $9.90<br />
SUBTOTAL 19,250,120 1,605,822 8.3% 78,004 0 20,900 $6.71<br />
TOTAL INDUSTRIAL 37,230,242 2,483,874 5.5% 148,117 0 0 $6.61<br />
TOTAL FLEX 7,860,024 895,709 2.0% 3,838 0 20,900 $10.97<br />
PALM BEACH<br />
INDUSTRIAL TOTAL<br />
45,090,266 3,379,583 7.5% 151,955 0 20,900 $7.37<br />
Contact: Crystal Proenza—crystal.proenza@colliers.com | Research: Alex Morcate—alex.morcate@colliers.com<br />
COLLIERS INTERNATIONAL | P. 22
SOUTH FLORIDA COMMERCIAL REAL ESTATE REVIEW | Q4 2012<br />
Palm Beach County Retail<br />
RENTAL RATE VS. VACANCY RATE<br />
$19.00/nnn<br />
12.0%<br />
10.0%<br />
$18.00/nnn<br />
8.0%<br />
$17.00/nnn<br />
6.0%<br />
4.0%<br />
$16.00/nnn<br />
2.0%<br />
$15.00/nnn<br />
0.0%<br />
2010 3Q 2010 4Q 2011 1Q 2011 2Q 2011 3Q 2011 4Q 2012 1Q 2012 2Q 2012 3Q 2012 4Q<br />
RENTAL RATE VACANCY RATE<br />
ABSORPTION / DELIVERIES / VACANCY RATE<br />
200,000<br />
12.0%<br />
150,000<br />
10.0%<br />
100,000<br />
8.0%<br />
50,000<br />
6.0%<br />
0<br />
4.0%<br />
(50,000)<br />
(100,000)<br />
2.0%<br />
(150,000)<br />
0.0%<br />
2010 3Q 2010 4Q 2011 1Q 2011 2Q 2011 3Q 2011 4Q 2012 1Q 2012 2Q 2012 3Q 2012 4Q<br />
DELIVERIES ABSORPTION VACANCY RATE<br />
• The largest investment sale of the quarter was the<br />
108,000-SF Plantation Square purchased by Publix<br />
for $31.05M (allocated from the $50.4M portfolio<br />
purchase) during December. This purchase was one<br />
of two shopping centers purchased from Plaza<br />
Development Company at a 6.2% cap rate.<br />
• The largest lease of the quarter was signed by Christ<br />
Fellowship Church in December. They took up 100%<br />
of the 126,000 SF available in the former Dillard’s<br />
space at the Boynton Beach Mall. This lease<br />
represents a lease-back from inter-related parties<br />
from the time of sale during the same month.<br />
• Retail vacancy rates have trended down over the last<br />
few years, now approaching 8.0% through the end<br />
of 2012. This is down from 10% during 2010.<br />
Although direct vacant space has declined noticeably,<br />
sublease space has actually increased four-fold over<br />
the same period.<br />
• Average asking rent rates have fallen 3% since the<br />
end of 2011, down to $16.50 PSF, triple net. More<br />
representative of the market correction is the change<br />
in rent rates since 2010, which are down 13%.<br />
160,000<br />
140,000<br />
120,000<br />
100,000<br />
80,000<br />
60,000<br />
40,000<br />
20,000<br />
0<br />
CONSTRUCTION ACTIVITY, SF<br />
2010 3Q 2010 4Q 2011 1Q 2011 2Q 2011 3Q 2011 4Q 2012 1Q 2012 2Q 2012 3Q 2012 4Q<br />
SF UNDER CONSTRUCTION<br />
• Net absorption recorded 150,000 SF of positive net<br />
during the last quarter of 2012. Total year-to-date<br />
absorption was also positive at 400,000 SF. The<br />
only negative quarter was Q1 2012. There is roughly<br />
150,000 SF of space currently under construction,<br />
all of which is at Delray Marketplace at 7777-9063 W<br />
Atlantic Boulevard in Delray Beach.<br />
Colliers Broker Quick Commentary: With the exception<br />
of Boca, the market is stabilizing. There are good<br />
prospects now looking at the A locations. Boca is hot.<br />
-Rob Warstler<br />
Director of Retail Services<br />
P. 23 | COLLIERS INTERNATIONAL<br />
Contact: Crystal Proenza—crystal.proenza@colliers.com | Research: Alex Morcate—alex.morcate@colliers.com
SOUTH FLORIDA COMMERCIAL REAL ESTATE REVIEW | Q4 2012<br />
Palm Beach County Retail Statistics by Product Type<br />
TYPE<br />
TOTAL<br />
INVENTORY<br />
(SF)<br />
TOTAL<br />
VACANCY<br />
(SF)<br />
TOTAL<br />
VACANCY<br />
RATE<br />
TOTAL NET<br />
ABSORPTION<br />
TOTAL RBA<br />
DELIVERED<br />
TOTAL RBA<br />
UNDER<br />
CONSTRUCTION<br />
WEIGHTED<br />
AVERAGE<br />
RENTAL<br />
RATE (NNN)<br />
NEIGHBORHOOD CENTER 15,645,256 1,589,762 10.2% 31,224 0 0 $15.81<br />
COMMUNITY CENTER 13,257,358 1,278,862 9.6% 81,133 0 149,539 $15.94<br />
LIFESTYLE CENTER 3,145,907 164,248 5.2% 23,592 0 0 $34.25<br />
OUTLET CENTER 0 0 0.0% 0 0 0 $0.00<br />
POWER CENTER 3,171,937 199,073 6.3% 1,610 0 0 $15.43<br />
REGIONAL CENTER 0 0 0.0% 0 0 0 $0.00<br />
STRIP CENTER 3,165,278 276,436 8.7% 13,012 0 0 $17.02<br />
SUPER REGIONAL CENTER 5,475,834 138,061 2.5% 0 0 0 $0.00<br />
ENTERTAINMENT CENTER 0 0 0.0% 0 0 0 $0.00<br />
PALM BEACH<br />
RETAIL TOTAL<br />
43,861,570 3,646,442 8.3% 150,571 0 149,539 $17.43<br />
Contact: Crystal Proenza—crystal.proenza@colliers.com | Research: Alex Morcate—alex.morcate@colliers.com<br />
COLLIERS INTERNATIONAL | P. 24
Colliers International South Florida Team<br />
PRINCIPALS<br />
Donna Abood<br />
Chairman - Founding Partner<br />
donna.abood@colliers.com<br />
PARTNERS<br />
Carol Ellis-Cutler<br />
Senior Vice President - Partner<br />
carol.ellis-cutler@colliers.com<br />
Michael T. Fay<br />
Chairman - Founding Partner<br />
michael.fay@colliers.com<br />
Jay A. Ziv, CCIM<br />
Senior Vice President – Partner<br />
jay.ziv@colliers.com<br />
Stephen Nostrand<br />
Chief Executive Officer<br />
stephen.nostrand@colliers.com<br />
David C. Metalonis, CCIM<br />
Senior Vice President -Partner<br />
david.metalonis@colliers.com<br />
TEAM MEMBERS<br />
BROKERAGE<br />
Achikam Yogev<br />
Senior Vice President<br />
achikam.yogev@colliers.com<br />
Alan Sperling<br />
Commercial Associate<br />
alan.sperling@colliers.com<br />
Claire Holash<br />
Senior Commercial Associate<br />
claire.holash@colliers.com<br />
Clinton M. Casey<br />
Senior Commercial Associate<br />
clinton.casey@colliers.com<br />
Elias Porras, CCIM, SIOR<br />
Senior Vice President<br />
elias.porras@colliers.com<br />
Erin Dee<br />
Commercial Associate<br />
erin.dee@colliers.com<br />
Ivo Tsinev<br />
Commercial Associate<br />
ivo.tsinev@colliers.com<br />
Jeff Resnick<br />
Commercial Associate<br />
jeff.resnick@colliers.com<br />
Joe Abood<br />
Office Leasing Consultant<br />
joe.abood@colliers.com<br />
John K. Crotty, CCIM<br />
Executive Vice President – Partner<br />
john.crotty@colliers.com<br />
Kent Schwarz<br />
Executive Vice President, Hotels<br />
kent.schwarz@colliers.com<br />
Kevin McCarthy<br />
Senior Vice President<br />
kevin.mccarthy@colliers.com<br />
Lawrence H. Stockton<br />
Senior Vice President<br />
larry.stockton@colliers.com<br />
Matthew Anderson<br />
Office Leasing Consultant<br />
matthew.anderson@colliers.com<br />
Mort Fetterolf<br />
Director Industrial Services<br />
mort.fetterolf@colliers.com<br />
Peyton Moore, MBA<br />
Senior Commercial Associate<br />
peyton.moore@colliers.com<br />
Randy Olen<br />
Executive Vice President<br />
randy.olen@colliers.com<br />
Rich Lillis<br />
Executive Vice President, Hotels<br />
rich.lillis@colliers.com<br />
Rob Warstler<br />
Director of Retail Services<br />
rob.warstler@colliers.com<br />
Robert R. Listokin, SIOR<br />
Executive Vice President<br />
robert.listokin@colliers.com<br />
Ronald A. Schagrin, SIOR<br />
Senior Vice President<br />
ronald.schagrin@colliers.com<br />
Ronald W. Osborne<br />
Vice President<br />
ron.osborne@colliers.com<br />
Sal Bonsignore, CCIM<br />
Vice President<br />
sal.bonsignore@colliers.com<br />
Xavier Cossard<br />
Senior Investment Sales Associate<br />
xavier.cossard@colliers.com<br />
PROPERTY MANAGEMENT<br />
Kevin Rude<br />
Director, Real Estate Management<br />
kevin.rude@colliers.com<br />
RECEIVERSHIP<br />
Bruce Kassman<br />
Receiver / Executive Vice President<br />
bruce.kassman@colliers.com<br />
PROJECT MANAGEMENT<br />
John Smotryski<br />
Director of Project Management<br />
john.smotryski@colliers.com<br />
This document has been prepared by Colliers International for advertising and general information only. Colliers International makes no guarantees, representations or<br />
warranties of any kind, expressed or implied, regarding the information including, but not limited to, warranties of content, accuracy and reliability. Any interested party<br />
should undertake their own inquiries as to the accuracy of the information. Colliers International excludes unequivocally all inferred or implied terms, conditions and<br />
warranties arising out of this document and excludes all liability for loss and damages arising there from. This publication is the copyrighted property of Colliers<br />
International and/or its licensor(s). ©2013. All rights reserved.
522 offices in<br />
62 countries<br />
• $1.8 billion in annual revenue<br />
• 1.25 billion square feet under management<br />
• Over 12,300 professionals<br />
Colliers International<br />
South Florida<br />
Commercial Real Estate Services<br />
95 Merrick Way, Suite 380<br />
Miami, FL 33129<br />
TEL +1 305 446 0011<br />
FAX +1 305 446 1907<br />
Accelerating success.