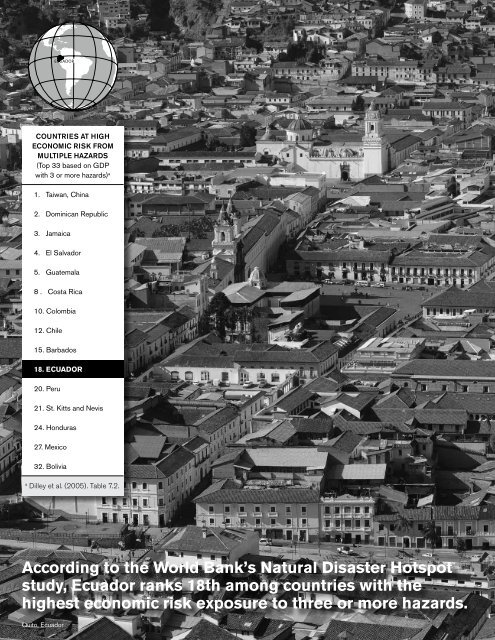
ECUADOR COUNTRIES AT HIGH ECONOMIC RISK FROM MULTIPLE HAZARDS (Top 33 based on GDP with 3 or more hazards) a 1. Taiwan, China 2. Dominican Republic 3. Jamaica 4. El Salvador 5. Guatemala 8 . Costa Rica 10. Colombia 12. Chile 15. Barbados 18. ECUADOR 20. Peru 21. St. Kitts and Nevis 24. Honduras 27. Mexico 32. Bolivia a Dilley et al. (2005). Table 7.2. According to the World Bank’s Natural Disaster Hotspot study, <strong>Ecuador</strong> ranks 18th among countries with the highest economic risk exposure to three or more hazards. Quito, <strong>Ecuador</strong>
Costa Rica Natural Disasters from 1980 - 2008 b 350,000 Affected People 300,000 Economic Damages 2% 250,000 Disaster Date Affected (Number of People) 68% Disaster Date Cost (US$ x 1,000) 200,000 Flood 1982 700,000 Earthquake* 1987 1,500,000 Volcano 2006 300,013 150,000 Mass mov. wet 1993 500,000 30% Flood 2008 289,122 Major Disaster 100,000 Impact Flood (2000) 1997 271,000 Flood 1992 205,000 100.00 50,000 Flood 1982 232,100 Flood 1983 200,000 Volcano 2006 150,000 0 Earthquake* 1987 150,000 Storm Flood Earthquake Flood Drought 2008 Earthquake* 45,000Flood Storm Volcano 2002 128,150 Lack of Resilience (2007) Flood 1992 50.00 Local 20,000 Events (2006-8) Epidemic 2000 100,000 Flood 1989 15,000 Mass mov. wet 1993 75,020 Flood 2006 57,670 Statistics by Disaster Type b <strong>Ecuador</strong> Population Socio-economic Affected by Fragility Disaster (2007) Type 0.00 400,000 Flood 2002 13,000 Volcano 2001 10,975 ecuador Economic Damages / Disaster Risk Management Type (1000s Index US$) (2008) 2,000,000 3% 63% Exposure & Physical 1,500,000Susceptibility (2007) LCR 17 Average Costa Rica 20% 1,000,000 500,000 1% 7% 5% Flood Epidemic Drought Volcano Earthquake Mass mov. wet 0 Earthquake* Flood Mass mov. wet Volcano Relative Vulnerability and Risk Indicators c Guatemala Major Disaster Impact (2000) 100.00 Lack of Resilience (2007) 50.00 2,000,000 Local Events (2006-8) 2% 58% 0.00 1,500,000 18% Socio-economic Fragility (2007) 3% 3% 15% 1,000,000 500,000 Risk Management Index (2008) LCR 17 Average 0 Storm Flood Epidemic Exposure & Physical Susceptibility Drought Flood Storm (2007) <strong>Ecuador</strong> Earthquake Drought Volcano b UN (2009). http://www.preventionweb.net/english/countries/statistics/?cid=53. Source data from EM-DAT. Data displayed does not imply national endorsement. c Relative Vulnerability and risk Indicators are adapted from IADB-IdeA-ern (2009). Values are normalized on scale of 0 – 100 and presented against the average for 17 LCR countries. Antigua Major and disaster Barbuda Impact taken from disaster deficit Index: the ratio of economic losses which a country could suffer during a Maximum Considered event and its economic resilience. Local events taken from Local disaster Index: the propensity of a country to experience recurrent, small-scale disasters and their cumulative impact on local development. risk Management Index is presented as the negative (i.e. 0 = optimal, 100 = incipient) of IADB’s risk Management Index: measures a country’s risk management 600,000 capability in (i) risk identification, (ii) risk reduction, (iii) disaster management, and (iv) financial protection. resilience, Fragility and exposure are taken from the component indices of Prevalent Vulnerability Index. Date for local event data depends on information available for each country. Data, 500,000 and the respective LCR 17 average, from 2000 is used for Dominican Republic, El Salvador, Guatemala, Jamaica 53% and Nicaragua. Data, and the respective LCR 17 average, from 2006-08 is used for Bolivia, Colombia, Costa 400,000 Rica, <strong>Ecuador</strong>, Panama and Peru. All LCR 17 averages are calculated based on available data. 300,000 59 47% 200,000 Major Disaster Impact (2000) 100,000 100