

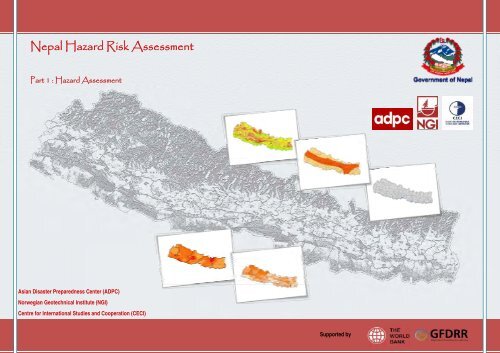
Nepal Hazard Risk Assessment - Asia-Pacific Gateway for Disaster ...
Nepal Hazard Risk Assessment - Asia-Pacific Gateway for Disaster ...
Nepal Hazard Risk Assessment - Asia-Pacific Gateway for Disaster ...

Create successful ePaper yourself
Turn your PDF publications into a flip-book with our unique Google optimized e-Paper software.
<strong>Nepal</strong> <strong>Hazard</strong> <strong>Risk</strong> <strong>Assessment</strong><br />
<strong>Nepal</strong> <strong>Hazard</strong> <strong>Risk</strong> <strong>Assessment</strong><br />
Part 1 : <strong>Hazard</strong> <strong>Assessment</strong><br />
<strong>Asia</strong>n <strong>Disaster</strong> Preparedness Center (ADPC)<br />
Norwegian Geotechnical Institute (NGI)<br />
Centre <strong>for</strong> International Studies and Cooperation (CECI)<br />
i<br />
Supported by
<strong>Nepal</strong> <strong>Hazard</strong> <strong>Risk</strong> <strong>Assessment</strong><br />
TABLE OF CONTENTS<br />
Table of contents ......................................................................................................................................... ii<br />
List of figures .............................................................................................................................................. iv<br />
List of tables ................................................................................................................................................. v<br />
Contributors ................................................................................................................................................ vi<br />
Acknowledgements .................................................................................................................................. viii<br />
Preface ......................................................................................................................................................... ix<br />
Acronyms ..................................................................................................................................................... x<br />
Executive Summary .................................................................................................................................... xi<br />
1 Introduction ........................................................................................................................................ 15<br />
1.1 Background ................................................................................................................................. 15<br />
1.2 Purpose of <strong>Hazard</strong> and <strong>Risk</strong> Mapping at National Level ............................................................ 15<br />
1.3 Assumption .................................................................................................................................. 16<br />
1.4 Project, Implementing organizations and partners ...................................................................... 16<br />
1.5 Project Objective ......................................................................................................................... 16<br />
1.6 Scope of the Assignment ............................................................................................................. 17<br />
1.7 Stakeholder Involve in the Project .............................................................................................. 17<br />
1.8 Methodology ............................................................................................................................... 17<br />
1.9 Project Outcomes ........................................................................................................................ 17<br />
2 Baseline Data and In<strong>for</strong>mation .......................................................................................................... 19<br />
2.1 Natural <strong>Disaster</strong> Profile of <strong>Nepal</strong> ................................................................................................ 19<br />
2.1.1 Earthquake <strong>Hazard</strong>s ............................................................................................................. 19<br />
2.1.2 Riverine and Flash Floods .................................................................................................... 19<br />
2.1.3 Drought ................................................................................................................................ 19<br />
2.1.4 Landslides ............................................................................................................................ 20<br />
2.1.5 Epidemics ............................................................................................................................. 20<br />
2.2 Trend Analysis of <strong>Disaster</strong>s ........................................................................................................ 20<br />
2.3 Source of Project Related Data ................................................................................................... 21<br />
2.4 Administrative boundaries .......................................................................................................... 23<br />
2.4.1 <strong>Nepal</strong> Geographical Development Region (Geo-Development Region) ............................. 23<br />
2.4.2 VDC (Village Development Commitees) Map .................................................................... 23<br />
2.5 Land Cover / Land Use ............................................................................................................... 24<br />
2.5.1 Classification of land cover .................................................................................................. 24<br />
2.5.2 Land cover distribution ........................................................................................................ 24<br />
2.6 Housing Infrastructure ................................................................................................................ 25<br />
2.7 Health Infrastructure ................................................................................................................... 26<br />
2.7.1 Classes of health infrastructure ............................................................................................ 26<br />
2.7.2 Number of health infrastructure .......................................................................................... 26<br />
2.7.3 Density maps with number of health infrastructure ............................................................ 26<br />
2.8 Education sector .......................................................................................................................... 27<br />
2.8.1 Type of education institutions ............................................................................................. 27<br />
2.8.2 Education Distribution ......................................................................................................... 27<br />
2.9 Fishery sector .............................................................................................................................. 28<br />
2.10 Irrigation infrastructure sector .................................................................................................... 29<br />
2.10.1 Surface irrigation ................................................................................................................. 29<br />
2.10.2 Ground water irrigation ....................................................................................................... 29<br />
2.10.3 Non-conventional irrigation (NCI)...................................................................................... 30<br />
2.10.4 Map of irrigation area .......................................................................................................... 30<br />
2.11 Agriculture sector ........................................................................................................................ 31<br />
2.12 Transportation sector .................................................................................................................. 32<br />
2.12.1 Type of transportation ......................................................................................................... 32<br />
2.12.2 Road ..................................................................................................................................... 32<br />
2.13 Industry sector ............................................................................................................................. 33<br />
2.14 Power sector ................................................................................................................................ 34<br />
2.15 Tourism sector ............................................................................................................................ 35<br />
2.16 Mining sector .............................................................................................................................. 36<br />
2.17 Trade and financial institutions sector ........................................................................................ 36<br />
2.17.1 Bank density ........................................................................................................................ 36<br />
2.17.2 Cooperatives density ............................................................................................................ 37<br />
2.18 Ground elevation ......................................................................................................................... 38<br />
2.18.1 Elevation .............................................................................................................................. 38<br />
2.18.2 Slope .................................................................................................................................... 38<br />
2.18.3 Source of data <strong>for</strong> elevation ................................................................................................. 38<br />
2.19 Demographic data ....................................................................................................................... 39<br />
2.19.1 Population density ............................................................................................................... 39<br />
2.19.2 Urban to district population ratio (ICIMOD and CBS, 2003b) ........................................... 39<br />
2.19.3 Aged dependency ratio (ICIMOD and CBS, 2003b) .......................................................... 39<br />
3 <strong>Hazard</strong> <strong>Assessment</strong> ............................................................................................................................ 40<br />
ii
<strong>Nepal</strong> <strong>Hazard</strong> <strong>Risk</strong> <strong>Assessment</strong><br />
3.1 Background ................................................................................................................................. 40<br />
3.1.1 Characteristics of <strong>Hazard</strong> <strong>Assessment</strong> ................................................................................. 40<br />
3.1.2 Scope of <strong>Hazard</strong> <strong>Assessment</strong> in the Project ......................................................................... 40<br />
3.2 Earthquake hazard assessment .................................................................................................... 41<br />
3.2.1 Map content .......................................................................................................................... 41<br />
3.2.2 Application of maps ............................................................................................................. 41<br />
3.2.3 Data availability from sources ............................................................................................. 41<br />
3.2.4 Methodology ........................................................................................................................ 41<br />
3.2.5 How to read the maps ........................................................................................................... 42<br />
3.2.6 Analysis of hazard assessment ............................................................................................. 42<br />
3.2.7 Special remarks .................................................................................................................... 44<br />
3.2.8 Recommendations ................................................................................................................ 44<br />
3.3 Landslide hazard assessment ....................................................................................................... 50<br />
3.3.1 Map content .......................................................................................................................... 50<br />
3.3.2 Application of maps in disaster risk management ............................................................... 50<br />
3.3.3 Data availability from sources ............................................................................................. 50<br />
3.3.4 Methodology ........................................................................................................................ 50<br />
3.3.5 How to read the maps ........................................................................................................... 51<br />
3.3.6 Analysis of hazard assessment ............................................................................................. 51<br />
3.3.7 Special remarks .................................................................................................................... 52<br />
3.3.8 Recommendations ................................................................................................................ 52<br />
3.4 Flood <strong>Hazard</strong> <strong>Assessment</strong> ........................................................................................................... 55<br />
3.4.1 Map Content ......................................................................................................................... 55<br />
3.4.2 Application of hazard maps in disaster risk management .................................................... 55<br />
3.4.3 Data availability from sources ............................................................................................. 55<br />
3.4.4 Methodology <strong>for</strong> flood hazard mapping .............................................................................. 55<br />
3.4.5 How to read the map ............................................................................................................ 56<br />
3.4.6 Analysis of <strong>Hazard</strong> <strong>Assessment</strong> ........................................................................................... 56<br />
3.4.7 Recommendations ................................................................................................................ 59<br />
3.5 Drought <strong>Hazard</strong> <strong>Assessment</strong> ....................................................................................................... 67<br />
3.5.1 Map Content ......................................................................................................................... 67<br />
3.5.2 Application of maps with respect to disaster risk management ........................................... 67<br />
3.5.3 Data availability from sources ............................................................................................. 67<br />
3.5.4 Special Remark .................................................................................................................... 67<br />
3.5.5 Methodology ........................................................................................................................ 67<br />
3.5.6 How to read this map ........................................................................................................... 68<br />
3.5.7 Conclusion and discussion ................................................................................................... 73<br />
3.6 Epidemic <strong>Hazard</strong> <strong>Assessment</strong> ..................................................................................................... 76<br />
3.6.1 Map Content ........................................................................................................................ 76<br />
3.6.2 Application of disease and outbreak hazard maps with respect to disaster risk management<br />
76<br />
3.6.3 Data availability from sources ............................................................................................. 76<br />
3.6.4 Special Remarks .................................................................................................................. 76<br />
3.6.5 Methodology ........................................................................................................................ 76<br />
3.6.6 How to read the map ............................................................................................................ 77<br />
3.6.7 Analysis of Disease / outbreak <strong>Assessment</strong> ........................................................................ 77<br />
3.6.8 Recommendations ............................................................................................................... 79<br />
3.7 Approach <strong>for</strong> Multi-hazard <strong>Assessment</strong> ..................................................................................... 86<br />
3.7.1 Application of Multi-hazard <strong>Assessment</strong> (Multi-HA)......................................................... 86<br />
3.7.2 Methodology <strong>for</strong> Multi <strong>Hazard</strong> <strong>Assessment</strong> ........................................................................ 86<br />
3.7.3 Analysis of Multi-HA .......................................................................................................... 86<br />
3.7.4 Recommendations ............................................................................................................... 87<br />
Reference ................................................................................................................................................... 90<br />
iii
<strong>Nepal</strong> <strong>Hazard</strong> <strong>Risk</strong> <strong>Assessment</strong><br />
LIST OF FIGURES<br />
Figure 1.1: Relationship between <strong>Disaster</strong> Management Cycle and <strong>Hazard</strong> & <strong>Risk</strong> Mapping (After (BGR<br />
and GAI, 2009)) ......................................................................................................................................... 15<br />
Figure 1.2. <strong>Assessment</strong> Methodology ........................................................................................................ 18<br />
Figure 2.1. Trend line showing annual occurrence of various disasters in <strong>Nepal</strong> (Based on <strong>Disaster</strong><br />
Catalog developed by Ministry of Home Affairs, GON) ........................................................................... 21<br />
Figure 2.2. Geo-development Zones of <strong>Nepal</strong>(Source: (DOS, 2001)) ...................................................... 23<br />
Figure 2.3. National Map showing VDCs in each district (source <strong>for</strong> VDC boundary: (DOS, 2001)) ..... 23<br />
Figure 2.4. Major sectors landcover distribution. (Source: (DOS, 2001)). ................................................ 24<br />
Figure 2.5. House types and distribution (source: (CBS, 2001); (ICIMOD and CBS, 2003b)). ............... 25<br />
Figure 2.6. Map showing number of health institutions in districts (Source:(ICIMOD and CBS, 2003b))<br />
.................................................................................................................................................................... 26<br />
Figure 2.7. Map showing Number of health institutions and population per institution (Source:(ICIMOD<br />
and CBS, 2003b)) ....................................................................................................................................... 26<br />
Figure 2.8. Number of school (source: (ICIMOD and CBS, 2003b)) ....................................................... 27<br />
Figure 2.9. School type distribution (source: (ICIMOD and CBS, 2003b)) .............................................. 28<br />
Figure 2.10. Fishery in <strong>Nepal</strong> ..................................................................................................................... 28<br />
Figure 2.11. Map showing distribution of DoI and FMIS surface irrigation system (source: (CERD,<br />
2007)) ......................................................................................................................................................... 29<br />
Figure 2.12. Distribution of ground water irrigation system in the country (source: (CERD, 2007)) ....... 29<br />
Figure 2.13. Districution of non-converntional irrigation system in the country (source: (CERD, 2007))<br />
.................................................................................................................................................................... 30<br />
Figure 2.14. Distribution of irrigation area in the country (source: (CERD, 2007)) ................................. 30<br />
Figure 2.15. Distribution of Agriculture land in <strong>Nepal</strong> .............................................................................. 31<br />
Figure 2.16. Agriculture Production (source: (ICIMOD and CBS, 2003b)) ............................................ 31<br />
Figure 2.17. Road length in country (source: (DOS, 2001)) ...................................................................... 32<br />
Figure 2.18. Road Density (source: (ICIMOD and CBS, 2003a)) ............................................................. 32<br />
Figure 2.19. Industries and economic profile(Source: (DOI, 2008)). ........................................................ 33<br />
Figure 2.20. Major power stations transmission lines and substations(source: (NEA, 2009) ) ................. 34<br />
Figure 2.21. Map of <strong>Nepal</strong> showing small hydro power station, Isolated solar and diesel power station<br />
(source: (NEA, 2009) ) ............................................................................................................................... 34<br />
Figure 2.22. Graph showing number of power stations and electric power production by various classes<br />
of stations(source: (NEA, 2009) ) .............................................................................................................. 34<br />
Figure 2.23. Tourist major region and purpose of visits (Source: (MTCA, 2008) ) .................................. 35<br />
Figure 2.24. Most visited placed in <strong>Nepal</strong> (Source: (MTCA, 2008) ) ....................................................... 35<br />
Figure 2.25. Total Revenue in 2007-08 due to Tourism (Source: (MTCA, 2008) ) .................................. 35<br />
Figure 2.26. Most popular entry point <strong>for</strong> tourists (Source: (MTCA, 2008) ) ........................................... 35<br />
Figure 2.27. Average total price of minerals (Source: (DMG, 2009)) ....................................................... 36<br />
Figure 2.28. Map show bank density per 1000 population (Source: (ICIMOD and CBS, 2003a)) ........... 36<br />
Figure 2.29. Map shows cooperatives density per 1000 population (Source: (ICIMOD and CBS, 2003a))<br />
.................................................................................................................................................................... 37<br />
Figure 2.30. Elevation and slope pixel count. ............................................................................................ 38<br />
Figure 2.31. Elevation and slope distribution (source: (USGS, 2003); (METI, 2006)) ............................. 38<br />
Figure 2.32. Population distribution. (Source: (CBS, 2001), (ICIMOD and CBS, 2003b)) ...................... 39<br />
Figure 3.1. Methodology <strong>for</strong> earthquake hazard mapping. ...................................................................... 41<br />
Figure 3.2. Visualization guideline. ........................................................................................................... 42<br />
Figure 3.3. <strong>Hazard</strong> vs total area cross plot <strong>for</strong> 500 year return period. ..................................................... 42<br />
Figure 3.4. <strong>Hazard</strong> vs total area cross plot <strong>for</strong> 250 year return period. ..................................................... 43<br />
Figure 3.5. <strong>Hazard</strong> vs total area cross plot <strong>for</strong> 100 year return period. ..................................................... 43<br />
Figure 3.6. <strong>Hazard</strong> vs total area cross plot <strong>for</strong> 50 year return period. ....................................................... 44<br />
Figure 3.7. Map of earthquake hazard zone <strong>for</strong> 500 yr return period. ....................................................... 46<br />
Figure 3.8. Map of earthquake hazard zone <strong>for</strong> 250 yr return period. ....................................................... 47<br />
Figure 3.9. Map of earthquake hazard zone <strong>for</strong> 100 yr return period. ....................................................... 48<br />
Figure 3.10. Map of earthquake hazard zone <strong>for</strong> 50 yr return period. ....................................................... 49<br />
Figure 3.11. Schematic approach <strong>for</strong> landslide hazard and risk evaluation. ............................................. 50<br />
Figure 3.12. <strong>Hazard</strong> vs total area cross plot <strong>for</strong> earthquake triggered landslide. ...................................... 51<br />
Figure 3.13. <strong>Hazard</strong> vs total area cross plot <strong>for</strong> precipitation triggered landslide. .................................... 52<br />
Figure 3.14. Earthquake induced landslide hazard map of <strong>Nepal</strong> ............................................................. 53<br />
Figure 3.15. Precipitation induced landslide hazard map of <strong>Nepal</strong> ........................................................... 54<br />
Figure 3.16.Flowchart showing the methodology <strong>for</strong> flood hazard assessment ....................................... 56<br />
Figure 3.17. Flood inundation causes by all identified rivers <strong>for</strong> 10 years return period .......................... 57<br />
Figure 3.18.Flood inundation causes by all identified rivers <strong>for</strong> 25 years return period ........................... 57<br />
Figure 3.19.Flood inundation causes by all identified rivers <strong>for</strong> 50 years return period ........................... 57<br />
Figure 3.20.Flood inundation causes by all identified rivers <strong>for</strong> 100 years return period ......................... 57<br />
Figure 3.21.Flood inundation causes by all identified rivers <strong>for</strong> 500 years return period ......................... 58<br />
Figure 3.22.Percentage of flood hazard area with respect to district area at 10 years return period ........ 58<br />
Figure 3.23.Percentage of flood hazard area with respect to district area at 25 years return period ......... 58<br />
Figure 3.24.Percentage of flood hazard area with respect to district area at 50 years return period ......... 58<br />
Figure 3.25.Percentage of flood hazard area with respect to district area at 100 years return period ....... 59<br />
Figure 3.26.Percentage of flood hazard area with respect to district area at 500 years return period ....... 59<br />
Figure 3.27.Rapti flood inundation mapping <strong>for</strong> 10 years, 25 years, 50 years, 100 years and 500 years<br />
return periods ............................................................................................................................................. 60<br />
Figure 3.28.Tinau flood inundation mapping <strong>for</strong> 10 years, 25 years, 50 years, 100 years and 500 years<br />
return periods ............................................................................................................................................. 61<br />
Figure 3.29.Babai flood inundation mapping <strong>for</strong> 10 years, 25 years, 50 years, 100 years and 500 years<br />
return periods ............................................................................................................................................. 62<br />
Figure 3.30.Bagmati flood inundation mapping <strong>for</strong> 10 years, 25 years, 50 years, 100 years and 500 years<br />
return periods ............................................................................................................................................. 63<br />
Figure 3.31.Kamala flood inundation mapping <strong>for</strong> 10 years, 25 years, 50 years, 100 years and 500 years<br />
return periods ............................................................................................................................................. 64<br />
Figure 3.32.Kankai flood inundation mapping <strong>for</strong> 10 years, 25 years, 50 years, 100 years and 500 years<br />
return periods ............................................................................................................................................. 65<br />
Figure 3.33.Narayani flood inundation mapping <strong>for</strong> 10 years, 25 years, 50 years, 100 years and 500 years<br />
return periods ............................................................................................................................................. 66<br />
Figure 3.34. Flow chart of drought index computation and its impact in different sectors. ................... 67<br />
Figure 3.35.Moderate drought susceptibility maps <strong>for</strong> (a) Winter (b) Premonsoon (c) Monsoon and (d)<br />
Postmonsoon seasons. ............................................................................................................................... 69<br />
Figure 3.36.Severe drought susceptibility maps <strong>for</strong> (a) Winter (b) Premonsoon (c) Monsoon and (d) .... 70<br />
Figure 3.37.Extreme drought susceptibility maps <strong>for</strong> (a) Winter (b) Premonsoon (c) Monsoon and (d)<br />
Postmonsoon seasons ................................................................................................................................ 71<br />
iv
<strong>Nepal</strong> <strong>Hazard</strong> <strong>Risk</strong> <strong>Assessment</strong><br />
Figure 3.38.Moderate to extreme drought susceptibility maps <strong>for</strong> (a) winter (b) premonsoon (c) monsoon<br />
and d) postmonsoon ................................................................................................................................... 72<br />
Figure 3.39. Drought occurrence in winter ................................................................................................ 73<br />
Figure 3.40. Drought occurrence in premonsoon ...................................................................................... 74<br />
Figure 3.41. Drought occurrence in monsoon ............................................................................................ 74<br />
Figure 3.42. Drought occurrence in postmonsoon ..................................................................................... 74<br />
Figure 3.43. Percentage of coverage of drought area with respect to district area .................................... 74<br />
Figure 3.44 Methodology of disease / outbreak susceptibility mapping ................................................... 78<br />
Figure 3.45.Trend analysis of Diseases and outbreak ................................................................................ 78<br />
Figure 3.46. Maps showing disease susceptibility maps <strong>for</strong> TB and STI .................................................. 80<br />
Figure 3.47. Maps showing disease suscetibility maps <strong>for</strong> Diarrhea and ARI .......................................... 81<br />
Figure 3.48.Maps showing disease susceptibility maps <strong>for</strong> Fliariasisi and Kalazar ................................. 82<br />
Figure 3.49. Maps showing disease susceptibility maps <strong>for</strong> Leprocy and Malaria ................................... 83<br />
Figure 3.50. Maps showing disease susceptibility maps <strong>for</strong> Typhoid and Hepatitis ................................ 84<br />
Figure 3.51. Maps showing disease susceptibility maps <strong>for</strong> Gastroenteritis and Influenza ARI .............. 85<br />
Figure 3.52 Multi hazard assessment scenario 1 ........................................................................................ 88<br />
Figure 3.53 Multi hazard assessment scenario 2 ........................................................................................ 89<br />
LIST OF TABLES<br />
Table 2.1. Profile of impact of various hazards in <strong>Nepal</strong> (Source: (CRED, 2009)) .................................. 20<br />
Table 2.2. Source of in<strong>for</strong>mation. .............................................................................................................. 22<br />
Table 2.3. Housing type percentage at country level (CBS, 2001) . ......................................................... 25<br />
Table 2.4. Number of School per thousand people of <strong>Nepal</strong> (source: (ICIMOD and CBS, 2003b)) ........ 27<br />
Table 3.1. Earthquake hazard zone scale ................................................................................................... 42<br />
Table 3.2. Districts area percentage distribution of Earthquake hazard assessment <strong>for</strong> 500 yr return<br />
period. ........................................................................................................................................................ 45<br />
Table 3.3. Districts area percentage distribution of Earthquake hazard assessment <strong>for</strong> 250 yr return<br />
period. ........................................................................................................................................................ 45<br />
Table 3.4. Districts area percentage distribution of Earthquake hazard assessment <strong>for</strong> 100 yr return<br />
period. ........................................................................................................................................................ 45<br />
Table 3.5. Districts area percentage distribution of Earthquake hazard assessment <strong>for</strong> 50 yr return period.<br />
................................................................................................................................................................... 45<br />
Table 3.6. Districts area percentage distribution of earthquake induced landslide. .................................. 52<br />
Table 3.7. Districts area percentage distribution of precipitation induced landslide. ............................... 52<br />
Table 3.8. Drought susceptibility. ............................................................................................................. 73<br />
Table 3.9. Seasonal Drought occurrence in different years ....................................................................... 73<br />
Table 3.10 Districts prone to multiple hazards under scenario one ........................................................... 86<br />
Table 3.11 Districts prone to multiple hazards under scenario two .......................................................... 87<br />
v
<strong>Nepal</strong> <strong>Hazard</strong> <strong>Risk</strong> <strong>Assessment</strong><br />
CONTRIBUTORS<br />
Project Contribution (Arranged in Alphabetic order)<br />
Project Management Team<br />
Name of organization Name Designation<br />
MNSI Arambepola Team Leader(Project), Director ADPC, Bangkok<br />
Amit Kumar<br />
Project Manager (Project), Senior Project<br />
Manager, ADPC, Bangkok<br />
Rendy Dwi Katiko Ex. GIS and Database Specialist, ADPC Bangkok<br />
Kittiphong Phongsapan GIS and Database Specialist, ADPC, Bangkok<br />
<strong>Asia</strong>n <strong>Disaster</strong> Preparedness<br />
Ex. GIS and Database Specialist, ADPC,<br />
Amin Budiarjo<br />
Center, Bangkok<br />
Bangkok<br />
Peeranan Towashiraporn Program Manager, ADPC, Bangkok<br />
Nirmala Fernando Project Manager, ADPC, Bangkok<br />
Anis ur Rahman<br />
Project Manager, ADPC, Bangkok<br />
Khaled Mushfiq<br />
Structural Engineer and Project Coordinator,<br />
ADPC Dhaka<br />
<strong>Hazard</strong> and Vulnerability <strong>Assessment</strong> Expert,<br />
Farrokh Nadim<br />
Director, International Centre <strong>for</strong> Geohazards,<br />
NGI, Norway<br />
Norwegian Geotechnical<br />
<strong>Hazard</strong> and Vulnerability <strong>Assessment</strong> Expert, Dy.<br />
Institute, Norway<br />
Bjørn Kalsnes<br />
Director, International Centre <strong>for</strong> Geohazards,<br />
NGI, Norway<br />
Helge Christian Smebye GIS and Database Specialist, NGI Norway<br />
<strong>Hazard</strong> and Vulnerability <strong>Assessment</strong> Expert,<br />
Prahlad K. Thapa Center <strong>for</strong> International Studies and Cooperation,<br />
Center <strong>for</strong> international<br />
studies and cooperation,<br />
<strong>Nepal</strong><br />
International Institute of<br />
Applied System Analysis,<br />
Austria<br />
The World Bank<br />
Sushma Shreshtha<br />
Sony Baral<br />
Reinhard Mechler<br />
Stefan Hochrainer<br />
Nakano Kazuyoshi<br />
Shyam S Ranjitkar<br />
Tashi Tenzing<br />
Silva Shreshtha<br />
<strong>Nepal</strong><br />
Project Administrative Support, Center <strong>for</strong><br />
International Studies and Cooperation, <strong>Nepal</strong><br />
Project Technical Support, Center <strong>for</strong><br />
International<br />
Studies and Cooperation, <strong>Nepal</strong><br />
Economic <strong>Risk</strong> <strong>Assessment</strong> Expert , International<br />
Institute of Applied System Analysis, Austria<br />
Economic <strong>Risk</strong> <strong>Assessment</strong> Expert, International<br />
Institute of Applied System Analysis, Austria<br />
Economic <strong>Risk</strong> <strong>Assessment</strong> Expert, Kyoto<br />
University, Japan<br />
Project Manager, The World Bank , <strong>Nepal</strong><br />
Project Manager, The World Bank , <strong>Nepal</strong><br />
Project research Analyst, The World Bank, <strong>Nepal</strong><br />
Name<br />
Achyut Lamichhang<br />
Ajay Kumar Mull<br />
Amrit Man Tuladhar<br />
Basistha Raj Adhikari<br />
Birendra Piya<br />
Dharanidhar Gautam<br />
Dilip Kumar Gautam<br />
Dinesh <strong>Nepal</strong>i<br />
Fulgen Pradhan<br />
Gauri Shankar Babsi<br />
Govind Prasad Kusum<br />
Hira Nanda Jha<br />
Indu Sharma Dhakal<br />
Kamal P. Budhathoki<br />
Keshav P. Sharma<br />
Lilanath Rimal<br />
Madhu Sudan Paudel<br />
Designation<br />
Department of Health Services, Ministry of Health and Population,<br />
Government of <strong>Nepal</strong><br />
Senior Divisional Engineer, Foreign Cooperation Branch, Department of<br />
Roads, Ministry of Physical Planning and Works, Government of <strong>Nepal</strong><br />
Senior Divisional Engineer, Department of Urban Development and Building<br />
Construction, Ministry of Physical Planning and Works, Government of<br />
<strong>Nepal</strong><br />
Senior Divisional Engineer, Department of Water Induced <strong>Disaster</strong><br />
Prevention, Ministry of Water Resources Government of <strong>Nepal</strong><br />
Senior Divisional Geologist, Department of Mines and Geology, Ministry of<br />
Industry, Commerce and Supplies, Government of <strong>Nepal</strong><br />
Dy. Director, Epidemiology and Disease Control Division, Department of<br />
Health Services, Ministry of Health and Population, Government of <strong>Nepal</strong><br />
Senior Divisional Hydrologist, Department of Hydrology and Meteorology,<br />
Ministry of Environment , Science and Technology, Government of <strong>Nepal</strong><br />
Department of Mines and Geology, Ministry of Industry, Commerce and<br />
Supplies, Government of <strong>Nepal</strong><br />
Director General, Department of Agriculture, Government of <strong>Nepal</strong><br />
Department of Water Induced <strong>Disaster</strong> Prevention, Department of Water<br />
induced <strong>Disaster</strong> Prevention, Ministry of Water Resources Government of<br />
<strong>Nepal</strong><br />
Chairman of Project Advisory Committee and Secretary, Ministry of Home<br />
Affairs, Government of <strong>Nepal</strong><br />
Director General, Department of Water Induced <strong>Disaster</strong> Prevention,<br />
Department of Water induced <strong>Disaster</strong> Prevention, Ministry of Water<br />
Resources Government of <strong>Nepal</strong><br />
Dy. Director, Department of Roads, Ministry of Physical Planning and<br />
Works, Government of <strong>Nepal</strong><br />
Senior Divisional Meteorologist, Department of Hydrology and Meteorology,<br />
Ministry of Environment , Science and Technology, Government of <strong>Nepal</strong><br />
Dy. Director General, Department of Hydrology and Meteorology, Ministry<br />
of Environment , Science and Technology, Government of <strong>Nepal</strong><br />
Senior Divisional Geologist, Department of Mines and Geology, Ministry of<br />
Industry, Commerce and Supplies, Government of <strong>Nepal</strong><br />
Director General, Department of Irrigation, Ministry of Water Resources,<br />
Government of <strong>Nepal</strong><br />
vi
<strong>Nepal</strong> <strong>Hazard</strong> <strong>Risk</strong> <strong>Assessment</strong><br />
Name<br />
Mahendra B. Gurung<br />
Mahesh Nakarmi<br />
Mohan Prasad Wagle<br />
Nandalal K D W<br />
Nirmal Hari Rajbhandari<br />
Pranay Upadhyay<br />
Purna Kadariya<br />
Rakesh Thakur<br />
Ram Prasad Pathak<br />
Rameshwor Dangal<br />
Rudra Khadka<br />
Saraju K. Baidya<br />
Sarbajeet Prasad Mahato<br />
Senendra Raj Upreti<br />
Shankar P. Kharel<br />
Shankar P. Koirala<br />
Shanmukhesh C. Amatya<br />
Shreekamal Dwivedi<br />
SomaNath Sapkota<br />
Suresh P Acharya<br />
Surya N. Shreshtha<br />
Thir Bahadur GC<br />
Vijoy Kumar Mallick<br />
Designation<br />
Member of Project Advisory Committee and Director General, Department<br />
of Water Induced <strong>Disaster</strong> Prevention, Department of Water induced <strong>Disaster</strong><br />
Prevention, Ministry of Water Resources Government of <strong>Nepal</strong><br />
Consultant, <strong>Disaster</strong> <strong>Risk</strong> Management, <strong>Nepal</strong><br />
Under Secretary, Ministry of Home Affairs, Government of <strong>Nepal</strong><br />
Professor & Head Department of Civil Engineering, University of<br />
Peradeniya, Sri Lanka<br />
Member of Project Advisory Committee and Director General, Department<br />
of Hydrology and Meteorology, Ministry of Environment , Science and<br />
Technology, Government of <strong>Nepal</strong><br />
Department of Health Services, Ministry of Health and Population,<br />
Government of <strong>Nepal</strong><br />
Secretary, Ministry of Physical Planning and Works, Government of <strong>Nepal</strong><br />
Department of Health Services, Ministry of Health and Population,<br />
Government of <strong>Nepal</strong><br />
Unit Chief, Senior Divisional Engineer, Department of Roads, Ministry of<br />
Physical Planning and Works, Government of <strong>Nepal</strong><br />
Undersecretary, Ministry of Home Affairs, Government of <strong>Nepal</strong><br />
Undersecretary, Ministry of Home Affairs, Government of <strong>Nepal</strong><br />
Department of Hydrology and Meteorology, Ministry of Environment ,<br />
Science and Technology, Government of <strong>Nepal</strong><br />
Member of Project Advisory Committee and Director General, Department<br />
of Mines and Geology, Ministry of Industry, Commerce and Supplies,<br />
Government of <strong>Nepal</strong><br />
Director, Epidemiology and Disease control Division, Department of Health<br />
Services, Ministry of Health and Population, Government of <strong>Nepal</strong><br />
Under Secretary, National Planning Commission, Government of <strong>Nepal</strong><br />
Joint Secretary and Vice Chairman of Project Advisory Committee, Ministry<br />
of Home Affairs, Government of <strong>Nepal</strong><br />
Senior Divisional Hydrologist, Department of Water Induced <strong>Disaster</strong><br />
Prevention, Ministry of Water Resources Government of <strong>Nepal</strong><br />
Department of Water induced <strong>Disaster</strong> Prevention, Ministry of Water<br />
Resources Government of <strong>Nepal</strong><br />
Chief National Seismological Center, Department of Mines and Geology,<br />
Ministry of Industry, Commerce and Supplies, Government of <strong>Nepal</strong><br />
Joint Secretary, Chairperson, Rural Housing Co. Ltd, Ministry of Physical<br />
Planning and Works, Government of <strong>Nepal</strong><br />
Executive Director, NSET, <strong>Nepal</strong><br />
Undersecretary, Ministry of Home Affairs, Government of <strong>Nepal</strong><br />
Director General, Department of Agriculture, Government of <strong>Nepal</strong><br />
vii
<strong>Nepal</strong> <strong>Hazard</strong> <strong>Risk</strong> <strong>Assessment</strong><br />
ACKNOWLEDGEMENTS<br />
The project team owes its deepest gratitude to the Ministry of Home Affairs (MoHA), Government of <strong>Nepal</strong> <strong>for</strong> its immense support during the implementation of this project. MoHA facilitated the project through<br />
constitution of the National Project Advisory Committee (PAC), encompassing all national technical departments including the Department of Health, the Department of Mines and Geology, the Department of Water<br />
induced <strong>Disaster</strong> Prevention, the Department of Hydrology and Meteorology, the Department of Agriculture and the National Planning Commission. The members of PAC provided full support throughout the project<br />
implementation in terms of data provision and the development of the methodology. The project team extends warm gratitude to the Global Forum <strong>for</strong> <strong>Disaster</strong> <strong>Risk</strong> Reduction and the World Bank <strong>Nepal</strong> <strong>for</strong> providing<br />
the necessary financial support to implement this project and develop the national risk profile of <strong>Nepal</strong>. This report will be one of the essential guiding tools <strong>for</strong> the implementation of disaster risk reduction measures in<br />
<strong>Nepal</strong>.<br />
The project team extends the greatest thanks to its project partners, the Norwegian Geotechnical Institute and the International Centre <strong>for</strong> Cooperation and Studies (CECI), <strong>for</strong> providing all technical support needed to<br />
complete the project. This mutual technical cooperation and collaboration has rendered immense benefit to project outcomes, as well as furthering institutions in building their professional capacity. The International<br />
Institute of Applied System Analysis (IIASA) has rendered its services in the development of economic modeling <strong>for</strong> disaster impacts. The team extends its heartiest thanks to the IIASA team <strong>for</strong> their support in<br />
developing the economic model <strong>for</strong> <strong>Nepal</strong>.<br />
The team would like to thank all stakeholders with whom the project team consulted with during the course of the implementation of this project. These interactions have greatly enriched the quality of the project<br />
outcomes. We would like to thank all technical consultants and advisors, particularly Dr. KWD Nandalal <strong>for</strong> the floods hazard and risk assessment, Mr. Kamal Budhathoki <strong>for</strong> the drought hazard assessment, Mr.<br />
Dharanidhar Gautam <strong>for</strong> the epidemic and disease mapping, Mr. Mahesh Nakarmi <strong>for</strong> the scoping the project needs and Mr. Ramhari Gaihare <strong>for</strong> the data collection and analysis.<br />
The project team would like to thank all ADPC colleagues and staff who provided the necessary support <strong>for</strong> the development of the GIS based database, data analysis, report preparation and financial and administrative<br />
support. The team extends gratitude to Ms. Emma Lovell and Ms. Katerina Telonis <strong>for</strong> all editorial support in bringing the report to its current <strong>for</strong>mat.<br />
viii
<strong>Nepal</strong> <strong>Hazard</strong> <strong>Risk</strong> <strong>Assessment</strong><br />
PREFACE<br />
It is my great honor to present this report on “<strong>Nepal</strong> <strong>Hazard</strong> and <strong>Risk</strong> <strong>Assessment</strong>”. This report received overwhelming support from the Government of <strong>Nepal</strong> in close collaboration with a number of national focal, technical and scientific agencies<br />
related to disaster risk reduction. The presented methodology was developed after rigorous discussion and consultation with all leading national government and non-governmental agencies. The project is financially supported by the Global Forum<br />
<strong>for</strong> <strong>Disaster</strong> <strong>Risk</strong> Reduction and the World Bank.<br />
The project highlights the regional experience intrinsic to the work of ADPC, NGI and CECI in disaster risk assessment and mapping in the region. The project objectives included the development of a synthesis report on <strong>Nepal</strong>'s major hazard risks<br />
through the completion of a desk review of existing reports, studies, analyses and assessments regarding vulnerability and hazards carried out at the national and sub-national levels; an overview presentation of the vulnerability assessment <strong>for</strong> <strong>Nepal</strong>;<br />
the development of a detailed economic analysis using the loss probability modeling of <strong>Nepal</strong>’s risks in conjunction with projected economic losses from <strong>for</strong>ecasted hazards; and the mapping of high risk geographic regions.<br />
Upon fulfilling the objectives of the project, the project team produced a two-part report. Part one covers an overview of the project, a description of the baseline data, and hazard assessment and mapping <strong>for</strong> earthquakes, floods, droughts, landslides<br />
and epidemics/disease hazards all at the national level. Thus, part one results in the development of a multi-hazard risk map <strong>for</strong> <strong>Nepal</strong>. Part two of the report discusses the methodology <strong>for</strong> exposure, vulnerability and risk assessment <strong>for</strong> various<br />
hazards. In addition, part two provides an analysis of the risk assessments as well as necessary interventions <strong>for</strong> disaster risk reduction.<br />
The project has further developed modeling <strong>for</strong> the economic effects of disaster risk in <strong>Nepal</strong>. Macro aspects of economic impacts are discussed in detail. This has led to an analysis of the country’s economic capacity to deal with impending<br />
disasters. Finally, the project provides recommendations <strong>for</strong> disaster risk reduction based on the completed pragmatic and scientific analysis. The recommendations are segmented into eight sections namely policy; institutional mandates and<br />
institutional development; hazard, vulnerability and risk assessment; multi-hazard early warning systems; preparedness and response plans; the integration of DRR into development planning; community-based DRM; and public awareness,<br />
education and training.<br />
I hope that this report will prove to be useful to the Ministry of Home Affairs, the Government of <strong>Nepal</strong>, the National Planning Commission, the Department of Water Induced <strong>Disaster</strong> Prevention, the Department of Health Services, the Department<br />
of Hydrology and Meteorology, the Department of Mines and Geology, the Department of Agriculture among others through its provision of sectorally-based disaster management planning. The report is <strong>for</strong>matted in a user-friendly manner such that<br />
all disciplines are able apply the in<strong>for</strong>mation and recommendations provided in the report <strong>for</strong> the safe and sustainable development of each respective sector. The ultimate goal is <strong>for</strong> the two volumes within the report to serve as a practical guide <strong>for</strong><br />
disaster managers, as well as enable them to use the in<strong>for</strong>mation provided effectively <strong>for</strong> the benefits of the millions of people living in disaster prone areas of <strong>Nepal</strong>.<br />
I would like to extend my sincere gratitude to Government of <strong>Nepal</strong>, the World Bank, national stakeholders involved and project partners <strong>for</strong> partnership, consultation, support and advices.<br />
Dr. Bhichit Rattakul<br />
Executive Director, ADPC, Bangkok<br />
ix
<strong>Nepal</strong> <strong>Hazard</strong> <strong>Risk</strong> <strong>Assessment</strong><br />
ACRONYMS<br />
ADPC <strong>Asia</strong>n <strong>Disaster</strong> Preparedness Center<br />
ANSS Advanced National Seismic System<br />
ARI Acute Respiratory Infection<br />
ASTER Advanced Spaceborne Thermal Emission and Reflection<br />
BGR Bundesanstalt fur Geowissenschaften und Rohstoffe<br />
CBS Central Bureau of Statistic<br />
CECI Center <strong>for</strong> International Studies and Cooperation<br />
CERD Center <strong>for</strong> Engineering Research and Development<br />
CERN European Organization <strong>for</strong> Nuclear Research<br />
CGIAR-CSI Consortium <strong>for</strong> Spatial In<strong>for</strong>mation<br />
CPC Climate Prediction Center<br />
CRED Centre <strong>for</strong> Research on the Epidemiology of <strong>Disaster</strong>s<br />
DHM Department of Hydrology and Meteorology<br />
DoI<br />
Department of Irrigation<br />
DOI Department of Industry<br />
DOS Department of Survey<br />
DRM <strong>Disaster</strong> <strong>Risk</strong> Management<br />
DTW Deep Tube Well<br />
DWIDP Department of Water Induced <strong>Disaster</strong> Prevention<br />
EHA Emergency and Humanitarian Action<br />
EM-DAT Emergency Events Database by CRED<br />
ESA European Space Agency<br />
FMIS Farmer Management Irrigation System<br />
GAI Geological Agency of Indonesia<br />
GDP Gross Domestic Product<br />
GIS Geographic In<strong>for</strong>mation System<br />
GLOF Glacial Lake Outburst Flood<br />
GPCC Global Precipitation Climatology Centre<br />
HC<br />
Health Centres<br />
HMIS Health Management In<strong>for</strong>mation System<br />
HP<br />
Health Post<br />
ICIMOD International Center <strong>for</strong> Integrated Mountain Development<br />
IIASA International Institute of Applied System Analysis<br />
MBF Main Boundary Fault<br />
MCT Main Central Thrust<br />
METI Ministry of Economy, Trade and Industry of Japan<br />
MMI Modified Mercalli Intensity<br />
MOHA Ministry of Home Affairs<br />
MoI Ministry of Irrigation<br />
MTCA Ministry of Tourism and Civil Aviation<br />
NCI Non Conventional Irrigation<br />
NDMC National Drought Mitigation Center<br />
NEA<br />
NGI<br />
NSC<br />
OCHA<br />
PGA<br />
PHC<br />
SHP<br />
SMI<br />
SPI<br />
SRTM<br />
STI<br />
STW<br />
TB<br />
UN<br />
UNDP<br />
UNITAR<br />
UNOSAT<br />
USACE<br />
USGS<br />
VDC<br />
WHO<br />
WMO<br />
<strong>Nepal</strong> Economic Agency<br />
Norwegian Geotechnical Institute<br />
National Seismological Center<br />
Office <strong>for</strong> the Coordination of Humanitarian Affairs.<br />
Peak Ground Acceleration<br />
Primary Health Centres<br />
Sub-Health Post<br />
Soil Moisture Index<br />
Standard Precipitation Index<br />
Shuttle Radar Topography Mission<br />
Sexual Transmitted Infection<br />
Shallow Tube Well<br />
Tuberculosis<br />
United Nations<br />
United Nations Development Programme<br />
UN Institute <strong>for</strong> Training and Research<br />
UNITAR Operational Satellite Applications Programme<br />
United State Army Corps of Engineer<br />
United State Geological Survey<br />
Village Development Committee<br />
World Health Organization<br />
World Meteorological Organization<br />
x
<strong>Nepal</strong> <strong>Hazard</strong> <strong>Risk</strong> <strong>Assessment</strong><br />
EXECUTIVE SUMMARY<br />
Background<br />
<strong>Nepal</strong> has witnessed several major natural disasters in the last two centuries. A number of those<br />
highlighted are the 1833 and 1934 earthquakes, the Koshi floods and the GLOF events in the higher<br />
Himalayas. Apart from these major disasters, <strong>Nepal</strong> also faces frequent landslides during monsoon<br />
season, thunder lightning, storms and regular seasonal flooding in terai areas. The combination of these<br />
multiple hazard events poses a severe threat to national development processes. The national government<br />
is committed to take the necessary measures to avert these threats in the development process. In line<br />
with this commitment, the Ministry of Home Affairs, Government of <strong>Nepal</strong> initiated the process of<br />
developing a national hazard and risk profile <strong>for</strong> the country. The project was financially supported by<br />
the Global Forum of <strong>Disaster</strong> <strong>Risk</strong> Reduction and the World Bank. The project was implemented by the<br />
<strong>Asia</strong>n <strong>Disaster</strong> Preparedness Center (ADPC), the Norwegian Geotechnical Institute (NGI) and the<br />
Center <strong>for</strong> International Studies and Cooperation (CECI). The project was technically supported by the<br />
International Institute of Applied System Analysis (IIASA). The project was largely implemented by<br />
consultation and coordination with all focal government departments including the Department of<br />
Hydrology and Meteorology, the Department of Mines and Geology, the Department of Health Services,<br />
the Department of Agriculture, the Department of Water Induced <strong>Disaster</strong> Prevention and the National<br />
Planning Commission. The project process was further coordinated with several focal agencies,<br />
departments and institutions.<br />
Project Objectives<br />
The project objectives include the development of a synthesis report on <strong>Nepal</strong>'s major hazard risks by<br />
carrying out a review of existing vulnerability and hazard reports, studies, analyses and assessments at<br />
the national and sub-national levels; an overview presentation of the vulnerability assessment <strong>for</strong> the<br />
country; the development of a detailed economic analysis using the loss probability modeling of <strong>Nepal</strong>’s<br />
risks in conjunction with projected economic losses from <strong>for</strong>ecasted hazards; and the mapping of high<br />
risk geographic regions.<br />
Scope of the Project<br />
The scope of the project included collecting and analyzing existing data and reports of historical losses<br />
due to catastrophic events in <strong>Nepal</strong>; mapping the natural hazard risks <strong>for</strong> <strong>Nepal</strong>; detailing exposure to<br />
droughts, floods, landslides, earthquakes and other hazards; analyzing and quantifying the projected<br />
losses in absence of mitigation investments; and identifying possible in<strong>for</strong>mation gaps and outlining the<br />
need <strong>for</strong> further analytical work to develop a comprehensive quantitative risk assessment <strong>for</strong> <strong>Nepal</strong>.<br />
Project Methodology<br />
The methodology has been compartmentalized into several sections. The methodology is presented in a<br />
flowchart as presented in Figure 1. The project methodology incorporated data collected from existing<br />
hazard and vulnerability studies, risk assessment reports, disaster databases, the national economic assets<br />
database etc. In addition, hazard mapping was conducted by modeling <strong>for</strong> earthquakes, floods,<br />
landslides, epidemics and drought. The vulnerability functions of various assets were characterized with<br />
respect to each hazard, as well as the estimation of associated risk and the economic implication of<br />
disasters. Lastly, national disaster risk reduction recommendations were evolved. The linkages between<br />
various components can be seen in Figure 1.<br />
The project began by studying a number of past disasters and their impacts in <strong>Nepal</strong>. Thanks to a strong<br />
national commitment to alleviate disaster suffering, the impacts of several types of disasters are reducing<br />
everyday. However, there will always exist the impending threat of major disasters in the future. There<br />
are several important sectors which govern the national growth of <strong>Nepal</strong> on which disasters can have<br />
serious impacts. It is thus necessary to assess such impacts on these identified sectors. Key sectors such<br />
as housing, health, education, transportation, agriculture, tourism, mines and query, power, industry,<br />
irrigation, fisheries and trade are considered in this report. However there remain several other important<br />
sectors in <strong>Nepal</strong> which could not be considered in this project due to the unavailability of data and time<br />
constraints.<br />
The hazard assessment and hazard mapping has been carried out <strong>for</strong> earthquakes, floods, landslides,<br />
droughts and epidemics. A variety of well established scientific tools and techniques have been used to<br />
assess the hazards and mapping accordingly. For earthquakes, hazard mapping is done <strong>for</strong> 50 year, 100<br />
year, 250 year and 500 year return periods. For flooding, the most flood prone rivers and catchments is<br />
considered in the flood hazard assessment. The flood hazard mapping presents flood severity in terms of<br />
inundation depth and area. It was carried out <strong>for</strong> the Kamala, Kankai, Bagmati, Tapti, Tinau, Babai and<br />
Narayani rivers and considered 10 year, 25 year, 50 year and 100 year return periods. The landslide<br />
hazard mapping is carried out according to two triggering factors, namely earthquake-induced and<br />
rainfall-induced. Landslide prone areas are classified as low, moderate and high prone areas. The<br />
drought hazard mapping consisted of an analysis <strong>for</strong> the whole of <strong>Nepal</strong> using the standard precipitation<br />
index. Drought hazards were classified into moderate, severe and extreme conditions. Furthermore, the<br />
drought assessment was carried out <strong>for</strong> four distinct seasons, namely winter, pre-monsoon, monsoon and<br />
post-monsoon. <strong>Hazard</strong> assessment and mapping is conducted <strong>for</strong> several epidemics and diseases<br />
including leprosy, malaria, tuberculosis (TB), sexually transmitted infections (STI), diarrhea, acute<br />
respiratory infections (ARI), filariasis and kalazar, typhoid, influenza and ARI, gastroenteritis and<br />
hepatitis.<br />
The hazards assessment concludes with a multi-hazard assessment and mapping based on two hazard<br />
severity scenarios. Scenario one considers a 500 year return period earthquake, earthquake-induced<br />
landslides, rainfall-induced landslides, 10 year return period floods, droughts occurring in the winter<br />
season, and health hazards susceptibility. Scenario two considers a 250 year return period earthquake,<br />
rainfall-induced landslides, 10 year return period floods, droughts occurring in the winter season, and<br />
health hazards susceptibility. Scenario one reveals that three districts Sindhuli, Salyan and Rolpa are<br />
having five types of Geological, Hydro-meteorological hazards. Ilam, Lalitpur, Dhading, Kaski,<br />
Syangja, Mustang, Rukum,Makawanpur, Dang, Jajarkot, Dailekh, Kalikot and Accham are prone to four<br />
xi
<strong>Nepal</strong> <strong>Hazard</strong> <strong>Risk</strong> <strong>Assessment</strong><br />
types of Geological, Hydro-meteorological hazards. Similarly second scenario further discusses about<br />
hazard prone districts.<br />
The next component of the report is the exposure, vulnerability and risk assessment. This is essential in<br />
policy-making, planning and strategy development. Each hazard has specific impacts on particular<br />
sectors. For example, earthquakes largely impact the population, housing, education, health, industry,<br />
transportation and power sectors. Floods largely impact the agriculture, housing, population, education,<br />
health and transportation sectors. Droughts largely affect the agriculture sector. Landslides typically<br />
occur in hilly areas and primarily affects the road sector. At the national scale, the damage caused by<br />
landslides is negligible in comparison to that caused by earthquakes, floods and droughts. These three<br />
disasters impact large geographical areas, covering almost all parts of the topography of <strong>Nepal</strong>. In light<br />
of this fact, only earthquakes, floods and droughts are considered <strong>for</strong> detailed exposure, vulnerability and<br />
risk assessment.<br />
The next component of the project was the modeling of the economic effects of disaster risk in <strong>Nepal</strong>.<br />
IIASA has tailored their CATSIM model specifically to the needs of <strong>Nepal</strong> and its disaster profile. The<br />
macroeconomic analysis encompassed using an economic growth framework as well as input-output<br />
analysis by way of a Social Accounting Matrix. Implications <strong>for</strong> developing a national strategy <strong>for</strong> risk<br />
reduction and management have been developed based on the combined analysis of the CATSIM model.<br />
The analysis shows that the economic and fiscal risks posed by natural disasters are large <strong>for</strong> <strong>Nepal</strong>, and<br />
there is a clear case <strong>for</strong> specifically considering these impacts in economic and fiscal planning.<br />
Finally, the project provides recommendations <strong>for</strong> using the economic risk and loss modelling <strong>for</strong><br />
disaster risk reduction based on the completed scientific analysis. This discussion is segmented into<br />
eight sections namely policy; institutional mandates and institutional development; hazard, vulnerability<br />
and risk assessment; multi-hazard early warning systems; preparedness and response plans; the<br />
integration of DRR into development planning; community-based DRM; and public awareness,<br />
education and training. Each section considers the geographic locations where projects should be<br />
implemented, the associated activities and expected outcomes of these projects, and the ministries,<br />
departments and agencies responsible <strong>for</strong> project implementation.<br />
Applications of the Project Report<br />
1 At present, several agencies have carried out risk assessments <strong>for</strong> various parts of <strong>Nepal</strong> at different<br />
scales. This study has developed a comprehensive risk assessment profile <strong>for</strong> the whole of <strong>Nepal</strong> at<br />
the district level. It will serve to enhance the qualitative and quantitative aspects of the work<br />
previously conducted by other agencies.<br />
2 Tools <strong>for</strong> physical vulnerability assessments of various assets at the district level have been<br />
developed. These will aid in the identification of the most vulnerable sectors and the measures<br />
necessary to reduce disaster impacts.<br />
3 The economic projection of losses will aid concerned stakeholders in prioritization within disaster<br />
risk reduction strategies.<br />
4 The study will bring out existing gaps in disaster risk reduction strategies. In addition, it will<br />
recommend measures to build decision-making capacities.<br />
5 This report is will be a useful tool in mainstreaming disaster risk reduction into various sectors at all<br />
levels.<br />
6 The assessment will help district and regional decision-makers, policy-makers and development<br />
agencies in preparing disaster risk reduction planning.<br />
7 Based on the outcomes of this study, the government may take actions toward capacity building <strong>for</strong><br />
disaster risk reduction.<br />
8 The study developed a robust methodology <strong>for</strong> hazard, vulnerability and risk assessment in close<br />
collaboration with national technical departments and agencies. These models may now be<br />
replicated in other countries and regions.<br />
9 Developing an economic model of losses based on the impacts of major hazards <strong>for</strong> a number of<br />
physical and social assets will guide budget allocation <strong>for</strong> disaster risk reduction of vital<br />
infrastructure.<br />
10 Ideally, the study will encourage the financial support of international organizations <strong>for</strong> measures<br />
and actions that will reduce the risk associated with natural hazards in <strong>Nepal</strong>.<br />
Report Chapter Organisation<br />
The project report is divided into two parts. The first part covers the project profile and background, as<br />
well as the sectoral database and hazards assessment and mapping. The second part of the report<br />
contains the exposure, vulnerability and risk assessments <strong>for</strong> earthquakes, floods and droughts, the<br />
economic modeling of losses, and recommendations <strong>for</strong> the development of a national disaster risk<br />
reduction strategy.<br />
Chapter organisation (Part One)<br />
• Chapter 1 presents the backgrounds of the project. It describes the relationship between disaster<br />
management cycle and risk assessment process. Mostly risk assessment process is carried out in predisaster<br />
phases, which provides diagnosis of disasters <strong>for</strong> a specific geographic location. This helps<br />
significantly in developing the basis <strong>for</strong> DRM. The chapter further discusses purpose of hazard and<br />
risk assessment mapping at national level and necessary assumption framework. The chapter also<br />
describes project implementation agencies and mode of partnership <strong>for</strong> project implementation,<br />
Project objectives, scopes, adopted methodology and expected outcomes. The chapter shows the<br />
flowchart of the project methodology.<br />
• Chapter 2 presents brief profile of natural hazards, and their respective trend in the country,<br />
characteristics of secondary data from various sources and various map in<strong>for</strong>mation including<br />
administrative boundaries, Landuse characteristics, housing, education, health, fisheries, irrigation,<br />
agriculture, transportation, industry, power and tourism, mining and trade and financial institutions<br />
sectors. The chapter further explains brief profile of each sector with their distribution in all districts.<br />
• Chapter 3 provides detailed understanding of hazard assessment, mapping and analysis of five major<br />
hazards in <strong>Nepal</strong>. It includes earthquake, floods, landslides, epidemics and drought. The chapter<br />
presents the overview of hazard assessment approach, earthquake hazard analysis, respective<br />
mapping <strong>for</strong> 50 years, 100 years, 250 years and 500 years return period, spatial distribution of<br />
hazards in <strong>Nepal</strong>. The landslide hazard mapping has been presented with two classes of triggering<br />
factors i.e., earthquake and heavy precipitation. The next section discusses about flood hazards<br />
assessment <strong>for</strong> seven major rivers. The flood hazard assessment has been discussed with 10 years, 25<br />
xii
<strong>Nepal</strong> <strong>Hazard</strong> <strong>Risk</strong> <strong>Assessment</strong><br />
years, 100 years and 500 years return period floods. The drought hazard mapping is carried out using<br />
Standard Precipitation Index. The chapter discusses the severity of drought in various part of the<br />
country. The hazard assessment further discusses implication of epidemics in the country, their<br />
distribution and respective causative factors. The chapter is concluded with developing multi-hazard<br />
scenarios <strong>for</strong> the country.<br />
Part Two: The whole report is divided into six chapters.<br />
• Chapter 1 discusses the concept, applications, process and challenges of exposure, vulnerability and<br />
risk assessment. The methodology adopted under the project is discussed in details.<br />
• Chapter 2 discusses about earthquake exposure, vulnerability and risk assessment. The chapter<br />
presents the methodology <strong>for</strong> exposure assessment, analysis of exposure considering population,<br />
housing, education, health, roads, industrial and power sectors. It further elaborates the methodology<br />
<strong>for</strong> vulnerability assessment along with risk assessment of various assets due to 100 and 500 years<br />
return period.<br />
• Chapter 3 presents flood exposure, vulnerability and risk assessment. The chapter reflects the<br />
methodology <strong>for</strong> floods exposure, vulnerability and risk assessment. Implication of floods hazards<br />
due to 10 years and 100 years return period are discussed with respect to various important physical<br />
assets including agriculture.<br />
• Chapter 4 elaborates on drought risk assessment, which is presented in terms of potential losses to<br />
various important crops in the country. The chapter discusses the methodology <strong>for</strong> drought risk<br />
assessment along with detailed analysis of crop losses and recommendations <strong>for</strong> enhancing the risk<br />
modeling and mitigation measures.<br />
• Chapter 5 introduces the economic risk and loss modelling approach <strong>for</strong> key hazards in <strong>Nepal</strong>. Such<br />
analysis are key <strong>for</strong> national, regional or district as well as international level decision makers to<br />
understand the economic implications of disasters. The IIASA CATSIM model was used <strong>for</strong><br />
economic modeling. The chapter presents details of CATSIM modeling , be<strong>for</strong>e it describes and<br />
further analyzes the results. The Chapter then further simplified the modeling outcome to be simply<br />
understood by decision makers and DRR professionals.<br />
• Chapter 6 concludes the project outcomes and renders realistic recommendations <strong>for</strong> national DRR<br />
planning.<br />
xiii
<strong>Nepal</strong> <strong>Hazard</strong> <strong>Risk</strong> <strong>Assessment</strong><br />
Flowchart showing Methodology <strong>for</strong> <strong>Hazard</strong>, Vulnerability and <strong>Risk</strong> <strong>Assessment</strong><br />
xiv
<strong>Nepal</strong> <strong>Hazard</strong> <strong>Risk</strong> <strong>Assessment</strong><br />
1 INTRODUCTION<br />
1.1 BACKGROUND<br />
Due to diverse geographical coverage, <strong>Nepal</strong> is prone to various geological and hydro-meteorological<br />
hazards. Recent civil unrest, recurring floods, landslides, epidemics has lead to severe economic direct<br />
and economic losses. The impact has been further aggravated due to catalytic factors like climate<br />
change, depletion of glacier, global warming and rapid unsafe urbanization. The Government of <strong>Nepal</strong><br />
is committed to establish disaster risk reduction regime though various policies, legislations and<br />
programs. Recently, National Strategy <strong>for</strong> <strong>Disaster</strong> <strong>Risk</strong> Management has been launched by the<br />
government. This is implemented in close collaboration with ministries, departments, national<br />
institutions and international agencies like the World Bank, UNDP and other agencies. The <strong>Risk</strong><br />
mapping and expected losses due to anticipated hazards are important steps <strong>for</strong> effective and precise<br />
disaster risk management.<br />
<strong>Risk</strong> assessment provides in<strong>for</strong>mation <strong>for</strong> decision makers and planners to identify counter measures to<br />
reduce the exposure to risks. <strong>Risk</strong> mapping is the first step <strong>for</strong> <strong>for</strong>ming the national, local and sectoral<br />
disaster mitigation planning. The graph shows the linkage between disaster management cycle and<br />
hazard and risk mapping.<br />
hazard and susceptibility maps development, exposure and vulnerability assessment and risk<br />
assessment <strong>for</strong> <strong>for</strong>ming national framework <strong>for</strong> disaster risk reduction.<br />
1.2 PURPOSE OF HAZARD AND RISK MAPPING AT NATIONAL LEVEL<br />
• At present condition, several agencies have carried out risk assessment <strong>for</strong> various parts of the<br />
country at different scale. The current study will enhance the qualitative and quantitative<br />
aspects of agencies works. The study will develop comprehensive risk assessment profile <strong>for</strong><br />
the whole country at district level.<br />
• The study project will develop tools <strong>for</strong> physical vulnerability assessment of various assets at<br />
district level. This will further help in identifying most vulnerable sector and necessary<br />
measures to reduce the impacts.<br />
• The sector specific economic projection of losses will assist the concerned stakeholders to<br />
prioritize disaster risk reduction strategy.<br />
• The study will bring out existing gaps in disaster risk reduction strategies. The study will also<br />
recommend measures to improve decision making capacity.<br />
• The outcome will be useful <strong>for</strong> mainstreaming disaster risk reduction in various sectors at<br />
different level.<br />
• The assessment will help district and regional decision makers, policy makers and development<br />
agencies <strong>for</strong> preparing disaster risk reduction planning<br />
• Based on the outcome of the studies, the government may take necessary action <strong>for</strong> capacity<br />
building <strong>for</strong> disaster risk reduction.<br />
• The studies will propose robust methodology in hazard, vulnerability and risk assessment in<br />
close collaboration with national technical departments and agencies. The level of assessment<br />
will be from national to district level. These models can be utilized <strong>for</strong> replicating in other<br />
regions and countries<br />
• The study outcome will evolve economic modeling of losses caused by various major hazards<br />
on defined physical and social assets. This will help in allocating budget <strong>for</strong> disaster risk<br />
reduction <strong>for</strong> various vital infrastructure and assets.<br />
• The outcome of the study will hopefully facilitate financial support from international<br />
organizations <strong>for</strong> measures and actions that reduce the risk associated with natural hazards in<br />
<strong>Nepal</strong>.<br />
Figure 1.1: Relationship between <strong>Disaster</strong> Management Cycle and <strong>Hazard</strong> & <strong>Risk</strong> Mapping (After (BGR and GAI, 2009))<br />
There are several ways by which methodology <strong>for</strong> hazard and risk assessment can be defined. The<br />
proposed methodology is largely contextualized <strong>for</strong> practical implementation of DRM at country level.<br />
This methodology broadly identifies various essential components like collection of base line data,<br />
15
<strong>Nepal</strong> <strong>Hazard</strong> <strong>Risk</strong> <strong>Assessment</strong><br />
1.3 ASSUMPTION<br />
1.4 PROJECT, IMPLEMENTING ORGANIZATIONS AND PARTNERS<br />
(i)<br />
(ii)<br />
(iii)<br />
(iv)<br />
(v)<br />
(vi)<br />
(vii)<br />
Resources:: The project has been allocated with limited funding support to cover project studies<br />
and scope. With limited resources, the consultant will be largely dependent on secondary source<br />
data and in<strong>for</strong>mation. The consultant has ensured collection of data from various authentic<br />
sources ranging from government ministries, departments, agencies, research and technical<br />
organizations. The project studies will generate in<strong>for</strong>mation and data based on secondary,<br />
existing validated data, without field based data collection. The national agencies generously<br />
supported the project in terms of data sharing and technical advices.<br />
Time limitation: The time allocated <strong>for</strong> the study project is limited to 16 months. In stated time<br />
frame, extensive hazard, vulnerability and risk assessment along with economic analysis has<br />
been carried out. Since Time span <strong>for</strong> the study project is less, consultant has ensured<br />
qualitative outcome within this limited time frame.<br />
Precision Standards: The study project has ensured quality outcome with considerable<br />
precision. In general, hazard assessment is carried out using scientific tools, are validated with<br />
field checks. Since the time and resources are limited, consultant has validated outcome of the<br />
hazard map with well established available data and in<strong>for</strong>mation. The outcomes have been<br />
validated using statistical tools and methods. For the said study, consultant has developed the<br />
products at suitable scale.<br />
Availability of data: For assessment of hazards, vulnerability and associated risk, several<br />
geological, hydro-meteorological, Geo-morphological data, socio-economic data, census data<br />
and database of infrastructure were required. Several in<strong>for</strong>mation are available, however, large<br />
data are missing. This limits the robustness of the modeling. The consultant has attempted to<br />
generate and modify the data/ in<strong>for</strong>mation based on available data suiting to the modeling<br />
requirements.<br />
Technical methodology : Development of methodology of the hazard, vulnerability and risk<br />
assessment have largely depended upon availability of data and resources<br />
Classification of hazard <strong>for</strong> modeling: Based on dataset hazards developed by the Ministry of<br />
Home Affairs, it has been found that earthquake, floods, drought, landslide and epidemic are<br />
major problems. The consultant has developed <strong>Hazard</strong>, vulnerability and risk mapping <strong>for</strong><br />
above said hazards.<br />
Loss Estimation Data: Ef<strong>for</strong>ts are made to develop economic loss based of scientific model.<br />
The data compiled by Ministry of Home Affairs <strong>for</strong> economic losses will be used <strong>for</strong> validation.<br />
The <strong>Asia</strong>n <strong>Disaster</strong> Preparedness Center (ADPC), in association with Center <strong>for</strong> International Studies<br />
and Cooperation (CECI), <strong>Nepal</strong> and Norwegian Geotechnical Institute (NGI) has been awarded to<br />
deliver consulting services <strong>for</strong> the study of “<strong>Nepal</strong> <strong>Hazard</strong> <strong>Risk</strong> <strong>Assessment</strong>” under F058204-GFDRR.<br />
ADPC team will work in close association with the Ministry of Home Affairs, Department of Mines<br />
and Geology, Department of Water Induced <strong>Disaster</strong> prevention, Department of Hydrology and<br />
Meteorology, Department of Health Services, etc in all aspects of project implementation. Close<br />
linkages with Department of Agriculture, Ministry of Physical Planning and Works, Ministry of<br />
In<strong>for</strong>mation and Communication, will be ensured through ongoing partnership arrangements and<br />
previous experience in working with these organizations, to facilitate secondary data collection, hazard<br />
specific in<strong>for</strong>mation exchange and sharing of any other data relevant to the study.<br />
The project will cover various technical and management activities including review of ongoing studies<br />
and activities related to various hydro-meteorological, geological and biological hazards, establish<br />
hazard assessment methodology, approach <strong>for</strong> vulnerability assessment, exposure assessment <strong>for</strong><br />
various sectors (construction, social, economic, industrial, education, health, agriculture, <strong>for</strong>est assets),<br />
economic projections of losses caused by existing major hazards. The major outcome will show the<br />
way to identify institutional gaps, prioritizing the disaster risk reduction, options <strong>for</strong> institutional<br />
measures etc.<br />
The studies will provide opportunity to share existing in<strong>for</strong>mation, data and resources in developing<br />
comprehensive hazard assessment. The focal agencies <strong>for</strong> various hazard assessments will get<br />
opportunity to interact with international research and development agencies, working in hazard and<br />
disaster management.<br />
Several recent studies have been carried out by Department of Mines and Geology, Department of<br />
Health Services, Department of Water Induced <strong>Disaster</strong> prevention etc in hazard assessment at micro<br />
level <strong>for</strong> pilot area. However, the hazard maps are not available at national or regional level. The<br />
present study will collate all existing in<strong>for</strong>mation and studies, and evolve the methodology at national<br />
level, supported by robust and well proved technical tools.<br />
1.5 PROJECT OBJECTIVE<br />
The objectives of the assignment are four-fold:<br />
• To develop a synthesis report on <strong>Nepal</strong>'s major hazard risks by carrying out a desk review of<br />
already available reports, studies, analyses and assessments regarding vulnerability and hazards<br />
carried out at the national and sub-national levels;<br />
• To present an overview of vulnerability assessment <strong>for</strong> the country; and<br />
• To develop detailed economic analysis using loss probability modeling of the country’s risks with<br />
projected economic losses from <strong>for</strong>ecasted hazards, and<br />
• To map high risk geographic regions<br />
16
<strong>Nepal</strong> <strong>Hazard</strong> <strong>Risk</strong> <strong>Assessment</strong><br />
1.6 SCOPE OF THE ASSIGNMENT<br />
The scope of the assignment will include, inter-alia, the following activities:<br />
• Collecting and analyzing data and existing reports of the historical losses due to catastrophic<br />
events. This should include the economic losses as well as the social impacts such as number of<br />
people affected;<br />
• Mapping the natural hazard risks <strong>for</strong> <strong>Nepal</strong> and detailing exposures to droughts, floods, landslides,<br />
earthquakes, and other hazards;<br />
• Analyzing and quantifying the projected losses in absence of mitigation investments;<br />
• Identifying possible in<strong>for</strong>mation gaps and outlining the need <strong>for</strong> further analytical, work to arrive at<br />
a comprehensive quantitative risk assessment <strong>for</strong> the country (which will allow decision makers to<br />
prioritize risk mitigation investments and measures to strengthen the emergency preparedness and<br />
response systems).<br />
1.7 STAKEHOLDER INVOLVE IN THE PROJECT<br />
The project will associate three types of stakeholders. These are study project team, focal institutions<br />
and beneficiary (other associated agencies, the World Bank, UNDP etc.)<br />
Study team includes technical staff members from <strong>Asia</strong>n <strong>Disaster</strong> Preparedness Center (ADPC),<br />
Norwegian Geotechnical Institute (NGI), Center <strong>for</strong> International Studies and Cooperation (CECI), and<br />
International Institute of Applied System Analysis (IIASA). Apart from these agencies, there will be<br />
team of national and international professional experts in economic modeling, seismic analysis,<br />
statistics, flood modeling.<br />
Ministry of Home Affairs will be the focal point <strong>for</strong> advice, direction and evaluation as per the defined<br />
terms and reference. The advisory committee has been <strong>for</strong>med including senior representation of<br />
Department of Water Induced <strong>Disaster</strong> Prevention, Department of Agriculture, Department of<br />
Hydrology and Meteorology, Department of Mines and Geology, Department of Health Services and<br />
National Planning Commission. The World Bank will be observer during the study period. ADPC will<br />
convene and facilitate the logistics as per the requirement.<br />
The project team has identified beneficiaries. The role of beneficiary stakeholders is to provide<br />
necessary data and in<strong>for</strong>mation <strong>for</strong> assessment of economic impact of respective sectors. This class of<br />
stakeholders includes United Nations Development program (UNDP), The International Centre <strong>for</strong><br />
Integrated Mountain Development (ICIMOD), Central Bureau of Statistics Ministry of Culture<br />
Tourism & Civil Aviation, Ministry of Education & Sports, Ministry of Finance, Ministry of Health<br />
and Population, Ministry of Agriculture and Cooperative, Ministry of Industry Commerce & Supplies,<br />
Ministry of In<strong>for</strong>mation & Communications, Ministry of Local Development, Ministry of Physical<br />
Planning & Works Department of Electricity Development, Ministry of Irrigation etc.<br />
1.8 METHODOLOGY<br />
The methodology primarily includes collection of baseline data, hazard and susceptibility assessment<br />
and mapping, exposure and vulnerability assessment, economic risk assessment wrt various national<br />
sectors. The end result of hazard and risk assessment will <strong>for</strong>m the genesis <strong>for</strong> national level disaster<br />
risk mitigation strategy. The details of the methodology may be referred in Figure 1.2<br />
1.9 PROJECT OUTCOMES<br />
The project outcomes include:<br />
• <strong>Hazard</strong> Scenario Development<br />
o <strong>Hazard</strong> Zonation maps (In appropriate scale) <strong>for</strong> Earthquake, Floods, Landslides,<br />
Epidemics and drought<br />
o Identification of most hazard prone areas<br />
o Analysis and interpretation of hazard assessment <strong>for</strong> various disasters<br />
• Vulnerability and Exposure <strong>Assessment</strong><br />
o GIS Maps showing elements at risk <strong>for</strong> various identified sectors<br />
o Synthesis report on vulnerability and exposure assessment<br />
• Detailed Economic Analysis though Loss Probability<br />
o Modeling of aggregate and sectoral economic losses and risks<br />
o Discussion of potential applications of economic loss assessment<br />
o Final Report on the detailed economic analysis that includes:<br />
• Economic loss analysis considering the indirect and macroeconomic impacts<br />
• Recommendations and/or options <strong>for</strong> <strong>Nepal</strong> <strong>for</strong> using the economic loss analysis<br />
<strong>for</strong> finally reducing disaster risk<br />
• The possible optimization of financial instruments to reduce risks<br />
• Development of the Final Report<br />
o Possible in<strong>for</strong>mation gaps <strong>for</strong> outlining the need <strong>for</strong> further analytical work to arrive at a<br />
comprehensive quantitative risk assessment <strong>for</strong> the country.<br />
o Recommendations <strong>for</strong> prioritizing the risk mitigation investments and measures to<br />
strengthen the emergency preparedness and response mechanisms to droughts, floods,<br />
landslides, earthquakes, and other types of hazards<br />
o Options <strong>for</strong> improvement of institutional measures (policy, legal and institutional<br />
development measures)<br />
17
<strong>Nepal</strong> <strong>Hazard</strong> <strong>Risk</strong> <strong>Assessment</strong><br />
Figure 1.2. <strong>Assessment</strong> Methodology<br />
18
<strong>Nepal</strong> <strong>Hazard</strong> <strong>Risk</strong> <strong>Assessment</strong><br />
2 BASELINE DATA AND INFORMATION<br />
2.1 NATURAL DISASTER PROFILE OF NEPAL<br />
Unstable steep slopes and fragile geological <strong>for</strong>mation of a young growing mountain range with heavy<br />
monsoon rainfall leads to wide range of geological and hydro-meteorological disasters across the<br />
country. <strong>Nepal</strong> is divided into three major region having mountains, hills and terai. Each region is<br />
distinct to it characteristics. The variation in geological characteristics together with torrential rain<br />
during rainy season result to landslides, debris flows, floods, and earthquakes. Apart from these<br />
disasters, there are several other manmade disasters reported in the country. After instatement of peace<br />
process in the country, <strong>Nepal</strong> is leading to the progressive development. In this juncture, there is a dire<br />
need to understand the characteristics of existing hazards and establish national disaster risk<br />
management plan <strong>for</strong> sustained development.<br />
2.1.1 EARTHQUAKE HAZARDS<br />
<strong>Nepal</strong> is having long history of earthquake activities due to its location on a tectonic active zone. The<br />
presence of three main fault lines (ICIMOD, 2007): the main central thrust (MCT) at the foot of the<br />
greater Himalaya joining the midland mountains, the main boundary fault (MBF) at the junction of the<br />
lesser Himalaya, and the Siwalik and the Himalaya frontal Fault south of the Siwalik, each running east<br />
to west, are causes of earthquakes of small and greater magnitude in <strong>Nepal</strong>. These fault lines are result of<br />
the movement of the Indian plate under the Eurasian Plate.<br />
Several Major earthquakes were reported in 1255 AD, 1810 AD, 1866 AD, 1934AD, 1980 AD and 1988<br />
AD in <strong>Nepal</strong>. The 1934 earthquake largely impacted the Kathmandu city resulted in more than 8500<br />
deaths. More than 38,000 collapsed buildings. This earthquake was well reported by several scholars.<br />
One of the detailed studies may be referred in Field Memoir published by Geological Survey of India<br />
(Jain, 1998).<br />
2.1.2 RIVERINE AND FLASH FLOODS<br />
Rainfall during the monsoon season is caused by the influence of both the south-east and south-west<br />
Monsoon, characterized by intense rainfall during the four months from June to September, contributing<br />
to 80% of the rainfall. During the monsoon, rivers originating from the Mahabharat range; viz., the<br />
Kankai, Kamal, Bangmati, West Rapti and Babai causes greater damage in floodplains of Terai region.<br />
Riverine floods from the major perennial rivers generally rise slowly in the southern Terai plains.<br />
Inundations of large areas are due to overflowing river banks resulting in extensive damage to life and<br />
properties.<br />
debris, ice, or snow. Water flow in the rivers in the Siwalik range in southern <strong>Nepal</strong> are characterised by<br />
a sharp rise of flood water followed by a rapid recession, often causing high flow velocities, resulting in<br />
damage crops, property, lives, and livelihoods. Damming of a river by a landslide is a potentially<br />
dangerous situation. Such a blockage of the river flow is more common in narrow valleys where the<br />
slopes are steep on both sides of the river. Landslide dams will eventually collapse, causing heavy<br />
downstream flooding resulting in loss of life and property.<br />
Glacial lakes are common in the high altitude areas of the country. These lakes often contain huge<br />
volume of water. The lakes are dammed behind moraine ridges which are stable depending on the<br />
amount of ice within these ridges; and their unstable condition may lead to a breakage of the same,<br />
creating a Glacial Lake Outburst Flood (GLOF) with the potential to cause great damage downstream.<br />
Altogether 2,315 glacial lakes have been identified in <strong>Nepal</strong> and about 14 GLOFs recorded to have<br />
occurred between 1935 and 1991 in <strong>Nepal</strong> (ICIMOD, 2007). In total, 20 glacial lakes have been<br />
identified as being potentially dangerous at present.<br />
2.1.3 DROUGHT<br />
<strong>Nepal</strong> is experiencing a rapidly worsening drought, caused by erratic rainfall in summer and an almost<br />
total lack of rainfall during winter. Some studies of past drought suggest that unusual events were<br />
randomly found in the country’s historical records. During present decade almost each year, at least few<br />
parts of the country experience either a short or long dry period even within the wet season (DHM,<br />
2001-2009). As <strong>for</strong> example: western Half of the country influenced by dry spell till the end of July<br />
while the eastern half was havocked by floods in 2002 (DHM, 2001-2009). Similarly, Southern plains of<br />
Far and Mid western regions recorded almost 75% of the normal rainfall while the eastern Tarai<br />
experienced dry spell followed by heavy rainfall in July in 2004 (DHM, 2001-2009). During severe dry<br />
winter in 2006, the country received less than 25% of the normal winter rain, affecting winter crops<br />
(DHM, 2001-2009). In the same year, monsoon was also weak. June, July and August remained dry,<br />
except flooding in July in the mid and Far Western regions. Eastern regions experienced drought and<br />
western regions were affected by floods, both of these events affect the agricultural production. Nine<br />
districts of the Terai (Southern plains) region were declared as dry regions <strong>for</strong> the first time in <strong>Nepal</strong>.<br />
After 2006, 2009 winter is another driest winter in <strong>Nepal</strong>. Only a few spells of isolated rainfall was<br />
recorded in the western parts in February and in the mountainous regions in December (DHM, 2009).<br />
The study on drought in time and space is most essential. It is also important to study the probability of<br />
having a consecutive dry period during the growing season of a crop. In spite of several technical<br />
constrains, early warning and drought monitoring system in <strong>Nepal</strong> is urgent need due to the wake of<br />
recent global warming and resulting climatic changes. The present study on drought in <strong>Nepal</strong> is the first<br />
attempt to analyze the drought in detail by using standardized precipitation and soil moisture indices.<br />
Flash floods (ICIMOD, 2007) are severe floods that occur with little or no warning. They are<br />
characterized by little time lapse between the start of the flood and peak discharge. Flash floods are<br />
dangerous because of the suddenness and speed with which they occur. They are triggered by extreme<br />
rainfall, glacial lake outbursts, or the failure of dams – whether man-made or caused by landslides,<br />
19
<strong>Nepal</strong> <strong>Hazard</strong> <strong>Risk</strong> <strong>Assessment</strong><br />
2.1.4 LANDSLIDES<br />
ICMOD 1996 has published landslide studies and management in <strong>Nepal</strong>. The publication provides<br />
evidence of severs landslide in the country. In 1953, at least five earthquakes rocked Far-western <strong>Nepal</strong>.<br />
The epicentres were located either in <strong>Nepal</strong> or the adjoining Indian Himalayas. Most of the secondary<br />
epicentres were near the Main Boundary Thrust or in the Indo-Gangetic Plain. Also in the same volume<br />
it was reported that a landslide dam was <strong>for</strong>med at Labu Besi, Central <strong>Nepal</strong>, on August 1 1968, and it<br />
blocked the entire Budhi Gandaki River and created a 60m deep lake <strong>for</strong> 29 hours. After the breaching of<br />
the dam, the debris flow and flood washed away most of the houses and bridges in the low lying areas<br />
the earthquake of 1969 in Far-western <strong>Nepal</strong> which took a heavy toll of life and property in the Bajhang<br />
area. The dam on the Pardi Khola, at the southern end of Phewa Lake, Pokhara, collapsed in 1970 owing<br />
to severed piping on the right abutment (Sharma, 1981). The Tansen area of Western <strong>Nepal</strong> suffered<br />
from heavy rainfall in 1971. The rainfall measured 450mm in 24 hours (Sharma 1981) and the Tinau<br />
Khola flood washed away Khaseuli (Butwal) Bazaar. In 1975, a part of Tahamalla Tolof Bhaktapur<br />
municipality was damaged by slumping. In the same year, several houses in Humat Toi, Kathmandu,<br />
which were built on soft soil the solid waste of the city, were also destroyed or damaged by slumps. On<br />
the morning of June 5, 1976, a huge landslide occurred in Bhagabati Tar Panchayat of Kaski district in<br />
Western <strong>Nepal</strong>, burying the entire village and killing about 75 people. The slide occurred after 50mm of<br />
rainfall.<br />
The Department of Mines and Geology has compiled landslide catalog, however due to paucity of<br />
resources, dataset is restricted to smaller region.<br />
2.1.5 EPIDEMICS<br />
<strong>Nepal</strong> is prone to wide range of outbreaks and diseases. Several deaths have been reported due to water,<br />
vector and infection bond diseases. Few of the frequently reported diseases are Diarrhea, Kalazaar,<br />
Chickenpox, Hepatitis, Influenza, Typhoid, Acute Respiratory Infection, Malaria, Sexual Transmitted<br />
Infection, Tuberculosis, and Leprosy. The reports are available from various database sources. Official<br />
data is available with Department of Health Service (EHA, 2007). Apart from this, DesInventar<br />
(DesInventar) has also compiled data <strong>for</strong> epidemics <strong>for</strong> more than two decades. The root cause <strong>for</strong> water<br />
and vector bond diseases are linked to existing socio-economic condition, hygiene and health<br />
infrastructure. There is a cross linkage of these diseases with floods and other hydro-meteorological<br />
conditions.<br />
Apart from above stated five major hydro meteorological, geographical and health hazards. the country<br />
in also susceptible to other hazards like GLOF, <strong>for</strong>est fire, Thunder lighting, hailstorm, high wind, heavy<br />
metal in ground water, fire and terrorism. If these hazards are analyzed with respect to exposure of<br />
human life, economic & physical sector, more losses are attributed due to earthquake, flood landslide,<br />
drought and health hazard. This project is scoping only five main hazards <strong>for</strong> future study.<br />
2.2 TREND ANALYSIS OF DISASTERS<br />
<strong>Nepal</strong> is prone to several classes of hazards ranging from hydro-meteorological, geological, biological,<br />
industrial and accident related disasters. Several disasters have been reported in past. In view of<br />
youngest mountain, Himalaya, the region is hotspot <strong>for</strong> geological <strong>for</strong>mation and activities. This leads to<br />
frequent large earthquakes, landslide, floods and other collateral hazards. Apart from these activities, the<br />
country is prone to cloud burst, hailstorm, high winds and heat strokes in central and Terai Region. The<br />
climate change has accelerated the frequency of hazards occurrence. Table 2.1 shows the severity of<br />
hazards and impacts. Ministry of Home Affairs (MOHA, 2004) has compiled the hazard profile of<br />
<strong>Nepal</strong>. This comprehensive compilation records are existing <strong>for</strong> more than a decade.<br />
Figure 2.1 shows the trend line <strong>for</strong> disasters in <strong>Nepal</strong>. As per MOHA report, the disasters are broadly<br />
categorized into various types including Floods, landslide, earthquake, hailstorm, Thunder bolt, wind<br />
storm, fire and epidemic. The disasters have significantly contributed <strong>for</strong> loss of human, livestock and<br />
economic losses.<br />
Table 2.1. Profile of impact of various hazards in <strong>Nepal</strong> (Source: (CRED, 2009))<br />
<strong>Disaster</strong> Type<br />
Drought<br />
Earthquake (seismic<br />
activity)<br />
Epidemic<br />
Extreme temperature<br />
Flood<br />
Mass movement dry<br />
Mass movement w et<br />
Storm<br />
Wildfire<br />
Unit<br />
# of<br />
Dam age<br />
Killed Total Affected<br />
Eve nts<br />
(000 US$)<br />
Drought 5 - 4600000 10000<br />
Ave. per event - 920000 2000<br />
Earthquake (ground shaking) 5 9929 562001 306000<br />
Ave. per event 1985.8 112400.2 61200<br />
Unspecified 3 685 50242 -<br />
Ave. per event 228.3 16747.3 -<br />
Bacterial Infectious Diseases 4 1501 50640 -<br />
Ave. per event 375.3 12660 -<br />
Viral Infectious Diseases 10 1995 9669 -<br />
Ave. per event 199.5 966.9 -<br />
Cold w ave 2 108 200 -<br />
Ave. per event 54 100 -<br />
Heat w ave 1 - 10 -<br />
Ave. per event - 10 -<br />
Unspecified 13 1729 781907 766313<br />
Ave. per event 133 60146.7 58947.2<br />
Flash flood 4 2566 714650 200000<br />
Ave. per event 641.5 178662.5 50000<br />
General flood 15 1517 1817146 10929<br />
Ave. per event 101.1 121143.1 728.6<br />
Landslide 1 150 - -<br />
Ave. per event 150 - -<br />
Avalanche 1 95 - -<br />
Ave. per event 95 - -<br />
Debris flow 1 106 - -<br />
Ave. per event 106 - -<br />
Landslide 13 1377 442618 -<br />
Ave. per event 105.9 34047.5 -<br />
Unspecified 4 27 184 3600<br />
Ave. per event 6.8 46 900<br />
Local storm 2 70 - -<br />
Ave. per event 35 - -<br />
Forest fire 2 88 54000 6200<br />
Ave. per event 44 27000 3100<br />
20
<strong>Nepal</strong> <strong>Hazard</strong> <strong>Risk</strong> <strong>Assessment</strong><br />
The trend line shows that flood, landslide and health hazards are consistent threat to human life in <strong>Nepal</strong>.<br />
The casualty rate <strong>for</strong> these hazards is consistent over the decade. The analysis shows that about 750<br />
people are killed every year due to these hazards. There is a need <strong>for</strong> initiating major steps <strong>for</strong> reducing<br />
the impacts through suitable mitigating measures.<br />
Fire, windstorms, hailstorm, thunderbolts come next in severity level. Casualty rate is less than 100<br />
people every year.<br />
Earthquake hazard has occurred in 1934 and 1988, caused wide devastation in Terai and central region.<br />
The small swarms are constantly occurring in Indo-<strong>Nepal</strong> boundaries. The earthquake of 1255 A.D. had<br />
destroy many houses and temples and killing one third to one fourth population of the Kathmandu<br />
Valley (NSC, 2009). The assigned intensity is X in MM scale (GR Chitrakar, 1986). The earthquake of<br />
1408 A.D. has been reported to destroy the Machhendra Nath temple of Patan. Similarly the earthquake<br />
of 1681 A.D. and 1810 A.D. have been reported to occur but the exact locations of these earthquakes are<br />
not known. Recent research on historical data has well constrained on the source size, magnitude and<br />
possible location of 1833 A.D. event (Bilham, 1995) which devastated Kathmandu valley. Its magnitude<br />
is reported to be of Mb=7.8 with possible rupture length of more than 70 km and the event is located at<br />
50 km North - North East of Kathmandu. The human casualties reported were less than 500, which may<br />
be due to occurrence of two large <strong>for</strong>eshocks. The earthquake of 1934 A.D is the most devastating<br />
earthquake ever occurred in the territory of <strong>Nepal</strong> with casualties of more than 16000 people including<br />
<strong>Nepal</strong> and India. The rupture length is estimated to be 200 Km ± 100 Km (Molnar and Pandey, 1994).<br />
Great Assam earthquake of 1897, Kangra earthquake 1905, and Assam earthquake 1950 were felt in<br />
<strong>Nepal</strong>. The record of historical earthquake is not complete which poses a problem in assessing the<br />
recurrence period of great earthquakes.<br />
Loss of Life<br />
10000<br />
1000<br />
100<br />
10<br />
Figure 2.1. Trend line showing annual occurrence of various disasters in <strong>Nepal</strong> (Based on <strong>Disaster</strong> Catalog developed by Ministry of Home Affairs,<br />
GON)<br />
2.3 SOURCE OF PROJECT RELATED DATA<br />
Chronology of <strong>Disaster</strong> Events In <strong>Nepal</strong> (1983-2003)<br />
Trendline <strong>for</strong> Annual Occurance<br />
Flood & Landslides Fire Epidemics windstorms/hailstorms/thunderbolts Earthquake Avalanches stampede<br />
Fire<br />
Earthquake<br />
Stampede<br />
Windstorms/ Hailstorms/ Thunderbolts<br />
Avalanches<br />
Floods & Landslides<br />
Epidemics<br />
1<br />
1982 1983 1984 1985 1986 1987 1988 1989 1990 1991 1992 1993 1994 1995 1996 1997 1998 1999 2000 2001 2002 2003 2004<br />
Year<br />
There are several authentic national and international sources, from where data related to hazard,<br />
vulnerability and risk assessment were extracted. At national level, disaster event catalog is<br />
comprehensively compiled by Ministry of Home Affairs, Government of <strong>Nepal</strong>. The catalog has been<br />
developed in 2000 and updated every year (MOHA, 2004). The catalog broadly covers fire, floods,<br />
landslides, thunderbolt, hailstorm, windstorm, epidemics and earthquakes. The each event has been<br />
detailed out with location of disaster event including district, VDC/ Village, date, people (injured/dead),<br />
affected families, animal losses, houses and shed destroyed, public property losses and gross estimated<br />
losses.<br />
DesInventar is a conceptual and methodological tool <strong>for</strong> the implementation of National <strong>Disaster</strong><br />
Observatories and the construction of database of damage, losses and in general the effects of disasters.<br />
It includes Data Collection Methodology, Data Analysis Methodology, database with flexible structure<br />
and Free, open-source software to manage the system, including multi-user, remote data entry and data<br />
querying, reporting and analysis. The DesInventar has been implemented in <strong>Nepal</strong> and created a huge<br />
database of disaster events and associated losses. It includes event, region, district, village, Date, Cause,<br />
Description of Cause, Source, Magnitude, Deaths, Injured, Missing, Houses Destroyed, Houses<br />
Damaged, Victims, Affected Relocated, Evacuated, Losses ($USD), Losses ($Local), Damages at crops<br />
21
<strong>Nepal</strong> <strong>Hazard</strong> <strong>Risk</strong> <strong>Assessment</strong><br />
in hectare, Lost Catle and Damages of roads (Mts). The data is mostly collected from newspapers<br />
namely Gorakhapatra or other reputed newspapers. The DesInventar covers largely earthquake, floods,<br />
landslides, drought, and epidemics events.<br />
Apart from these sources, data is also available with several national reputed institutions, departments<br />
and ministries. The brief in<strong>for</strong>mation about the data availability may be referred at Table 2.2.<br />
At international level, Centre <strong>for</strong> Research on the Epidemiology of <strong>Disaster</strong>s (CRED, 2009) has<br />
developed comprehensive database <strong>for</strong> disaster events and associated losses. EM-DAT contains essential<br />
core data on the occurrence and effects of over 16,000 mass disasters in the world from 1900 to present.<br />
The database is compiled from various sources, including UN agencies, non-governmental<br />
organizations, insurance companies, research institutes and press agencies. EM-DAT distinguishes two<br />
generic categories <strong>for</strong> disasters (natural and technological), the natural disaster category being divided<br />
into 5 sub-groups, which in turn cover 12 disaster types and more than 30 sub-types. There are several<br />
international organizations Viz., United States Geological Survey (USGS), ANSS, Berkeley University<br />
are maintaining the earthquake catalog globally.<br />
Table 2.2. Source of in<strong>for</strong>mation.<br />
No Name of Organization Type of Data<br />
1 Department of Hydrology & Meteorology Climate and meteorological data, rainfall in<strong>for</strong>mation, spatial temperature distribution,Early<br />
warning communication systems,<br />
2 Ministry of Forest and Soil Conservation Forest cover, Soil maps<br />
3 Ministry of Home Affairs<br />
<strong>Disaster</strong> data on various hazard,<br />
economic losses<br />
4 Department of Geology and Mines<br />
Geological map of <strong>Nepal</strong> ( scale 1:50,000), Geographical Map, Seismo-tectonic map<br />
Active fault and lineament mapping, Cross sectional profile of <strong>Nepal</strong> , PGA distribution<br />
Seismic zoning, Soil profile of <strong>Nepal</strong>, Earthquake catalogue(Micro tremor / Major Events<br />
Historical events and associated intensity mapping , Seismograph network,, Study on Seismic<br />
hazards and collateral hazards, Bed rock motion studies <strong>for</strong> <strong>Nepal</strong>, JICA report,<br />
5 Department of Water induced <strong>Disaster</strong> Prevention Details of hydrological parameters, rainfall details, Floods details of main catchments<br />
6 Department of Agriculture Crop typology, drought events, crops affected by floods and droughts<br />
7 United Nations Development program (UNDP) Initiatives <strong>for</strong> <strong>Disaster</strong> risk reduction<br />
8 The International Centre <strong>for</strong> Integrated Mountain Flood, GLOF and landslide studies and maps<br />
Development ICIMOD<br />
9 Central Bureau of Statistics Census 2001 dataset<br />
10 Ministry of Culture Tourism & Civil Aviation Details of aviation sector, Tourism assets<br />
11 Ministry of Education & Sports Education units and associated database<br />
12 Ministry of Finance Economic parameters <strong>for</strong> development and disasters<br />
13 Ministry of Health and Population Epidemic data , Health Infrastructure<br />
14 Ministry of Agriculture and Cooperative Crop Pattern, production yield,<br />
15 Ministry of Industry Commerce & Supplies Industrial Infrastructure, products, industrial locations<br />
16 Ministry of In<strong>for</strong>mation & Communications Telecommunication, television, radio Infrastructure<br />
17 Ministry of Local Development Local government Infrastructure<br />
18 Ministry of Physical Planning & Works Community , government built infrastructure , roads database<br />
19 Department of Electricity Development Power infrastructure<br />
20 Ministry of Irrigation Irrigation Infrastructure database<br />
No Name of Organization Type of Data<br />
21 The Survey Department / Ministry of Land Re<strong>for</strong>m<br />
and Management<br />
Survey Department has a broad multi-disciplinary resource base and produces a wide range<br />
of ground survey, aerial photography, photogrammetry, geo-in<strong>for</strong>mation and cadastral map<br />
products and services in order to support multi-sectoral development activities.<br />
At 1:100,000 Scale, the attributes and features are as below:<br />
Details of Layers : Admin Boundary /Transport /Building /Hydrography /Contour /Designated<br />
area /Untility lines, Attributes details :<br />
Functional use: but terminal/ commercial/ customs/ factory / fire stations/ health posts/<br />
hospitals/ industrial/ petrol pumps/ post office/ power stations/ railway st/ residence/<br />
ropeways/ schools/ telephone office/ trans<strong>for</strong>mer st/ monuments/ chimney/ mining<br />
Religious building : Temple/ stupa/ mane/ church/ moque/ cemetery/ crematorium<br />
Structure type: Cave/ chimney/ gate/ mining site/ open shed/ revetment/ ruins/ view towers/<br />
wall<br />
Contour : contour value<br />
Spot elevation<br />
Administration area: country/ region/ zone/ district / municipality / VDC<br />
Designated area: national parks/ wild life reserve/ sanctuary / conservation area/ reserved<br />
<strong>for</strong>est<br />
Feature Class<br />
Transportation : Roads : Highway/ feeder road/ district road/ other roads / Trails and tracks :<br />
Cart track / Railways /Ropeways/Bridge /Other crossings/Tunnel/Airport / Buildings<br />
Built up area/Buildings/Religious /Other structures<br />
Landcover : Cultivation /Vegetation/Others /Hydrography<br />
River/ streams/Glaciers /Canals/Ponds / lakes<br />
Utility : Electricity /Telephone/Telegraph/Transmission/Tower /Pipe Line/Water<br />
Line/Sewerage Line<br />
22
<strong>Nepal</strong> <strong>Hazard</strong> <strong>Risk</strong> <strong>Assessment</strong><br />
2.4 ADMINISTRATIVE BOUNDARIES<br />
2.4.1 NEPAL GEOGRAPHICAL DEVELOPMENT REGION (GEO-DEVELOPMENT REGION)<br />
Administratively, <strong>Nepal</strong> is divided into seventy-five district grouped into five development regions<br />
which includes Far western, Mid-western, Western, Central and Eastern regions. Geographically, the<br />
country is divided into three regions – a mountain region, a hill region and a plain region (Terai) – which<br />
run parallel from east to west with the high mountains along the northern border and the Terai to the<br />
south. Thus whole country is divided into 15 zone of Geo-Development Regions which is shown in<br />
Figure 2.2. Table within the figure shows the details of development and geographical region with<br />
number of VDCs in each district. The table 2.3 shows the details of districts and number of VDCs in<br />
each Geo-Development Regions.<br />
2.4.2 VDC (VILLAGE DEVELOPMENT COMMITEES) MAP<br />
The districts are further divided into village development committees (VDCs) and municipalities.<br />
Currently, there are 3915 VDCs and 58 municipalities in the country (ICIMOD and CBS, 2003b). The<br />
location of VDCs may be referred at Figure 2.3. Blue color in the figure showed municipality zones.<br />
Figure 2.3. National Map showing VDCs in each district (source <strong>for</strong> VDC boundary: (DOS, 2001))<br />
Figure 2.2. Geo-development Zones of <strong>Nepal</strong>(Source: (DOS, 2001))<br />
23
<strong>Nepal</strong> <strong>Hazard</strong> <strong>Risk</strong> <strong>Assessment</strong><br />
2.5 LAND COVER / LAND USE<br />
2.5.1 CLASSIFICATION OF LAND COVER<br />
Department of Survey, Government of <strong>Nepal</strong> (DOS, 2001) has classification land cover into 15<br />
categories which may be referred at table in Figure 2.4 which includes coverage of <strong>for</strong>est, cultivation,<br />
barren land, and bush in overall region. Forest covers nearly 40% of the country, followed by cultivation<br />
area especially in south. High mountainous area <strong>for</strong>ms barren land and bush in northern part of country.<br />
2.5.2 LAND COVER DISTRIBUTION<br />
Cultivation areas (orange color in map Figure 2.4) are located typically in low floodplain of Terai area,<br />
especially in eastern and central part of <strong>Nepal</strong>. This shows that eastern and central areas are more<br />
developed compared to their western counterparts. In accordance, this cultivation area is more<br />
vulnerable to disaster due to its concentration in low level floodplain that can be easily flooded.<br />
Plantation also suitably developed in Terai region where human habitation is moderate to highly<br />
concentrated and located in low level area. There<strong>for</strong>e eastern and central parts are more suitable <strong>for</strong><br />
cultivation and human habitation while western and northern parts are suitable <strong>for</strong> <strong>for</strong>estry and<br />
conservation.<br />
Forests are dominant feature of land cover in <strong>Nepal</strong>, especially in far west and Midwest regions. Barren<br />
lands are dominant in Mountain Midwest zone and overall mountain belt in <strong>Nepal</strong>. Bush zone is<br />
developed around <strong>for</strong>est and barren land area, particularly in northern region. These <strong>for</strong>estry, bush and<br />
barren land showed relatively unpopulated area of <strong>Nepal</strong> which pose lower risk zone <strong>for</strong> overall type of<br />
hazard.<br />
Figure 2.4. Major sectors landcover distribution. (Source: (DOS, 2001)).<br />
24
<strong>Nepal</strong> <strong>Hazard</strong> <strong>Risk</strong> <strong>Assessment</strong><br />
2.7 HEALTH INFRASTRUCTURE<br />
2.7.1 CLASSES OF HEALTH INFRASTRUCTURE<br />
The Ministry of Health is the nodal agency <strong>for</strong> maintaining health infrastructure in the country. The<br />
analysis of health infrastructure in this report is exclusive health institutions which are managed and<br />
maintained by Ministry of Health. This covers large spectrum of health services including hospitals,<br />
primary health centres (PHC)/ health centres (HC), health posts (HP), and sub-health posts (SHP).<br />
2.7.2 NUMBER OF HEALTH INFRASTRUCTURE<br />
Figure 2.6 shows the map stating number of Health institution in each district. Septari, Siraha, Dhanusa<br />
and Sarlahi have the highest number of health institution more than 100 in numbers. The lowest is<br />
Manang having 14 Health institutions.<br />
2.7.3 DENSITY MAPS WITH NUMBER OF HEALTH INFRASTRUCTURE<br />
The population per health institution (PHI) (ICIMOD and CBS, 2003b) is defined as the ratio of the<br />
number of persons to the number of health institutions. It is one of the indicators measuring the<br />
distribution pattern of health services in relation to the size of population in the country. The data on<br />
health institutions hospitals, primary health centres (PHC), health centres (HC), health posts (HP), and<br />
sub-health posts were obtained from the Department of Health Services <strong>for</strong> the fiscal year 2000/2001<br />
(from second half July 2000 to first half July, 2001). Since the census enumeration was also conducted<br />
in mid June of 2001, these two different data sets can be used together to compute the indicator.<br />
The (estimated) population per (government) health institution over the country as a whole was 5,663;<br />
district-wise it varied from 685 (Manang) to 17,177 (Kanchanpur). The value of the ratio was below the<br />
national average in 50 districts and above in 25 districts. The population pressure on health infrastructure<br />
is higher in Terai and hill region than mountain region. Figure 2.7 shows the number of health institute<br />
and population per institution.<br />
Figure 2.6. Map showing number of health institutions in districts (Source:(ICIMOD and CBS, 2003b))<br />
Figure 2.7. Map showing Number of health institutions and population per institution (Source:(ICIMOD and CBS, 2003b))<br />
26
<strong>Nepal</strong> <strong>Hazard</strong> <strong>Risk</strong> <strong>Assessment</strong><br />
2.8 EDUCATION SECTOR<br />
2.8.1 TYPE OF EDUCATION INSTITUTIONS<br />
The educational sector (ICIMOD and CBS, 2003b) in <strong>Nepal</strong> consists broadly of primary, lower<br />
secondary, secondary, and higher education school system (beyond School Leaving Certificate or SLC).<br />
The total literate population is classified into five categories of successfully completed level of<br />
education: primary (grades 1 to 5); lower secondary and secondary (grades 6 to 10); SLC and equivalent;<br />
certificate and above; ‘no schooling’ (includes literate persons with non-<strong>for</strong>mal education) and ‘other’<br />
level includes literate persons completing an education level other than mentioned above, but not<br />
including those who did not state their level attainment.<br />
Table 2.4. Number of School per thousand people of <strong>Nepal</strong> (source: (ICIMOD and CBS, 2003b))<br />
The Department of Education (reference) is the main source of in<strong>for</strong>mation on the school system and the<br />
development of education. The Department has compiled lists the schools in year 2000 (primary, lower<br />
secondary, and secondary, both government and private) which amount to 37,566. District-wise the total<br />
number of schools varied from 45 in Manang (0.12% of all schools) to 2014 in Kathmandu (5.36%).<br />
Figure 2.8 shows the map indicating number of schools in each district The map above indicates that<br />
central development region has higher of number of school than others regions.<br />
Figure 2.8. Number of school (source: (ICIMOD and CBS, 2003b))<br />
2.8.2 EDUCATION DISTRIBUTION<br />
The ratio of the total number of schools (ICIMOD and CBS, 2003b) to the total population (expressed<br />
per thousand capita) shows the distribution of schools with respect to the population. Data on the number<br />
of schools <strong>for</strong> each district was obtained from the Dept. of Education which was compiled in 2000, and<br />
the population <strong>for</strong> that year was estimated based on data from the 2001 census. On average 1.66 schools<br />
were available <strong>for</strong> every thousand persons in the country; district-wise the ratio ranged from 6.85<br />
(Manang) to 0.67 (Mahottari). Fifty-two districts had ratios above national average, and 23 districts<br />
ratios below, the national figure.The map above indicates that Dolpa, Mustang and Manang districts<br />
have a highest school density per 1000 population. These districts have high density because of the low<br />
population. Figure 2.9 shows type of schools in the country.<br />
27
<strong>Nepal</strong> <strong>Hazard</strong> <strong>Risk</strong> <strong>Assessment</strong><br />
2.9 FISHERY SECTOR<br />
Being a landlocked country, it has only freshwater fisheries covering an area of 745,000 hectares<br />
(Sharma, 2008) which are (5% of the total area) that includes rivers, lakes, ponds, wetlands, reservoirs,<br />
and irrigated rice fields. It has a diverse fish species totaling 200 fish species, of which 191 are<br />
indigenous and nine exotic. Thirty-four fish species were categorized as threatened (IUCN categories),<br />
requiring due attention <strong>for</strong> the conservation. Fish harvests are mainly based on the subsistence fish<br />
farming, and from capture fisheries. National fish production in the year 2000/01 was 33,270 metric<br />
tons. Lowland areas are most suitable <strong>for</strong> aquaculture, whereas hill streams have a great attraction <strong>for</strong><br />
sport fishing. In <strong>Nepal</strong>, some of the major fish habitats are in protected conservation areas, e.g., national<br />
parks and world heritage sites. However, proper consideration has not been given <strong>for</strong> fish production.<br />
Figure 2.10 shows more fish production in the Terai region. Eastern Terai is producing more than<br />
Western Terai region<br />
Figure 2.10. Fishery in <strong>Nepal</strong><br />
Figure 2.9. School type distribution (source: (ICIMOD and CBS, 2003b))<br />
28
<strong>Nepal</strong> <strong>Hazard</strong> <strong>Risk</strong> <strong>Assessment</strong><br />
2.10 IRRIGATION INFRASTRUCTURE SECTOR<br />
Department of Irrigation (CERD, 2007) has classified types of irrigation into three categories, i.e.<br />
Surface irrigation, Ground water and non conventional irrigation. Application of type of irrigation<br />
depends upon geographical location.<br />
2.10.1 SURFACE IRRIGATION<br />
The surface irrigation broadly covers Department of Irrigation (DoI) and Farmer Management Irrigation<br />
System (FMIS). Most of the farwestern and mid-wastern regions are covered under FMIS. Central and<br />
eastern part of <strong>Nepal</strong> is mostly covered by FMIS. However in Terai region, stretching from west to east,<br />
both type of irrigation system exists. Figure 2.11, the map shows the proportion of surface irrigation area<br />
in pie chart. The background show total area of surface irrigation in each district.<br />
2.10.2 GROUND WATER IRRIGATION<br />
Ground water irrigation includes deep and shallow tubewell systems. Figure 2.11 shows the irrigation<br />
area in each zone covering Shallow Tubewell (STW) and Deep Tubewell (DTW) units per square<br />
hectare. Figure 2.12 indicates that mostly ground water irrigation is belonging to Shallow tube well. The<br />
density of Ground water irrigation is very high in Terai area. The reason <strong>for</strong> high density is due to high<br />
water body density in Terai region. Deep Tubewell irrigation is mostly found in eastern, central and<br />
farwest region. Mostly this irrigation is negligible in mountain and hill regions.<br />
Figure 2.12. Distribution of ground water irrigation system in the country (source: (CERD, 2007))<br />
Figure 2.11. Map showing distribution of DoI and FMIS surface irrigation system (source: (CERD, 2007))<br />
29
<strong>Nepal</strong> <strong>Hazard</strong> <strong>Risk</strong> <strong>Assessment</strong><br />
2.10.3 NON-CONVENTIONAL IRRIGATION (NCI)<br />
NCI (MoI, 2009) can be defined as any irrigation schemes which are different from conventional<br />
irrigation system. NCI system includes Drip, Sprinkler, Treadle Pump, Low cost water storage (Thai<br />
jars, soil-cement tanks), Rain water harvesting chiefly <strong>for</strong> irrigation etc.<br />
Most of the non-conventional irrigation area is located in Eastern Terai and Eastern Hill Region. The<br />
highest non-conventional irrigation area is Tanahu covering 3643 ha of area. The summary of non<br />
conventional irrigation system is presented in Figure 2.13.<br />
2.10.4 MAP OF IRRIGATION AREA<br />
Figure 2.14 shows overall distribution of irrigated areas in the country. Due to tough and rugged terrain,<br />
the irrigation coverage in hill and mountain areas is comparatively lesser than terai areas. The map above<br />
indicated that most of the irrigation area is located in the Eastern Terai region. Far-Western Mountain<br />
and Far-Western Hill regions have a very small irrigation area.<br />
Figure 2.14. Distribution of irrigation area in the country (source: (CERD, 2007))<br />
Figure 2.13. Districution of non-converntional irrigation system in the country (source: (CERD, 2007))<br />
30
<strong>Nepal</strong> <strong>Hazard</strong> <strong>Risk</strong> <strong>Assessment</strong><br />
2.11 AGRICULTURE SECTOR<br />
Agriculture is one of the most important sectors of the country. This is one of the most GDP contributing<br />
sectors and renders livelihood to large sector of society. Current floods and drought situation has<br />
reflected in food insecurity in the country. Figure 2.15 shows North western part of the country is having<br />
least agriculture due to mountainous terrain. The terai and part of hills are considered as bowl of food <strong>for</strong><br />
<strong>Nepal</strong>. South and central part of the country feeds the whole country. These zones are having high<br />
density of river network and always prone to floods and drought. The Figure 2.16 shows the production<br />
of various crops in the country.<br />
Figure 2.15. Distribution of Agriculture land in <strong>Nepal</strong><br />
Figure 2.16. Agriculture Production (source: (ICIMOD and CBS, 2003b))<br />
31
<strong>Nepal</strong> <strong>Hazard</strong> <strong>Risk</strong> <strong>Assessment</strong><br />
2.12 TRANSPORTATION SECTOR<br />
2.12.1 TYPE OF TRANSPORTATION<br />
Several transportation infrastructures exist in <strong>Nepal</strong>. The most prevalent features are classified as cart<br />
track, and main trail (DOS, 2001). Road highway mostly developed in Terai area with low leveled<br />
terrain condition and reached more than 2,500 km in total length (Figure 2.17).<br />
2.12.2 ROAD<br />
An average road density in <strong>Nepal</strong> is less than 18.22 km/100 sq km with frequency nearly 50%, which<br />
can be seen in Figure 2.18. Generally roads are more developed in Terai region. Mountainous zone are<br />
relatively undeveloped due to extreme roughness. Main trails, and cart track are prevalent observed in<br />
mountainous zone.<br />
Figure 2.17. Road length in country (source: (DOS, 2001))<br />
Figure 2.18. Road Density (source: (ICIMOD and CBS, 2003a))<br />
32
<strong>Nepal</strong> <strong>Hazard</strong> <strong>Risk</strong> <strong>Assessment</strong><br />
2.13 INDUSTRY SECTOR<br />
Department of Industry (DOI) has classified industries into major seven categories including Agrobased,<br />
Construction, Energy based, manufacturing, mineral service and Tourism. Department of Industry<br />
(DOI, 2008) has published the report on statistics in 2007-2008.<br />
In industrial sector, mostly economic contribution is due to manufacturing, service and tourism sectors.<br />
Till 2007-08, more than 1200 small scale, more than 200 medium scale and more than 100 large scale<br />
industries are registered under department of industry. Figure 2.19 shows number of industries under<br />
small, medium and large scale categories. It also shows the asset value contribution due to various<br />
sectors. Among seven categories, manufacturing, service, tourism and energy sectors are contributing<br />
larger than other remaining sectors. The figure shows the project and asset values of large, medium and<br />
small scale industries. Large scale industries are possessing large asset values than other scale of<br />
industries. As seen from map in Figure 2.19, the income and expenditure ratio due to industrial activities<br />
are relatively same.<br />
Central Hill and Terai zones are most industrially developed, followed by eastern hill and Terai region.<br />
Figure 2.19 shows economy of zones due to industrial activities.<br />
Figure 2.19. Industries and economic profile(Source: (DOI, 2008)).<br />
33
<strong>Nepal</strong> <strong>Hazard</strong> <strong>Risk</strong> <strong>Assessment</strong><br />
2.14 POWER SECTOR<br />
Figure 2.20 shows the map indicating major power station transmission line and substations. The red<br />
color represents existing power station and the blue color represent under construction power station.<br />
The green color represent proposed power station. Most of the existing power stations are located in<br />
central region.<br />
Figure 2.21 shows map indicating location of small hydro power station, Isolated solar and diesel power<br />
station. In addition, most of the small stations are located in Mountain Region and Hill Region.<br />
Figure 2.22 shows the number of power stations in the country. The power stations are classified into<br />
Major hydro power stations, Small hydro power stations, small hydro power stations, Diesel power<br />
stations and solar power stations. The graph shows number of power station by its classification. Small<br />
power hydro station and Small power hydro station (Isolated) have highest number which are 27 and 23<br />
stations (NEA, 2009) respectively while Diesel power station and Solar power station are lowest in<br />
number.<br />
Figure 2.22 shows capacity of power generation. Major hydropower stations have the highest value of<br />
power generation amounting to 45,000 kW whiles Solar power station has lowest value to 100 kW<br />
(NEA, 2009). The country is largely dependent on hydropower, due to erratic climate change; water<br />
supply <strong>for</strong> power generation has reduced. Thus the country is facing acute shortage of electricity supply.<br />
Figure 2.21. Map of <strong>Nepal</strong> showing small hydro power station, Isolated solar and diesel power station (source: (NEA, 2009) )<br />
Figure 2.22. Graph showing number of power stations and electric power production by various classes of stations(source: (NEA, 2009) )<br />
Figure 2.20. Major power stations transmission lines and substations(source: (NEA, 2009) )<br />
34
<strong>Nepal</strong> <strong>Hazard</strong> <strong>Risk</strong> <strong>Assessment</strong><br />
2.15 TOURISM SECTOR<br />
Ministry of Tourism and Civil Aviation, Government of <strong>Nepal</strong> is focal <strong>for</strong> maintaining and developing<br />
tourism in the country. Tourism is major source of national income in the country. The recurring floods<br />
and landslides adversely affect the tourism and associated incomes. Report on <strong>Nepal</strong> Tourism Statistics<br />
2008, (MTCA, 2008) provides broader picture of tourism sectors and classified tourism activities into<br />
Holiday/Pleasure, Trekking and Mountaineering, Business, Pilgrimage, Official,<br />
Conference/Conference, Rafting and Others. The statistics shows that 58% of tourists are from <strong>Asia</strong><br />
region followed by Western Europe and North America. Figure 2.23 shows the distribution of tourists<br />
from various regions and also shows the purpose and proportion of tourists coming <strong>for</strong> defined purpose.<br />
Pokhara, Lumbini and national parks are most visited by the tourists. Figure 2.25 shows the revenue of<br />
tourism income in <strong>Nepal</strong>. The revenue generation due to tourism during 2008 amounted to 11.040<br />
Billion <strong>Nepal</strong> rupees. Figure 2.26 shows number of tourist arrival by entry point. There are two classes<br />
of arrival which are arrived by air and arrived by land.<br />
Figure 2.25. Total Revenue in 2007-08 due to Tourism (Source: (MTCA, 2008) )<br />
Figure 2.23. Tourist major region and purpose of visits (Source: (MTCA, 2008) )<br />
Figure 2.26. Most popular entry point <strong>for</strong> tourists (Source: (MTCA, 2008) )<br />
Figure 2.24. Most visited placed in <strong>Nepal</strong> (Source: (MTCA, 2008) )<br />
35
<strong>Nepal</strong> <strong>Hazard</strong> <strong>Risk</strong> <strong>Assessment</strong><br />
2.16 MINING SECTOR<br />
The geological surveys conducted by Department of Mines and Geology, Government of<br />
<strong>Nepal</strong>, revealed the possibility of major metallic and industrial mineral deposits, but a poor<br />
infrastructure and lack of a skilled work <strong>for</strong>ce inhibited further development of the mineral<br />
industry. Broadly, the mineral and query products range from Metallic, nonmetallic,<br />
Gemstone, decorative and dimension stones, construction minerals and fuel minerals. The<br />
average annual yields of minerals are shown in the Figure 2.27. The figure shows the profile<br />
of revenue created by production of Minerals. It is found that limestone, marble, coal and<br />
talk stone have rendered more income in this sector.<br />
2.17 TRADE AND FINANCIAL INSTITUTIONS SECTOR<br />
2.17.1 BANK DENSITY<br />
The map in Figure 2.28 shows the density of bank in each district per 1000 of population. The highest<br />
bank density is in Kathmandu which is 3.76 banks per 1000 population (ICIMOD and CBS, 2003a). The<br />
graph in Figure 2.28 shows the average of bank density in geo-development region. The highest density<br />
is in the central region and the lowest is in far-western region.<br />
Average Total Price of Minerals<br />
Average Price(0,000 NRS)<br />
Marble Slab cut<br />
Marble Craggy<br />
4488<br />
Red clay<br />
100000<br />
10000<br />
589<br />
1000<br />
Limestone(chemical grade)<br />
Kynite(a)<br />
Marble Chips<br />
132<br />
47<br />
100<br />
10<br />
13<br />
22<br />
186<br />
Kynite(b)<br />
Marble Aggregate<br />
1074<br />
1<br />
66<br />
Tourmaline<br />
10<br />
2<br />
5<br />
60<br />
mestone(cement grade) 31880<br />
Quartz crystal (a)<br />
Lignite<br />
1484<br />
1124<br />
Quartz crystal (b)<br />
Coal(Sub.bitu.)<br />
Salt<br />
Figure 2.28. Map show bank density per 1000 population (Source: (ICIMOD and CBS, 2003a))<br />
Talc<br />
Figure 2.27. Average total price of minerals (Source: (DMG, 2009))<br />
36
<strong>Nepal</strong> <strong>Hazard</strong> <strong>Risk</strong> <strong>Assessment</strong><br />
2.17.2 COOPERATIVES DENSITY<br />
The map in Figure 2.29 shows density of the cooperatives per 1000 population. The highest density is in<br />
the central region where Kathmandu (the highest density of cooperatives) located (ICIMOD and CBS,<br />
2003a). The lowest density is in far-western region. The district where the lowest density located is<br />
Manang (ICIMOD and CBS, 2003a).<br />
Figure 2.29. Map shows cooperatives density per 1000 population (Source: (ICIMOD and CBS, 2003a))<br />
37
<strong>Nepal</strong> <strong>Hazard</strong> <strong>Risk</strong> <strong>Assessment</strong><br />
2.18 GROUND ELEVATION<br />
2.18.1 ELEVATION<br />
<strong>Nepal</strong> has very extreme difference of height between northern part and southern part as result of plate<br />
collision known as Himalayan range. Elevations below 1200 meter are quite dominant in <strong>Nepal</strong> as seen<br />
from Figure 2.30, which also controlled low slope gradient. This low level area is known as Terai,<br />
located in southern part of <strong>Nepal</strong>, bordering with India.<br />
Figure 2.30. Elevation and slope pixel count.<br />
2.18.2 SLOPE<br />
Overall slope gradient in 15 geographical development zones have similar pattern (graph and map in<br />
Figure 2.31). Most of Terai areas are below 5° slope and very low elevation, which mean Terai area is<br />
relatively smooth gradient. Slope rise abruptly in hill geographic belt and peaked in average of ±20°<br />
slope in mountainous region. The elevation shows steep change from Terai to Hill and also from Hill to<br />
Mountain. Thus <strong>Nepal</strong> is dominated by rough terrain in hill and mountain belt (except <strong>for</strong> Kathmandu<br />
area) which is a big limitation <strong>for</strong> future development.<br />
2.18.3 SOURCE OF DATA FOR ELEVATION<br />
This study uses Aster data (METI, 2006) <strong>for</strong> elevation model. Aster data pixel resolution is 30 meter and<br />
can be obtained free of charge from website of Japan Ground Data System. Elevation data are<br />
aggregated into 200 meter pixel, except <strong>for</strong> segment analysis <strong>for</strong> flood modeling where the resolution is<br />
maintained at 30 meter pixel size. For some places where Aster data are not sufficient, it has been<br />
combined with SRTM (USGS, 2003) data with resolution of 90 m. SRTM data can also obtained free of<br />
charge from Consortium <strong>for</strong> Spatial In<strong>for</strong>mation (CGIAR-CSI) of the Consultative Group <strong>for</strong><br />
International Agricultural Research.<br />
Figure 2.31. Elevation and slope distribution (source: (USGS, 2003); (METI, 2006))<br />
38
<strong>Nepal</strong> <strong>Hazard</strong> <strong>Risk</strong> <strong>Assessment</strong><br />
2.19 DEMOGRAPHIC DATA<br />
2.19.1 POPULATION DENSITY<br />
This study projected <strong>Nepal</strong> population of year 2001(source: CBS,2001) to year 2009, which in turn is<br />
used as main population data. Total population projected in year 2009 based on projected calculation is<br />
26,795,911 people. Population density is highest in Kathmandu as seen in Figure 2.32, while second<br />
densest areas are in Terai area, especially in eastern and central zone. The highest zone is ± 913<br />
person/pixel 1 in Kathmandu valley. Lowest population distribution can be observed in mountainous<br />
geographic zone, especially in northwest area.<br />
2.19.2 URBAN TO DISTRICT POPULATION RATIO (ICIMOD AND CBS, 2003B)<br />
Urban population can be vital <strong>for</strong> disaster assessment because usually urban areas are very dense in<br />
population and can resulted in high casualties and damages. Urban to district population ratio is<br />
percentage of urban population compared to the district population. Mean ratio of urban to district<br />
population <strong>for</strong> <strong>Nepal</strong> is ±16% with higher tendency of non urban area as seen in histogram and map in<br />
Figure 2.32. Urban population is concentrated in Kathmandu valley with value ±65.88% and followed<br />
by Lalitpur ±48.25%. Total urban population in <strong>Nepal</strong> in year 2001 is ±14.20% of total population.<br />
2.19.3 AGED DEPENDENCY RATIO (ICIMOD and CBS, 2003b)<br />
The aged dependency ratio is an important indicator of population structure and is defined as the number<br />
of aged persons (60 years and over) per 100 persons of age 15 to 59 years. This indicator assists in<br />
understanding the situation of the aged population in the country. The aged dependency ratio <strong>for</strong> <strong>Nepal</strong><br />
as a whole (enumerated population) was 12.00; it ranged from 6.09 (Jajarkot) to 18.44 (Lamjung).<br />
Thirty-five districts had an aged dependency ratio below, and 40 districts ratios above, the national<br />
figure (ICIMOD and CBS, 2003b).<br />
In<strong>for</strong>mation of age dependency can help on disaster management to reach efficient assessment and relief<br />
when disaster occurred. <strong>Nepal</strong> has aged dependency ratio around ±12.59% as refered from Figure<br />
2.32.The distributions are relatively uni<strong>for</strong>m within whole <strong>Nepal</strong>.<br />
1 Pixel size is 200 m x 200 m<br />
Figure 2.32. Population distribution. (Source: (CBS, 2001), (ICIMOD and CBS, 2003b))<br />
39
<strong>Nepal</strong> <strong>Hazard</strong> <strong>Risk</strong> <strong>Assessment</strong><br />
3 HAZARD ASSESSMENT<br />
3.1 BACKGROUND<br />
<strong>Hazard</strong> assessment is essential and first step of risk assessment. <strong>Hazard</strong> assessment commonly shows<br />
zones of different intensity or probability of certain hazard. <strong>Hazard</strong> maps (BGR and GAI, 2009) can be<br />
applied in many ways:<br />
• It serves as in<strong>for</strong>mation <strong>for</strong> the public about threats in their living environment<br />
• It can be used as input <strong>for</strong> land use, strategic and business planning<br />
• It is the basis <strong>for</strong> civil engineers, town planers <strong>for</strong> safe and sustainable development<br />
• It can work as the basis <strong>for</strong> developing risk transfer mechanism through insurance and<br />
catastrophic bonds etc.<br />
Practitioners broadly differentiate between “susceptibility” and hazard maps.<br />
Susceptibility maps(BGR and GAI, 2009) provide spatial in<strong>for</strong>mation on whether a certain terrain is<br />
prone to the occurrence of a hazardous event. The term is particularly common <strong>for</strong> landslides studies,<br />
where static parameters such as topography / slope, soil condition and average rainfall can be used to<br />
indicate the potential <strong>for</strong> mass movements.<br />
A hazard map (BGR and GAI, 2009) additionally takes into account the temporal probability that a<br />
hazardous event may occur. For an example a flood hazard map is commonly based on the return period<br />
of river flooding levels.<br />
3.1.1 CHARACTERISTICS OF HAZARD ASSESSMENT<br />
<strong>Hazard</strong> assessment is characterized by degree of severity, duration, extent of the impact area and their<br />
relationship. There are several ways by which, hazard assessment can be carried out. The<br />
comprehensiveness of hazard assessment depends on following factors:<br />
• Availability of disaster event data and geological, geomorphological, demographic data<br />
• Availability of time and resources<br />
• Type and characteristics of hazards<br />
• Application of hazard assessment to the end users.<br />
There are several ways by which, hazard assessment can be per<strong>for</strong>med, which largely depending upon<br />
availability of data and scientific tools like map analysis, analysis of aerial photography and imagery,<br />
field reconnaissance, aerial reconnaissance, drilling, acoustic imagery and profiling, geophysical studies,<br />
computerized terrain analysis and instrumentation.<br />
3.1.2 SCOPE OF HAZARD ASSESSMENT IN THE PROJECT<br />
a. Earthquake <strong>Hazard</strong> <strong>Assessment</strong><br />
Earthquake hazard assessment has been carried out based on Modified Mescalli Intensity Scale. The<br />
Peak Ground Acceleration map developed by Department of Mines and Geology has <strong>for</strong>med the basis<br />
<strong>for</strong> earthquake zoning. The attenuation relationship has been developed based on Trifunac (Trifunac and<br />
Brady, 1975). Other methods like Wald (Wald et al., 1999) and Probabilistic seismic <strong>Hazard</strong> <strong>Assessment</strong><br />
Map (PSHA) have been compared with developed hazard map, validated and finalized. The study<br />
proposes five zones of earthquake namely “Very High”, “Moderate High”, “High”, “Medium”, and<br />
“Low” severity. The earthquake hazard assessment maybe referred at Section 3.2<br />
b. Landslide <strong>Hazard</strong> <strong>Assessment</strong><br />
The developed landslide hazard maps are classified into rainfall and earthquake induced landslide<br />
hazard. The landslide hazard maps are categorized into high, medium, low, and negligible severity. The<br />
landslide hazards assessment may be referred at Section 3.3<br />
c. Flood <strong>Hazard</strong> <strong>Assessment</strong><br />
Floods occur regularly and affect broadly the central and southern region of <strong>Nepal</strong>. There are several<br />
perennial rivers, contributing regular floods like Bagmati, Rapti, Kamala, Kankai, Tinau, Karnali, Babai<br />
and Narayani etc. Floods from these rivers are result in major losses of life and other economic sectors.<br />
The study aimed to carry out desktop based flood hazard assessment <strong>for</strong> selected rivers. The hazard<br />
assessment has resulted in defining inundation area and depth using one dimesion model namely<br />
“HECRAS”. The Flood scenario has been developed <strong>for</strong> various return periods of 10 years, 25 years, 50<br />
years, 100 years and 500 years. The flood hazard assessment is further cross checked with established<br />
and official data and in<strong>for</strong>mation. A national level technical team is also been consulted while finalizing<br />
the flood hazard assessment maps. The flood hazard assessment may be referred at Section 3.4<br />
d. Drought <strong>Hazard</strong> <strong>Assessment</strong><br />
In recent past, drought has occurred frequently in the country. Due to climate changes, rapid degradation<br />
of environment, exploitation of natural resources, the drought situation has been aggravated. The drought<br />
hazard assessment has been carried out using well established tools i.e. Standard Precipitation Index<br />
(SPI) and Soil Moisture Index (SMI). The detail of drought hazard assessment may be referred at<br />
Section 3.5<br />
e. Epidemics <strong>Hazard</strong> <strong>Assessment</strong><br />
Under the study scope health hazards have been classified as diseases and outbreaks. The health hazard<br />
mapping includes Diarrhoea, Kalazaar, Hepatitis, Influenza, Typhoid, Acute Respiratory Infection,<br />
Malaria, Sexual Transmitted Infection, Filariasis, Gastroentri Tuberculosis, and Leprosy. For each<br />
disease and outbreak, Incidence index have been developed. Further trend analysis has been carried out<br />
to understand severity of the problems. The details of Epidemic hazard assessment may be referred at<br />
Section 3.6.<br />
40
<strong>Nepal</strong> <strong>Hazard</strong> <strong>Risk</strong> <strong>Assessment</strong><br />
3.2 EARTHQUAKE HAZARD ASSESSMENT<br />
<strong>Nepal</strong> has witnessed several large scale earthquakes in past centuries. The Department of Mines and<br />
Geology has developed Peak Ground Acceleration map <strong>for</strong> the whole country (Pandey et al., 2002). The<br />
earthquake hazard maps have been developed in MMI scale. The MMI scale is one of the simple<br />
indicators <strong>for</strong> understanding the severity of earthquake hazards.<br />
3.2.1 MAP CONTENT<br />
Earthquake hazard map has been developed in Modified Mercalli Intensity scale (MMI), which shows<br />
distribution of intensity throughout the country. The earthquake hazard maps have been prepared <strong>for</strong><br />
several return periods i.e., 500, 250, 100, and 50 yr.<br />
• Epicentre maps of <strong>Nepal</strong> Himalaya from National Seismological Centre (NSC, 2005)<br />
3.2.4 METHODOLOGY<br />
Simplified illustration of methodology can be referred in Figure 3.1. Peak ground acceleration map from<br />
<strong>Nepal</strong> DMG is extrapolated into more continuous manner that resulted as this study PGA.<br />
PSHA analysis is carried out <strong>for</strong> lower return period based on DMG parameters (Pandey et al., 2002).<br />
Average difference from 500 year return period PGA to lower return period PGAs is used <strong>for</strong> creating<br />
map of lower return period PGA. These PGAs are trans<strong>for</strong>med to MMI value. The last step is zoning the<br />
MMI value into specifics zone which resulted in final maps. More detailed description of methodology<br />
can be referred in Annexure-1.<br />
3.2.2 APPLICATION OF MAPS<br />
Earthquake hazard maps have been developed <strong>for</strong> whole <strong>Nepal</strong>. Earthquakes zones are overlaid with<br />
district boundary. These hazard maps are developed <strong>for</strong> several purposes, such as:<br />
• Earthquake hazard maps will be helpful <strong>for</strong> physical and infrastructural development in the<br />
country. The map will help the policymakers and decision makers to understand the severity of<br />
earthquake hazard and take necessary action to sustain the development through introducing<br />
necessary programs and measures.<br />
• Most important sectors like education, health, housing, lifelines and transportation need special<br />
attention <strong>for</strong> earthquake safety. The earthquake zones will provide fare understanding about<br />
expected per<strong>for</strong>mance of structures during earthquakes and necessary measures to protect the<br />
structures.<br />
• The zones will further help the local urban government to introduce and en<strong>for</strong>ce building<br />
byelaws and building codes to protect the urban infrastructure.<br />
• The maps will help national and international NGOs to prioritize the disaster risk reduction<br />
strategies.<br />
3.2.3 DATA AVAILABILITY FROM SOURCES<br />
Data used <strong>for</strong> producing maps are:<br />
• PGA (Peak Ground Acceleration) map from NGI (Norwegian Geotechnical Institute) (NGI,<br />
2004)<br />
• Baseline seismic hazard map, which contain PGA (Peak Ground Acceleration) map and report<br />
developed by <strong>Nepal</strong> DMG (Pandey et al., 2002). <strong>Nepal</strong> Department of Mines and Geology<br />
(DMG) have developed probabilistic seismic hazard assessment (PSHA) <strong>for</strong> bedrock peak<br />
ground horizontal acceleration <strong>for</strong> five hundred return periods.<br />
• Earthquake catalog <strong>for</strong> <strong>Nepal</strong> area can be downloaded from USGS (USGS), that can be<br />
downloaded in http://earthquake.usgs.gov/earthquakes/eqarchives/epic/<br />
Figure 3.1. Methodology <strong>for</strong> earthquake hazard mapping.<br />
41
<strong>Nepal</strong> <strong>Hazard</strong> <strong>Risk</strong> <strong>Assessment</strong><br />
3.2.5 HOW TO READ THE MAPS<br />
If the return period is higher, the scenario will be more critical. Based on MMI distribution, the hazard<br />
zones are calibrated. Table 3.1 shows the relationship between intensity and severity zones. Very high<br />
seismic risk has been demarcated by red colour, followed by orange, light brown-yellow and yellow<br />
colour representing high, medium and low seismic zone respectively. The map further shows<br />
geographical coverage of low, medium and high seismic zones.<br />
Table 3.1. Earthquake hazard zone scale<br />
Zone MMI range Color<br />
Low < VI Yellow<br />
Medium VI Light brown‐yellow<br />
High VII Orange<br />
Very<br />
high > VII Red<br />
3.2.6 ANALYSIS OF HAZARD ASSESSMENT<br />
Figure 3.7 - Figure 3.10 show seismic hazard zoning maps <strong>for</strong> various return periods of 500 years, 250<br />
Years, 100 years and 50 years respectively. Table 3.2 - Table 3.5 shows corresponding districts coverage<br />
of various zones <strong>for</strong> stated return periods. As the return period increases, the risk zone increases<br />
accordingly. Following paragraph explains the earthquake hazard assessment outcomes.<br />
Figure 3.3 shows scatter plot of percentage hazard area to total area. Very high hazard points tend to<br />
cluster near top (100%). A lot of districts area completely falling within very high earthquake risk.<br />
Under 500 Years return period earthquake hazard mapping, 29 districts including Sankhuasabha,<br />
Bhojpur, Khotang, Okhaldhunga, Siraha, Dhanusha, Mahottari, Sindhuli, Ramechhap, Kabhrepalanchok,<br />
Lalitpur, Bhaktapur, Kathmandu, Nuwakot, Dhading, Lamjung, Kaski, Tanahu, Syangja, Parbat,<br />
Baglung, Myagdi, Gulmi, Rukum, Jajarkot, Dailekh, Kalikot, Accham, Baitadi are completely falling<br />
under very high earthquake risk.<br />
Result maps (Figure 3.7 - Figure 3.10) are presented <strong>for</strong> different earthquake return years periods. Each<br />
map is accompanied with tables (Table 3.2 - Table 3.5) showing zone area distribution within each<br />
district as per <strong>for</strong>mat given in Figure 3.2. The maps contain country wise distribution of each hazard<br />
zone class in graphical <strong>for</strong>mat, and geo development regions area distribution.<br />
Figure 3.2. Visualization guideline.<br />
Figure 3.3. <strong>Hazard</strong> vs total area cross plot <strong>for</strong> 500 year return period.<br />
42
<strong>Nepal</strong> <strong>Hazard</strong> <strong>Risk</strong> <strong>Assessment</strong><br />
More than two third of the geographical area of 19 districts including Pyuthan,Sarlahi, Panchthar,<br />
Manang, Dadeldhura, Makawanpur, Rasuwa, Bajura, Solukhumbu, Jumla, Udayapur, Taplejung, Rolpa,<br />
Terhathum, Bajhang, Dolakha, Sindhupalchok, Doti and Darchula are falling under very high risk zone.<br />
The distribution of medium, high and very high earthquake risk zone area wrt five development regions<br />
and three belts are shown in inset graph within Figure 3.7.<br />
The 250 Years return period earthquake hazard mapping have 2 districts (Okhaldhunga, Bhaktapur)<br />
which are located completely under very high earthquake risk. Twelve districts with large area falling<br />
under very high earthquake risk (more than 2/3 of district area) are Dhanusa, Ramechap,<br />
Kabrepalanchok, Kathmandu, Nuwakot, Kaski, Parbat, Baglung, Myagdi, Rukum, Jajarkot, Kalikot.<br />
This can be observed in Table 3.3, together with distribution in lower earthquake risk zone. Figure 3.4<br />
shows even distribution of high and very high hazard class, ranged from 1000 km 2 to 2700 km 2 on total<br />
area. Several districts are near 100% zone.<br />
High risk zone has slightly larger area coverage, followed by medium and then by very high earthquake<br />
risk zone. Terai area has large coverage of medium earthquake risk zone as seen from inset in Figure 3.8.<br />
The 100 Years return period earthquake hazard mapping covers 2 zone, which are medium and high<br />
earthquake risk. Thirty four districts are largely located in high zone as seen in Table 3.4. Around 11<br />
districts (Okhaldhunga, Dhanusa, Ramechhap, Bhaktapur, Kathmandu, Nuwakot, Kaski, Baglung,<br />
Myagdi, Rukum, and Kalikot) are completely falling under high zone. This can be observed in Table 3.4.<br />
Figure 3.5 shows cluster of points (both of medium and high hazards zones) toward 100% zone.<br />
Figure 3.5. <strong>Hazard</strong> vs total area cross plot <strong>for</strong> 100 year return period.<br />
Figure 3.4. <strong>Hazard</strong> vs total area cross plot <strong>for</strong> 250 year return period.<br />
Within 100 year return period, medium earthquake risk zone has larger area coverage than high risk<br />
zone, which may be referred in Figure 3.9. High risk zone is concentrated in Hill belt, and followed by<br />
Mountain area and last by Terai area which are referred in inset graph in Figure 3.9.<br />
Geographical distribution of very high earthquake zone is concentrated in hill region as seen in Figure<br />
3.8. Distribution of medium, high and very high risk zone are relative uni<strong>for</strong>m in 250 year return period.<br />
43
<strong>Nepal</strong> <strong>Hazard</strong> <strong>Risk</strong> <strong>Assessment</strong><br />
On 50 Years return period earthquake hazard mapping, 8 districts (Okhaldunga, Ramechhap, Nuwakot,<br />
Kaski, Myagdi, Rukum, Jajarkot, Kalikot) have more than two third of their area on high earthquake risk<br />
zone. 43 districts located in medium zone, which can be referred in Table 3.5. Figure 3.6 show that<br />
medium earthquake hazard zone is stretched to 100% coverage. Thus, medium hazard zone is prominent<br />
in those districts.<br />
much used by other sectoral development and planning professionals. Thus, the developed maps<br />
will be widely referred and used by large section of society.<br />
• The developed maps are validated with reference to past earthquakes of 1934 and 1988.<br />
3.2.8 RECOMMENDATIONS<br />
• The Government of <strong>Nepal</strong> has set up National Seismological Center under Department of Mines<br />
and Geology. The purpose of the center is to compile, monitor seismic activities in the country.<br />
The center has compiled large database <strong>for</strong> micro and large earthquake events. There is a network<br />
of seismic stations in the country monitoring ongoing seismic activities. However, there is a need<br />
to enhance the monitoring system.<br />
• The Terai region has vast coverage of alluvium deposit, hence most prone to liquefaction<br />
phenomenon. More intense studies are required <strong>for</strong> liquefaction potential.<br />
• At present, past earthquake isoseismal maps are not available. It is necessary to develop system,<br />
so that earthquake isoseismal maps could be plotted in detail after the earthquakes.<br />
• Further study on active fault within <strong>Nepal</strong> should be carried out <strong>for</strong> refined prediction of its<br />
tectonic behavior.<br />
Figure 3.6. <strong>Hazard</strong> vs total area cross plot <strong>for</strong> 50 year return period.<br />
Medium earthquake risk zone has large coverage in the 50 Years return period, which can be observed in<br />
Figure 3.10. High risk zone is concentrated in Hill belt as seen from the map and inset graph. Western<br />
region has larger distribution of high risk zone compared to other region as observed from inset graph.<br />
3.2.7 SPECIAL REMARKS<br />
• The earthquake hazard maps have been developed using MMI scale. The hazard assessment is<br />
based on PGA map developed by Department of Mines and Geology. The objective of<br />
developing MMI scale map is to make policy makers, decision makers to understand distribution<br />
of severity of earthquake risk in the country. Though, PGA maps are more precise and could be<br />
understood and more used by seismologists, geologists and civil engineers, however it is not very<br />
44
<strong>Nepal</strong> <strong>Hazard</strong> <strong>Risk</strong> <strong>Assessment</strong><br />
Table 3.2. Districts area percentage distribution of Earthquake hazard assessment <strong>for</strong> 500 yr return period.<br />
Table 3.4. Districts area percentage distribution of Earthquake hazard assessment <strong>for</strong> 100 yr return period.<br />
District Medium High Very High District Medium High Very High District<br />
Medium High Very High<br />
1 TAPLEJUNG 5.87% 94.13% 26 BHAKTAPUR 100.00% 51 GULMI 100.00%<br />
2 PANCHTHAR 32.62% 67.38% 27 KATHMANDU 100.00% 52 RUKUM 100.00%<br />
3 ILAM 97.89% 2.11% 28 NUWAKOT 100.00% 53 SALYAN 35.83% 64.17%<br />
4 JHAPA 46.76% 53.24% 29 RASUWA 16.83% 83.17% 54 ROLPA 4.95% 95.05%<br />
5 MORANG 45.92% 54.08% 30 DHADING 100.00% 55 PYUTHAN 33.22% 66.78%<br />
6 SUNSARI 24.37% 75.63% 31 MAKAWANPUR 23.53% 76.47% 56 DANG 46.61% 53.39%<br />
7 DHANKUTA 39.04% 60.96% 32 RAUTAHAT 93.77% 6.23% 57 BANKE 67.65% 32.35%<br />
8 TERHATHUM 4.73% 95.27% 33 BARA 100.00% 58 BARDIYA 5.52% 94.48%<br />
9 SANKHUWASABHA 0.00% 100.00% 34 PARSA 100.00% 59 SURKHET 44.06% 55.94%<br />
10 BHOJPUR 100.00% 35 CHITAWAN 62.49% 37.51% 60 JAJARKOT 100.00%<br />
11 SOLUKHUMBU 9.71% 90.29% 36 GORKHA 36.73% 63.27% 61 DAILEKH 100.00%<br />
12 KHOTANG 100.00% 37 LAMJUNG 100.00% 62 DOLPA 22.73% 30.74% 46.53%<br />
13 OKHALDHUNGA 100.00% 38 MANANG 32.58% 67.42% 63 JUMLA 7.16% 92.84%<br />
14 UDAYAPUR 6.56% 93.44% 39 KASKI 100.00% 64 KALIKOT 100.00%<br />
15 SAPTARI 0.07% 48.13% 51.80% 40 TANAHU 100.00% 65 MUGU 16.77% 60.33% 22.90%<br />
16 SIRAHA 100.00% 41 SYANGJA 100.00% 66 HUMLA 14.60% 82.17% 3.24%<br />
17 DHANUSHA 100.00% 42 PARBAT 100.00% 67 BAJHANG 3.87% 96.13%<br />
18 MAHOTTARI 100.00% 43 BAGLUNG 100.00% 68 BAJURA 15.20% 84.80%<br />
19 SARLAHI 33.04% 66.96% 44 MYAGDI 100.00% 69 ACHHAM 100.00%<br />
20 SINDHULI 100.00% 45 MUSTANG 32.56% 29.43% 38.01% 70 DOTI 0.43% 99.57%<br />
21 RAMECHHAP 100.00% 46 PALPA 42.44% 57.56% 71 KAILALI 97.87% 2.13%<br />
22 DOLAKHA 3.54% 96.46% 47 NAWALPARASI 0.68% 69.07% 30.24% 72 KANCHANPUR 100.00%<br />
23 SINDHUPALCHOK 1.34% 98.66% 48 RUPANDEHI 55.85% 44.15% 73 DADELDHURA 31.91% 68.09%<br />
24 KABHREPALANCHOK 100.00% 49 KAPILBASTU 90.52% 9.48% 74 BAITADI 100.00%<br />
25 LALITPUR 100.00% 50 ARGHAKHANCHI 2.49% 65.57% 31.94% 75 DARCHULA 0.15% 99.85%<br />
Table 3.3. Districts area percentage distribution of Earthquake hazard assessment <strong>for</strong> 250 yr return period.<br />
District Medium High Very High District Medium High Very High District Medium High Very High<br />
1 TAPLEJUNG 1.81% 75.41% 22.78% 26 BHAKTAPUR 100.00% 51 GULMI 100.00%<br />
2 PANCHTHAR 23.13% 76.87% 27 KATHMANDU 12.96% 87.04% 52 RUKUM 2.23% 97.77%<br />
3 ILAM 93.08% 6.92% 28 NUWAKOT 4.57% 95.43% 53 SALYAN 29.36% 70.56% 0.08%<br />
4 JHAPA 100.00% 29 RASUWA 8.23% 78.60% 13.18% 54 ROLPA 2.26% 83.02% 14.72%<br />
5 MORANG 100.00% 30 DHADING 42.64% 57.36% 55 PYUTHAN 25.71% 74.27% 0.03%<br />
6 SUNSARI 98.69% 1.31% 31 MAKAWANPUR 11.74% 88.26% 56 DANG 99.98% 0.02%<br />
7 DHANKUTA 26.90% 73.10% 32 RAUTAHAT 83.66% 16.34% 57 BANKE 100.00%<br />
8 TERHATHUM 0.25% 99.75% 33 BARA 99.84% 0.16% 58 BARDIYA 100.00%<br />
9 SANKHUWASABHA 49.36% 50.64% 34 PARSA 100.00% 59 SURKHET 31.36% 68.64%<br />
10 BHOJPUR 73.46% 26.54% 35 CHITAWAN 54.52% 45.25% 0.22% 60 JAJARKOT 16.66% 83.34%<br />
11 SOLUKHUMBU 5.49% 42.01% 52.50% 36 GORKHA 31.30% 34.44% 34.27% 61 DAILEKH 57.17% 42.83%<br />
12 KHOTANG 44.75% 55.25% 37 LAMJUNG 37.69% 62.31% 62 DOLPA 49.99% 43.87% 6.13%<br />
13 OKHALDHUNGA 100.00% 38 MANANG 24.80% 75.20% 0.00% 63 JUMLA 3.56% 66.08% 30.36%<br />
14 UDAYAPUR 3.53% 66.14% 30.33% 39 KASKI 14.32% 85.68% 64 KALIKOT 5.04% 94.96%<br />
15 SAPTARI 40.07% 59.93% 40 TANAHU 56.61% 43.39% 65 MUGU 73.11% 26.89%<br />
16 SIRAHA 35.59% 64.41% 41 SYANGJA 77.02% 22.98% 66 HUMLA 95.34% 4.66%<br />
17 DHANUSHA 6.15% 93.85% 42 PARBAT 30.11% 69.89% 67 BAJHANG 1.71% 40.01% 58.28%<br />
18 MAHOTTARI 98.35% 1.65% 43 BAGLUNG 23.01% 76.99% 68 BAJURA 12.43% 34.46% 53.11%<br />
19 SARLAHI 23.09% 76.91% 44 MYAGDI 1.22% 98.78% 69 ACHHAM 57.58% 42.42%<br />
20 SINDHULI 35.99% 64.01% 45 MUSTANG 59.00% 32.09% 8.91% 70 DOTI 89.55% 10.45%<br />
21 RAMECHHAP 8.19% 91.81% 46 PALPA 31.15% 68.85% 71 KAILALI 87.29% 12.71%<br />
22 DOLAKHA 1.57% 45.57% 52.86% 47 NAWALPARASI 62.98% 37.02% 72 KANCHANPUR 100.00%<br />
23 SINDHUPALCHO 0.24% 45.64% 54.12% 48 RUPANDEHI 100.00% 73 DADELDHURA 19.35% 80.65%<br />
24 KABHREPALANCHOK 33.00% 67.00% 49 KAPILBASTU 100.00% 74 BAITADI 82.15% 17.85%<br />
25 LALITPUR 82.51% 17.49% 50 ARGHAKHANCHI 60.40% 39.60% 75 DARCHULA 34.84% 65.16%<br />
District Medium High District Medium High District Medium High<br />
1 TAPLEJUNG 25.96% 74.04% 26 BHAKTAPUR 100.00% 51 GULMI 55.42% 44.58%<br />
2 PANCHTHAR 94.32% 5.68% 27 KATHMANDU 100.00% 52 RUKUM 100.00%<br />
3 ILAM 100.00% 28 NUWAKOT 100.00% 53 SALYAN 75.13% 24.87%<br />
4 JHAPA 100.00% 29 RASUWA 62.11% 37.89% 54 ROLPA 41.09% 58.91%<br />
5 MORANG 100.00% 30 DHADING 9.50% 90.50% 55 PYUTHAN 81.06% 18.94%<br />
6 SUNSARI 100.00% 31 MAKAWANPUR 82.32% 17.68% 56 DANG 100.00%<br />
7 DHANKUTA 99.88% 0.12% 32 RAUTAHAT 100.00% 0.00% 57 BANKE 100.00%<br />
8 TERHATHUM 89.64% 10.36% 33 BARA 100.00% 0.00% 58 BARDIYA 100.00%<br />
9 SANKHUWASABHA 13.63% 86.37% 34 PARSA 100.00% 0.00% 59 SURKHET 97.69% 2.31%<br />
10 BHOJPUR 34.98% 65.02% 35 CHITAWAN 88.76% 11.24% 60 JAJARKOT 0.08% 99.92%<br />
11 SOLUKHUMBU 29.32% 70.68% 36 GORKHA 54.29% 45.71% 61 DAILEKH 15.63% 84.37%<br />
12 KHOTANG 14.66% 85.34% 37 LAMJUNG 8.04% 91.96% 62 DOLPA 75.39% 24.61%<br />
13 OKHALDHUNGA 100.00% 38 MANANG 79.83% 20.17% 63 JUMLA 41.46% 58.54%<br />
14 UDAYAPUR 42.06% 57.94% 39 KASKI 100.00% 64 KALIKOT 100.00%<br />
15 SAPTARI 94.75% 5.25% 40 TANAHU 8.18% 91.82% 65 MUGU 95.77% 4.23%<br />
16 SIRAHA 2.03% 97.97% 41 SYANGJA 32.70% 67.30% 66 HUMLA 100.00% 0.00%<br />
17 DHANUSHA 100.00% 42 PARBAT 0.26% 99.74% 67 BAJHANG 22.45% 77.55%<br />
18 MAHOTTARI 12.42% 87.58% 43 BAGLUNG 100.00% 68 BAJURA 28.19% 71.81%<br />
19 SARLAHI 89.40% 10.60% 44 MYAGDI 100.00% 69 ACHHAM 22.05% 77.95%<br />
20 SINDHULI 12.57% 87.43% 45 MUSTANG 78.88% 21.12% 70 DOTI 63.87% 36.13%<br />
21 RAMECHHAP 100.00% 46 PALPA 100.00% 71 KAILALI 100.00%<br />
22 DOLAKHA 23.06% 76.94% 47 NAWALPARASI 99.50% 0.50% 72 KANCHANPUR 100.00%<br />
23 SINDHUPALCHOK 18.71% 81.29% 48 RUPANDEHI 100.00% 73 DADELDHURA 93.19% 6.81%<br />
24 KABHREPALANCHOK 0.01% 99.99% 49 KAPILBASTU 100.00% 74 BAITADI 30.85% 69.15%<br />
25 LALITPUR 8.90% 91.10% 50 ARGHAKHANCHI 100.00% 75 DARCHULA 12.61% 87.39%<br />
Table 3.5. Districts area percentage distribution of Earthquake hazard assessment <strong>for</strong> 50 yr return period.<br />
District Low Medium High District Low Medium High District<br />
Low Medium High<br />
1 TAPLEJUNG 87.60% 12.40% 26 BHAKTAPUR 58.76% 41.24% 51 GULMI 100.00%<br />
2 PANCHTHAR 100.00% 27 KATHMANDU 42.72% 57.28% 52 RUKUM 17.99% 82.01%<br />
3 ILAM 100.00% 28 NUWAKOT 18.26% 81.74% 53 SALYAN 100.00%<br />
4 JHAPA 56.88% 43.12% 29 RASUWA 96.20% 3.80% 54 ROLPA 97.42% 2.58%<br />
5 MORANG 52.31% 47.69% 30 DHADING 67.13% 32.87% 55 PYUTHAN 100.00%<br />
6 SUNSARI 29.28% 70.72% 31 MAKAWANPUR 100.00% 56 DANG 51.67% 48.33%<br />
7 DHANKUTA 100.00% 32 RAUTAHAT 100.00% 57 BANKE 76.75% 23.25%<br />
8 TERHATHUM 100.00% 33 BARA 100.00% 58 BARDIYA 10.71% 89.29%<br />
9 SANKHUWASABHA 64.75% 35.25% 34 PARSA 100.00% 59 SURKHET 100.00%<br />
10 BHOJPUR 84.39% 15.61% 35 CHITAWAN 100.00% 60 JAJARKOT 32.62% 67.38%<br />
11 SOLUKHUMBU 57.67% 42.33% 36 GORKHA 77.19% 22.81% 61 DAILEKH 77.73% 22.27%<br />
12 KHOTANG 64.52% 35.48% 37 LAMJUNG 58.32% 41.68% 62 DOLPA 24.67% 74.86% 0.47%<br />
13 OKHALDHUNGA 100.00% 38 MANANG 100.00% 63 JUMLA 79.47% 20.53%<br />
14 UDAYAPUR 82.22% 17.78% 39 KASKI 29.51% 70.49% 64 KALIKOT 10.80% 89.20%<br />
15 SAPTARI 0.82% 99.18% 40 TANAHU 80.00% 20.00% 65 MUGU 22.38% 77.62%<br />
16 SIRAHA 55.62% 44.38% 41 SYANGJA 91.16% 8.84% 66 HUMLA 25.79% 74.21%<br />
17 DHANUSHA 37.23% 62.77% 42 PARBAT 41.38% 58.62% 67 BAJHANG 0.13% 53.50% 46.37%<br />
18 MAHOTTARI 100.00% 43 BAGLUNG 47.39% 52.61% 68 BAJURA 58.54% 41.46%<br />
19 SARLAHI 100.00% 44 MYAGDI 8.42% 91.58% 69 ACHHAM 72.02% 27.98%<br />
20 SINDHULI 55.67% 44.33% 45 MUSTANG 34.18% 60.51% 5.31% 70 DOTI 96.79% 3.21%<br />
21 RAMECHHAP 15.74% 84.26% 46 PALPA 100.00% 71 KAILALI 0.71% 99.29%<br />
22 DOLAKHA 59.19% 40.81% 47 NAWALPARASI 4.80% 95.20% 72 KANCHANPUR 2.66% 97.34%<br />
23 SINDHUPALCHOK 61.34% 38.66% 48 RUPANDEHI 63.40% 36.60% 73 DADELDHURA 0.67% 99.33%<br />
24 KABHREPALANCHOK 66.27% 33.73% 49 KAPILBASTU 94.74% 5.26% 74 BAITADI 0.66% 95.22% 4.11%<br />
25 LALITPUR 100.00% 50 ARGHAKHANCHI 4.92% 95.08% 75 DARCHULA 2.10% 53.01% 44.89%<br />
.<br />
45
<strong>Nepal</strong> <strong>Hazard</strong> <strong>Risk</strong> <strong>Assessment</strong><br />
Figure 3.7. Map of earthquake hazard zone <strong>for</strong> 500 yr return period.<br />
46
<strong>Nepal</strong> <strong>Hazard</strong> <strong>Risk</strong> <strong>Assessment</strong><br />
Figure 3.8. Map of earthquake hazard zone <strong>for</strong> 250 yr return period.<br />
47
<strong>Nepal</strong> <strong>Hazard</strong> <strong>Risk</strong> <strong>Assessment</strong><br />
Figure 3.9. Map of earthquake hazard zone <strong>for</strong> 100 yr return period.<br />
48
<strong>Nepal</strong> <strong>Hazard</strong> <strong>Risk</strong> <strong>Assessment</strong><br />
Figure 3.10. Map of earthquake hazard zone <strong>for</strong> 50 yr return period.<br />
49
<strong>Nepal</strong> <strong>Hazard</strong> <strong>Risk</strong> <strong>Assessment</strong><br />
3.3 LANDSLIDE HAZARD ASSESSMENT<br />
Landslide hazard is frequent phenomenon is <strong>Nepal</strong> due to several reasons including tectonic activities,<br />
uncontrolled and unsafe development, heavy precipitation and environmental degradation. However it is<br />
observed that rainfall induced landslides is most prevalent in the hills and mountainous districts. In view<br />
of rapid development in hills and mountains in the country, it has become imperative to review, identify<br />
and analyze landslide prone areas and their causative factors. The present landslide hazard assessment<br />
carries out the hazard zonation of the country based on two triggering factors like earthquake and heavy<br />
precipitation.<br />
3.3.1 MAP CONTENT<br />
Landslide hazard maps show two classes of landslide zoning caused by earthquake events and heavy<br />
rainfall. The maps further show landslide hazard severity distribution in all districts triggered by above<br />
stated factors.<br />
3.3.2 APPLICATION OF MAPS IN DISASTER RISK MANAGEMENT<br />
• Two types of maps show the severity of landslide caused by rainfall and seismic events. The<br />
maps will help the planning and development agencies <strong>for</strong> physical and social development in<br />
hazard prone areas.<br />
• The maps will be especially helpful to Ministry of Physical Planning and Works, Ministry of<br />
In<strong>for</strong>mation and Communication, Ministry of Irrigation, Department of Electricity Development,<br />
Department of Road <strong>for</strong> sectoral development in landslide prone districts and region.<br />
• The study reveals that road sector is most prone to landslides during monsoon season. The<br />
Department of Road has initiated several structural mitigation projects at local level. The maps<br />
will help in identifying the sites <strong>for</strong> structural and non structural mitigation projects. The maps<br />
will help in prioritizing the site specific studies and mitigation interventions.<br />
• DWIDP closely monitors water induced disaster activities. The maps will help the department to<br />
focus on landslide disaster prone areas and seek cooperation with various other response agencies<br />
and departments <strong>for</strong> better disaster preparedness.<br />
• Precipitation data from Global Precipitation Climatology Centre (GPCC) that can be assessed in<br />
http://gpcc.dwd.de<br />
• Land cover database from European Space Agency (ESA) that can be assessed in<br />
http://www.esa.int/esaEO/SEMGSY2IU7E_index_0.html<br />
• Seismic Trigger Factor from PGA by NGI (NGI, 2004)<br />
The details of data may be referred at reference section of the report.<br />
3.3.4 METHODOLOGY<br />
The present methodology has been derived from NGI based on landslide hazard assessment, which can<br />
be referred in detail in Annexure-2.<br />
Landslide hazard, defined as the annual probability of occurrence of a potentially destructive landslide<br />
event, was estimated by an appropriate combination of the triggering factors (mainly extreme<br />
precipitation and seismicity) and susceptibility factors (slope, lithology, and soil moisture). The<br />
methodology is presented in Figure 3.11. The weights of different triggering and susceptibility factors<br />
were calibrated to the in<strong>for</strong>mation available in landslide inventories and physical processes. The general<br />
approach used in the present study is a modified and improved version of the approach used by Nadim et<br />
al. (2006).<br />
3.3.3 DATA AVAILABILITY FROM SOURCES<br />
Data source <strong>for</strong> producing the maps are:<br />
• Elevation data (SRTM) from Isciences, which can be assessed in<br />
http://www.isciences.com/index.html<br />
• Lithology from <strong>Nepal</strong> Department of Mines and Geology (DMG, 1987) on 1:250.000 scale maps<br />
• Moisture index data from Climate Prediction Center (CPC), which can be assessed in<br />
http://iridl.ldeo.columbia.edu/SOURCES/.NOAA/.NCEP/.CPC/.GMSM/<br />
Figure 3.11. Schematic approach <strong>for</strong> landslide hazard and risk evaluation.<br />
The hazard maps are divided into precipitation induced landslide hazard and earthquake induced<br />
landslide hazard. The landslide hazard indices were estimated using the following equations:<br />
50
<strong>Nepal</strong> <strong>Hazard</strong> <strong>Risk</strong> <strong>Assessment</strong><br />
H r = (S r x Six S h x S v )xT p (1)<br />
H e = (Sr X Si X Sh X Sv) x T s (2)<br />
Where Hr and He are landslide hazard indices <strong>for</strong> rainfall and earthquake induced landslides respectively,<br />
Sr is the slope factor within a selected grid, Sl is lithological (or geological) conditions factor, S h<br />
describes the soil moisture condition, T p is the precipitation factor and T s describes the seismic<br />
conditions. The index Sv described the vegetation cover.<br />
3.3.5 HOW TO READ THE MAPS<br />
Both classes of landslide hazard maps contain 4 categorized zones as negligible, low, medium, and high.<br />
The legend shown in maps is indicating color and respective hazard zoning.<br />
Negligible –Very low probability of landsldies<br />
Low - Low probability of landsldies<br />
Medium – Medium probability of landsldies<br />
High –High probability of landsldies<br />
The Table 3.6 and Table 3.7 show percentage area distribution of landslide zone within each district.<br />
These maps are presented <strong>for</strong> country scale. Slightly more detail in<strong>for</strong>mation can be referred <strong>for</strong> district<br />
level, especially <strong>for</strong> the dominant landslides classes.<br />
3.3.6 ANALYSIS OF HAZARD ASSESSMENT<br />
Slope, lithology, soil moisture, and precipitation are controlling factors <strong>for</strong> landslide hazard, while<br />
earthquake and rainfall are triggering factors. Peak of monsoon usually correlate with high landslide<br />
events in <strong>Nepal</strong> due to high precipitation. Data on the importance of earthquake triggered vs<br />
precipitation triggered in terms of fatalities may not be easily available. It is known that in some cases, a<br />
significant share of the earthquake fatalities are killed by earthquake triggered landslides.<br />
High susceptibility zone of landslide due to earthquake hazard are distributed in centre (hill) zone of<br />
<strong>Nepal</strong>, which is largely dependent on PGA values. Medium severity zone situated surrounding high<br />
severity zone and cover smaller percentage of geographical area. Negligible and low zone areas are<br />
located in north and southern border of <strong>Nepal</strong>. Figure 3.14 provides insight of area covered under<br />
earthquake induced landslide in the country. As per the assessment, <strong>for</strong> 500 years return period induced<br />
landslides, two third of the areas of Myagdi, Ramechhap, Parbat, Jajarkot, Kalikot, Okhaldhunga,<br />
Rukum and Baglung will be in high landslide susceptible zone. Similarly more than one third of the<br />
Solukhumbu, Sankhuasabha, Dolakha, Khotang, Accham, Sindhupalchowk, Bhaktapur, Baitadi, Rolpa,<br />
Sindhuli, Lamjung, Dailekh, Syangja, Kabhrepalanchok, Bajura, Nuwakot, Dhading, Tanahu, Kaski,<br />
Bajhang and Darchula will be affected. Figure 3.12 shows medium and high zones are clustered to low<br />
percentage area. Conversely negligible zone is clustered toward maximum (100%) zone.<br />
Figure 3.12. <strong>Hazard</strong> vs total area cross plot <strong>for</strong> earthquake triggered landslide.<br />
The rainfall induced landslide zones are distributed relatively normal (normal distribution) with large<br />
area having low and medium severity. High severity zone areas are relatively governed by specific<br />
lithology condition and slope degree. Based on analysis, more than 20 % of geographical areas of<br />
Rukum, Arghakhanchi, Baglung, Ilam, Tanahu, Syangja, Mustang and Palpa are prone to high landslides<br />
triggered by high intensity rainfall. More than 10 % of Jajarkot, Rasuwa, Salyan, Baitadi, Terhathum,<br />
Surkhet, Bajhang, Bajura, Rolpa, Darchula, Pyuthan, Gulmi, Dolpa, Nawalparasi and Panchthar are<br />
prone to high landslide under above stated category. Figure 3.13 shows low and medium hazard zones<br />
are distributed evenly within overall districts. High hazard value is clustered in low percentage hazard<br />
zone area. Conversely low zone is clustered in maximum percentage zone.<br />
51
<strong>Nepal</strong> <strong>Hazard</strong> <strong>Risk</strong> <strong>Assessment</strong><br />
• Soil profile plays important role in land slide hazard assessment. At present, there is no soil map<br />
existing <strong>for</strong> landslide hazard assessment. It is recommended to develop soil map at national and<br />
local scale, which can be used <strong>for</strong> landslide hazards assessment.<br />
• Though there is large number of landslide events every year, however very less number of event<br />
are reported because of resource constraints. It is recommended to develop a system <strong>for</strong><br />
collecting and recording landslide data <strong>for</strong> the country.<br />
Table 3.6. Districts area percentage distribution of earthquake induced landslide.<br />
Figure 3.13. <strong>Hazard</strong> vs total area cross plot <strong>for</strong> precipitation triggered landslide.<br />
District Negligible Low Medium High District Negligible Low Medium High District Negligible Low Medium High<br />
1 TAPLEJUNG 22.61% 49.11% 13.10% 15.18% 26 BHAKTAPUR 12.50% 44.48% 3.85% 39.17% 51 GULMI 3.96% 54.00% 12.50% 29.54%<br />
2 PANCHTHAR 39.70% 58.07% 0.63% 1.60% 27 KATHMANDU 29.44% 43.98% 4.70% 21.88% 52 RUKUM 5.32% 4.34% 1.94% 88.40%<br />
3 ILAM 87.44% 12.56% 28 NUWAKOT 3.49% 32.15% 8.19% 56.17% 53 SALYAN 28.84% 55.73% 3.64% 11.80%<br />
4 JHAPA 99.99% 0.01% 29 RASUWA 43.39% 33.29% 3.28% 20.05% 54 ROLPA 3.68% 40.99% 11.72% 43.61%<br />
5 MORANG 99.96% 0.04% 30 DHADING 7.88% 30.08% 5.24% 56.80% 55 PYUTHAN 21.51% 56.31% 9.75% 12.43%<br />
6 SUNSARI 93.89% 6.11% 31 MAKAWANPUR 48.40% 40.72% 3.64% 7.24% 56 DANG 94.44% 5.56%<br />
7 DHANKUTA 39.44% 59.69% 0.35% 0.52% 32 RAUTAHAT 95.50% 4.50% 57 BANKE 99.71% 0.29%<br />
8 TERHATHUM 17.85% 78.85% 1.42% 1.88% 33 BARA 94.61% 5.39% 58 BARDIYA 99.16% 0.84%<br />
9 SANKHUWASABHA 15.39% 40.01% 10.68% 33.92% 34 PARSA 99.45% 0.55% 59 SURKHET 41.00% 52.42% 4.46% 2.12%<br />
10 BHOJPUR 10.32% 59.09% 5.41% 25.17% 35 CHITAWAN 79.56% 10.80% 1.91% 7.74% 60 JAJARKOT 3.25% 12.08% 1.94% 82.73%<br />
11 SOLUKHUMBU 34.64% 24.85% 8.47% 32.04% 36 GORKHA 48.68% 19.69% 2.08% 29.55% 61 DAILEKH 3.24% 40.80% 4.07% 51.89%<br />
12 KHOTANG 4.57% 47.43% 10.77% 37.23% 37 LAMJUNG 9.02% 33.33% 9.60% 48.04% 62 DOLPA 60.70% 25.49% 2.09% 11.72%<br />
13 OKHALDHUNGA 0.35% 10.71% 1.69% 87.25% 38 MANANG 62.90% 31.64% 1.71% 3.75% 63 JUMLA 21.88% 44.04% 8.79% 25.28%<br />
14 UDAYAPUR 30.79% 40.11% 5.93% 23.17% 39 KASKI 19.78% 18.05% 4.29% 57.89% 64 KALIKOT 0.59% 12.56% 3.73% 83.12%<br />
15 SAPTARI 93.43% 6.02% 0.24% 0.31% 40 TANAHU 4.32% 33.28% 4.84% 57.57% 65 MUGU 73.94% 21.69% 1.56% 2.82%<br />
16 SIRAHA 68.37% 22.84% 1.76% 7.02% 41 SYANGJA 6.14% 36.35% 5.04% 52.47% 66 HUMLA 92.70% 6.44% 0.77% 0.09%<br />
17 DHANUSHA 60.11% 30.77% 2.19% 6.92% 42 PARBAT 0.83% 17.50% 2.39% 79.28% 67 BAJHANG 10.80% 28.29% 2.72% 58.19%<br />
18 MAHOTTARI 77.33% 18.45% 2.98% 1.25% 43 BAGLUNG 0.39% 6.53% 2.60% 90.48% 68 BAJURA 18.53% 23.80% 2.48% 55.19%<br />
19 SARLAHI 88.84% 10.13% 0.36% 0.67% 44 MYAGDI 22.30% 7.38% 1.29% 69.03% 69 ACHHAM 2.69% 46.44% 12.42% 38.46%<br />
20 SINDHULI 13.22% 35.30% 4.64% 46.84% 45 MUSTANG 62.70% 20.34% 2.87% 14.09% 70 DOTI 40.22% 45.77% 6.72% 7.28%<br />
21 RAMECHHAP 4.55% 17.25% 8.02% 70.19% 46 PALPA 28.37% 59.93% 11.23% 0.47% 71 KAILALI 74.27% 25.73%<br />
22 DOLAKHA 19.47% 36.68% 7.28% 36.57% 47 NAWALPARASI 72.36% 24.39% 2.17% 1.09% 72 KANCHANPUR 94.32% 5.68%<br />
23 SINDHUPALCHOK 14.78% 40.14% 6.50% 38.59% 48 RUPANDEHI 97.80% 2.20% 73 DADELDHURA 58.76% 37.60% 0.28% 3.36%<br />
24 KABHREPALANCHOK 6.82% 33.07% 5.99% 54.13% 49 KAPILBASTU 99.86% 0.14% 74 BAITADI 8.49% 42.91% 5.26% 43.34%<br />
25 LALITPUR 17.07% 41.96% 11.11% 29.86% 50 ARGHAKHANCHI 52.24% 42.90% 4.85% 0.02% 75 DARCHULA 8.85% 23.96% 2.63% 64.55%<br />
3.3.7 SPECIAL REMARKS<br />
Landslide inventory in <strong>Nepal</strong> had been prepared by Department of Mines and Geology, Government of<br />
<strong>Nepal</strong>. However, the compiled data are limited which covers smaller areas of the country. The site<br />
specific comprehensive study has been carried out by the department. However, the data is limited to<br />
analyze landslides <strong>for</strong> the whole country. There<strong>for</strong>e the project is applying another rating system as<br />
proposed by NGI <strong>for</strong> landslide hazard assessment with more simple and reliable approach.<br />
3.3.8 RECOMMENDATIONS<br />
• To obtain site specific detailed landslides hazard assessment triggered by precipitation, there is a<br />
requirement of continuous rainfall monitoring. Due to lack of resources, the data is not available<br />
<strong>for</strong> whole country. It is recommended to install automatic rain gauge stations at strategic<br />
locations, which will help in complementing landslide hazard assessment.<br />
• Land use and land cover plays important role in developing landslide hazard maps. There is a<br />
need <strong>for</strong> upgrading the existing land use and land cover maps.<br />
.<br />
Table 3.7. Districts area percentage distribution of precipitation induced landslide.<br />
District Negligible Low Medium High District Negligible Low Medium High District Negligible Low Medium High<br />
1 TAPLEJUNG 16.97% 58.30% 21.02% 3.70% 26 BHAKTAPUR 17.25% 65.09% 14.57% 3.09% 51 GULMI 2.77% 25.27% 55.95% 16.01%<br />
2 PANCHTHAR 1.75% 31.81% 47.09% 19.35% 27 KATHMANDU 48.09% 40.47% 8.89% 2.55% 52 RUKUM 6.53% 19.39% 51.15% 22.94%<br />
3 ILAM 2.98% 19.75% 53.14% 24.12% 28 NUWAKOT 17.36% 47.82% 31.34% 3.48% 53 SALYAN 4.48% 32.61% 51.42% 11.49%<br />
4 JHAPA 72.52% 24.88% 1.78% 0.82% 29 RASUWA 25.46% 32.74% 31.32% 10.48% 54 ROLPA 1.65% 22.56% 62.12% 13.67%<br />
5 MORANG 59.19% 24.36% 9.70% 6.75% 30 DHADING 11.26% 35.55% 45.42% 7.78% 55 PYUTHAN 4.95% 23.61% 56.00% 15.44%<br />
6 SUNSARI 67.88% 24.24% 5.69% 2.19% 31 MAKAWANPUR 16.50% 51.18% 25.94% 6.38% 56 DANG 36.49% 38.12% 19.32% 6.08%<br />
7 DHANKUTA 5.87% 51.76% 37.69% 4.68% 32 RAUTAHAT 74.95% 20.84% 3.94% 0.26% 57 BANKE 53.44% 34.84% 8.48% 3.24%<br />
8 TERHATHUM 2.10% 41.14% 44.22% 12.54% 33 BARA 64.14% 30.38% 4.73% 0.75% 58 BARDIYA 63.20% 22.35% 11.79% 2.66%<br />
9 SANKHUWASABHA 16.25% 62.02% 21.74% 0.00% 34 PARSA 51.78% 45.88% 2.18% 0.16% 59 SURKHET 13.32% 31.23% 42.87% 12.58%<br />
10 BHOJPUR 11.35% 51.04% 36.74% 0.86% 35 CHITAWAN 35.12% 41.40% 17.28% 6.20% 60 JAJARKOT 5.22% 25.66% 58.97% 10.15%<br />
11 SOLUKHUMBU 30.21% 56.97% 11.84% 0.99% 36 GORKHA 29.14% 36.64% 26.35% 7.87% 61 DAILEKH 5.42% 40.12% 53.93% 0.54%<br />
12 KHOTANG 6.49% 69.42% 24.07% 0.02% 37 LAMJUNG 10.78% 53.77% 27.68% 7.76% 62 DOLPA 20.20% 24.97% 37.91% 16.91%<br />
13 OKHALDHUNGA 3.15% 38.63% 57.27% 0.95% 38 MANANG 53.25% 19.64% 22.34% 4.77% 63 JUMLA 11.06% 43.42% 39.90% 5.62%<br />
14 UDAYAPUR 31.49% 37.57% 26.14% 4.80% 39 KASKI 25.24% 41.27% 30.19% 3.30% 64 KALIKOT 2.39% 40.14% 51.02% 6.46%<br />
15 SAPTARI 74.48% 23.02% 2.07% 0.42% 40 TANAHU 8.51% 22.17% 43.36% 25.95% 65 MUGU 17.85% 40.43% 35.01% 6.71%<br />
16 SIRAHA 70.05% 25.09% 4.42% 0.44% 41 SYANGJA 4.85% 20.32% 47.54% 27.29% 66 HUMLA 16.02% 42.34% 34.55% 7.10%<br />
17 DHANUSHA 73.61% 24.28% 2.04% 0.07% 42 PARBAT 2.55% 36.88% 54.78% 5.80% 67 BAJHANG 6.35% 34.16% 46.32% 13.18%<br />
18 MAHOTTARI 69.91% 28.72% 1.36% 0.02% 43 BAGLUNG 1.65% 18.55% 56.14% 23.67% 68 BAJURA 6.97% 33.55% 45.83% 13.65%<br />
19 SARLAHI 71.64% 24.94% 3.39% 0.03% 44 MYAGDI 23.30% 35.47% 36.22% 5.01% 69 ACHHAM 9.78% 42.33% 42.86% 5.03%<br />
20 SINDHULI 19.97% 41.27% 31.64% 7.11% 45 MUSTANG 23.40% 17.14% 31.74% 27.73% 70 DOTI 27.43% 49.76% 17.53% 5.28%<br />
21 RAMECHHAP 7.91% 49.26% 39.68% 3.15% 46 PALPA 3.27% 12.34% 36.53% 47.86% 71 KAILALI 37.11% 34.47% 21.20% 7.22%<br />
22 DOLAKHA 16.23% 65.50% 17.48% 0.79% 47 NAWALPARASI 36.05% 23.15% 21.65% 19.15% 72 KANCHANPUR 70.27% 20.82% 6.59% 2.33%<br />
23 SINDHUPALCHOK 15.34% 46.89% 34.16% 3.61% 48 RUPANDEHI 68.72% 21.31% 3.57% 6.40% 73 DADELDHURA 25.11% 45.14% 25.82% 3.93%<br />
24 KABHREPALANCHOK 14.80% 44.50% 39.30% 1.40% 49 KAPILBASTU 76.09% 17.68% 5.41% 0.83% 74 BAITADI 10.02% 29.36% 48.78% 11.83%<br />
25 LALITPUR 14.21% 49.69% 32.97% 3.13% 50 ARGHAKHANCHI 5.18% 26.61% 44.56% 23.65% 75 DARCHULA 12.48% 26.46% 46.29% 14.76%<br />
52
<strong>Nepal</strong> <strong>Hazard</strong> <strong>Risk</strong> <strong>Assessment</strong><br />
Figure 3.14. Earthquake induced landslide hazard map of <strong>Nepal</strong><br />
53
<strong>Nepal</strong> <strong>Hazard</strong> <strong>Risk</strong> <strong>Assessment</strong><br />
Figure 3.15. Precipitation induced landslide hazard map of <strong>Nepal</strong><br />
54
<strong>Nepal</strong> <strong>Hazard</strong> <strong>Risk</strong> <strong>Assessment</strong><br />
3.4 FLOOD HAZARD ASSESSMENT<br />
3.4.1 MAP CONTENT<br />
Flood hazard maps have been developed <strong>for</strong> most frequent flood prone river basins. In close consultation<br />
with the national focal departments <strong>for</strong> flood mitigation i.e., Department of Meteorology and Hydrology<br />
(DMH) and Department of Water Induced <strong>Disaster</strong> Prevention (DWIDP), seven rivers have been<br />
identified <strong>for</strong> flood hazard and risk assessment. These Rivers are Rapti, Babai, Bagmati, Narayani,<br />
Tinau, Kankai and Kamala. The flood hazard maps show the flood inundation and flood water depth wrt<br />
various return period scenarios. These return periods are 10 years, 25 years, 50 years, 100 years and 500<br />
years. In common terms, bigger the return period, worst is the flood scenario. The flood inundation area<br />
<strong>for</strong> particular scenario has been indicated in square kilometers. The results of the flood hazard maps are<br />
shown in Figure 3.27 to Figure 3.33.<br />
3.4.2 APPLICATION OF HAZARD MAPS IN DISASTER RISK MANAGEMENT<br />
The flood hazard maps have been developed <strong>for</strong> most flood prone rivers as state above. The purposes of<br />
developing these hazard maps are:<br />
• The maps will help and support policymakers, decision makers and planners <strong>for</strong> future developing<br />
master plans and safe development. The authority can take necessary actions to reduce the impacts<br />
on various economic sectors like agriculture, housing, tourism, industry, production etc.<br />
• The maps will help district administration and local authority to understand the severity of flood<br />
hazards in the area and develop necessary mitigation and preparedness plans.<br />
• The maps will help international and national relief agencies and humanitarian organizations to<br />
prioritize hazard disaster preparedness and mitigation interventions.<br />
• The maps will be referred by Department of Irrigation(DoI) and Department of Water Induced<br />
<strong>Disaster</strong> Preparedness (DWIDP) <strong>for</strong> prioritizing the actions <strong>for</strong> DRM.<br />
• The Department of Agriculture may use these maps to change the crop pattern and other non<br />
structural measures <strong>for</strong> reducing negative impacts on agriculture.<br />
3.4.3 DATA AVAILABILITY FROM SOURCES<br />
For extensive flood hazard mapping, detailed hydrological, meteorological, demographic and<br />
geomorphological data are required. It is also imperative to understand the scale of the flood hazard<br />
assessment. More precise and detailed data are required <strong>for</strong> site specific flood studies. The objective of<br />
the current project is to develop flood hazard maps at national level scale. The current hazard maps have<br />
been developed based on data available with focal departments and established authentic sources. The<br />
parameters are classified into following categories with their sources.<br />
a. Hydrological data (Source: Streamflow Summary (1962-2006) compiled by Hydrology<br />
Division, Department of Hydrology and Meteorology, Ministry of Environment, Science &<br />
Technology, Published in 2008)<br />
• Average monthly and yearly discharge <strong>for</strong> meteorology stations <strong>for</strong> identified rivers<br />
• Maximum monthly and yearly discharge <strong>for</strong> meteorology stations <strong>for</strong> identified rivers<br />
• Minimum monthly and yearly discharge <strong>for</strong> meteorology stations <strong>for</strong> identified rivers<br />
• Extreme discharge<br />
b. Geographical data (Elevation, Landuse, land cover) (Source : Department of Survey, <strong>Nepal</strong>)<br />
c. Elevation (source: SRTM, resolution 90Meters)(Source http://srtm.csi.cgiar.org/ )<br />
d. Elevation (Source : Aster resolution 30 Meters)(source http://asterweb.jpl.nasa.gov/gdem.asp)<br />
e. River network and catchments (Google Map and Department of Survey)<br />
Software required <strong>for</strong> Flood <strong>Hazard</strong> <strong>Assessment</strong><br />
The flood hazard assessment has been developed using several software like ArcGIS 9.3, HEC-GeoHMS<br />
(USACE, 2009a), HEC-GeoRAS (USACE, 2009b) and HEC-RAS (USACE, 2009c).<br />
The Geospatial Hydrologic Modeling Extension (HEC-GeoHMS) has been developed as a geospatial<br />
hydrology toolkit which uses ArcView and the Spatial Analyst extension to develop a number of<br />
hydrologic modeling inputs <strong>for</strong> the Hydrologic Engineering Center's Hydrologic Modeling System,<br />
HEC-HMS. ArcView GIS and its Spatial Analyst extension are available from the Environmental<br />
Systems Research Institute, Inc. (ESRI). Analyzing digital terrain data, HEC-GeoHMS trans<strong>for</strong>ms the<br />
drainage paths and watershed boundaries into a hydrologic data structure that represents the drainage<br />
network. The program allows users to visualize spatial in<strong>for</strong>mation, document watershed characteristics,<br />
per<strong>for</strong>m spatial analysis, and delineate subbasins and streams.<br />
HEC-GeoRAS is a set of procedures, tools, and utilities <strong>for</strong> processing geospatial data in ArcGIS using a<br />
graphical user interface (GUI). The interface allows the preparation of geometric data <strong>for</strong> import into<br />
HEC-RAS and processes simulation results exported from HEC-RAS. To create the import file, the user<br />
must have an existing digital terrain model (DTM) of the river system in the ArcInfo TIN <strong>for</strong>mat. The<br />
user creates a series of line themes pertinent to developing geometric data <strong>for</strong> HEC-RAS. The themes<br />
created are the Stream Centerline, Flow Path Centerlines (optional), Main Channel Banks (optional), and<br />
Cross Section Cut Lines referred to as the RAS Themes.<br />
HEC-RAS is designed to per<strong>for</strong>m one-dimensional hydraulic calculations <strong>for</strong> a full network of natural<br />
and constructed channels. The HEC-RAS system contains four one-dimensional river analysis<br />
components <strong>for</strong>: (1) steady flow water surface profile computations; (2) unsteady flow simulation; (3)<br />
movable boundary sediment transport computations; and (4) water quality analysis. A key element is that<br />
all four components use a common geometric data representation and common geometric and hydraulic<br />
computation routines.<br />
3.4.4 METHODOLOGY FOR FLOOD HAZARD MAPPING<br />
Figure 3.1 shows the methodology <strong>for</strong> mapping the flood inundation area and depth <strong>for</strong> various return<br />
periods. The methodology <strong>for</strong> flood hazard mapping has been developed based on secondary available<br />
data from various authentic sources like DOS, DWIDP, DMH and ICIMOD. The methodology largely<br />
used software Hec-GeoRAS, Hec-GoHMS, Hec-RAS and ArcGIS 9.3 as stated above. The creation of<br />
river basin and river profile has been validated using Google-map images of the river basin. The<br />
following are the steps used in the development of flood inundation maps.<br />
55
<strong>Nepal</strong> <strong>Hazard</strong> <strong>Risk</strong> <strong>Assessment</strong><br />
‐ Extraction and profiling of river and basin from Aster data using HEC-GeoHMS<br />
‐ Creation of river center line, bank line, cross section in GIS plat<strong>for</strong>m by using HEC-GeoRAS<br />
‐ Estimation of floods at different return periods (this analysis uses five different return periods; 10,<br />
25, 50, 100 and 500 years) <strong>for</strong> each river using Extreme Type I distribution (Gambel distribution).<br />
‐ Computation of flood levels using HEC-RAS.<br />
‐ Export of the result from HEC-RAS into GIS plat<strong>for</strong>m <strong>for</strong> mapping of flood inundation areas.<br />
‐ Development of flood inundation maps (area and depth).<br />
‐ Based on the proposed methodology, the flood hazard maps <strong>for</strong> specified rivers have been developed<br />
and presented in Figure 3.27 to Figure 3.33.<br />
• Area and depth of inundation <strong>for</strong> particular return period. Each color of flood inundation area<br />
represents different level of flood depth.<br />
‐ Light yellow : Depth below 0.3 meter<br />
‐ Dark yellow : Depth between 0.3 to 1 meter<br />
‐ Pink: Depth between 1 to 2 meter<br />
‐ Blue: Depth above 2 meter<br />
3.4.6 ANALYSIS OF HAZARD ASSESSMENT<br />
The flood hazard maps show areas of inundation and flood depths in their river basins. The flood hazard<br />
maps <strong>for</strong> different return periods were overlaid on district maps. The result is providing area and depth<br />
of flood water covered in respective districts. For analysis purpose, the flood water depth and area<br />
covered in various districts were worked out <strong>for</strong> all the identified seven river basins. There are totally 21<br />
districts covered under the different return period flood scenarios.<br />
The districts, Sankhuasabha, Saptari, Sarlahi, Taplejung, Terhathum and Udaypur will be largely<br />
affected by 10 year return period floods of flood depths ranging from 0.3 to 1.0 m. For 1.0 to 2.0 m<br />
depth, larger area is affected in Khotang, Panchthar, Sankhuasabha, Saptari, Sarlahi, Taplejung,<br />
Terhathum and Udaypur. Similarly <strong>for</strong> more than 2 m depth, Bhojpur, Dhanuka, Ilam, Jhapa, Khotang,<br />
Sankhuasabha, Saptari, Sarlahi, Sindhuli, Taplejung, Terhathum and Udaypur will be affected. The<br />
details of area coverage are shown in Figure 3.17. Similar observations have been found <strong>for</strong> other<br />
increased return periods too. Return period is proportional to flood coverage area. As the return period is<br />
increasing from 10 to 500 years, the coverage areas <strong>for</strong> flood are increases in proportion. Refer Figure<br />
3.18 to Figure 3.21 <strong>for</strong> other return periods.<br />
Flood hazard mapping <strong>for</strong> seven rivers indicate that Jhapa, Bardiya, Rupandehi, Ilam, Siraha, Dhanusha,<br />
Lalitpur, Dang, Sarlahi, Chitawan, Bhaktapur, Banke, Kathmandu, Nawalparasi, Rautahat districts are<br />
more prone to floods. A large part of these districts are inundated due to various flood scenarios. The<br />
details are presented in Figure 3.22 to Figure 3.26.<br />
3.4.5 HOW TO READ THE MAP<br />
Figure 3.16.Flowchart showing the methodology <strong>for</strong> flood hazard assessment<br />
Each river flood hazard map shows the following:<br />
• National and district boundaries<br />
• River network line<br />
Further analysis was carried out <strong>for</strong> each river basin to identify the most flood prone districts and their<br />
extents of inundation. Figure 3.27 explains the flood inundation caused by Rapti River. It shows that<br />
Banke and Dang are most affected. Figure 3.28 reveals show the districts inundated due to Tinau River.<br />
This river largely inundates Agrakanchi, Banke and Dang. Figure 3.29 represents the flood inundation<br />
area of Babai River. It shows that due to flood inundation, Bardiya and Dang districts are largely<br />
affected. Figure 3.30 reveals the flood inundation area due to various scenarios of floods in Bagmati<br />
River. The area coverage by Bagmati River largely covers major developed districts of <strong>Nepal</strong> i.e.,<br />
Kathmandu, Lalitpur, Rautahat, Bhaktapur, Makwanpur, Sarlahi and Sindhuli. Among all stated districts,<br />
the Bagmati floods are largely affecting Rautahat, Kathmandu, Bhaktapur and Sarlahi. Figure 3.31<br />
explains presents the flood inundation <strong>for</strong> the five scenarios at Kamala River. The flood is affecting<br />
Dhanusa, Siraha and Udaypur, where more area is inundated in first two districts. Figure 3.32 shows the<br />
flood inundation areas caused by Kankai River. Two districts Ilam and Jhapa are affected by the floods.<br />
Figure 3.33 explains inundation of Narayani basin covering Chitwan and Nawalparasi. Large areas in<br />
both districts are affected by floods. .<br />
56
<strong>Nepal</strong> <strong>Hazard</strong> <strong>Risk</strong> <strong>Assessment</strong><br />
Figure 3.17. Flood inundation causes by all identified rivers <strong>for</strong> 10 years return period<br />
Figure 3.19.Flood inundation causes by all identified rivers <strong>for</strong> 50 years return period<br />
Figure 3.18.Flood inundation causes by all identified rivers <strong>for</strong> 25 years return period<br />
Figure 3.20.Flood inundation causes by all identified rivers <strong>for</strong> 100 years return period<br />
57
<strong>Nepal</strong> <strong>Hazard</strong> <strong>Risk</strong> <strong>Assessment</strong><br />
Figure 3.21.Flood inundation causes by all identified rivers <strong>for</strong> 500 years return period<br />
Figure 3.23.Percentage of flood hazard area with respect to district area at 25 years return period<br />
Figure 3.22.Percentage of flood hazard area with respect to district area at 10 years return period<br />
Figure 3.24.Percentage of flood hazard area with respect to district area at 50 years return period<br />
58
<strong>Nepal</strong> <strong>Hazard</strong> <strong>Risk</strong> <strong>Assessment</strong><br />
3.4.7 RECOMMENDATIONS<br />
• The profile of flood hazard maps <strong>for</strong> Babai, Bagmati, Rapti, Kamala, Kankai, Tinau and Narayani<br />
rivers are presented in Figure 3.27 to Figure 3.33 respectively.<br />
• The flood hazard maps have been developed at national level scale using secondary data. The data<br />
used <strong>for</strong> the modeling is primarily from DMH, DWIDP and DOS. The current flood hazard maps<br />
show a broader picture of area under flood inundation. However, it is imperative to carry out site<br />
specific flood hazard mapping <strong>for</strong> local level planning.<br />
• The hydrological and hydro-meteorological data <strong>for</strong> flood hazard assessment are scarce and requires<br />
ef<strong>for</strong>ts from departments to collect and compile <strong>for</strong> precise flood hazard mapping.<br />
• The current flood hazard maps have been developed <strong>for</strong> most important river basins that are<br />
frequently flooded and affected life and properties. Though there are many rivers, which do not<br />
expose life and properties much, it was felt that carrying out flood hazard maps <strong>for</strong> such basins are<br />
also important.<br />
Figure 3.25.Percentage of flood hazard area with respect to district area at 100 years return period<br />
• Since <strong>Nepal</strong> is frequently affected by floods, it is necessary to develop detailed flood inundation<br />
maps <strong>for</strong> the country. The inundation maps will help policy makers and decision makers to<br />
understand the severity of floods. They will also help in damage and loss assessment, and relief<br />
operations. The actual inundation maps will help the scientific community to validate the flood<br />
hazard maps. UNOSAT supports the activities involved in the development of hazard and inundation<br />
maps. The UNOSAT is the UN Institute <strong>for</strong> Training and Research (UNITAR) Operational Satellite<br />
Applications Programme, implemented in co-operation with the European Organization <strong>for</strong> Nuclear<br />
Research (CERN).<br />
• DWIDP and DMH along with other agencies like ICIMOD have carried out several pilot based flood<br />
hazard mapping <strong>for</strong> important rivers. An approach is required to integrate these maps at suitable<br />
scale and used <strong>for</strong> disaster resilient development.<br />
• The floods hazard map show that most developed districts like Lalitpur, Kathmandu, Bhaktapur and<br />
other districts contributing to economy are coming under flood inundation. There is a dire need to<br />
introduce disaster preparedness and mitigation policies <strong>for</strong> reducing the flood risk in most developed<br />
but flood affected areas.<br />
Figure 3.26.Percentage of flood hazard area with respect to district area at 500 years return period<br />
59
<strong>Nepal</strong> <strong>Hazard</strong> <strong>Risk</strong> <strong>Assessment</strong><br />
Figure 3.27.Rapti flood inundation mapping <strong>for</strong> 10 years, 25 years, 50 years, 100 years and 500 years return periods<br />
60
<strong>Nepal</strong> <strong>Hazard</strong> <strong>Risk</strong> <strong>Assessment</strong><br />
Figure 3.28.Tinau flood inundation mapping <strong>for</strong> 10 years, 25 years, 50 years, 100 years and 500 years return periods<br />
61
<strong>Nepal</strong> <strong>Hazard</strong> <strong>Risk</strong> <strong>Assessment</strong><br />
Figure 3.29.Babai flood inundation mapping <strong>for</strong> 10 years, 25 years, 50 years, 100 years and 500 years return periods<br />
62
<strong>Nepal</strong> <strong>Hazard</strong> <strong>Risk</strong> <strong>Assessment</strong><br />
Figure 3.30.Bagmati flood inundation mapping <strong>for</strong> 10 years, 25 years, 50 years, 100 years and 500 years return periods<br />
63
<strong>Nepal</strong> <strong>Hazard</strong> <strong>Risk</strong> <strong>Assessment</strong><br />
Figure 3.31.Kamala flood inundation mapping <strong>for</strong> 10 years, 25 years, 50 years, 100 years and 500 years return periods<br />
64
<strong>Nepal</strong> <strong>Hazard</strong> <strong>Risk</strong> <strong>Assessment</strong><br />
Figure 3.32.Kankai flood inundation mapping <strong>for</strong> 10 years, 25 years, 50 years, 100 years and 500 years return periods<br />
65
<strong>Nepal</strong> <strong>Hazard</strong> <strong>Risk</strong> <strong>Assessment</strong><br />
Figure 3.33.Narayani flood inundation mapping <strong>for</strong> 10 years, 25 years, 50 years, 100 years and 500 years return periods<br />
66
<strong>Nepal</strong> <strong>Hazard</strong> <strong>Risk</strong> <strong>Assessment</strong><br />
3.5 DROUGHT HAZARD ASSESSMENT<br />
3.5.1 MAP CONTENT<br />
The map shows set of drought susceptibility maps developed based on Standard Precipitation Index<br />
(SPI). The SPI has been developed on the data collected from uni<strong>for</strong>mly distributed 40 meteorological<br />
stations across the country <strong>for</strong> the time span of more than three decades. The susceptibility maps have<br />
been developed based on the probability of occurrence of droughts with class of severity such as<br />
moderate, severe, extreme and moderate to extreme. The map shows the variation of drought in various<br />
seasons i.e. winter, Pre monsoon, Monsoon and Post Monsoon.<br />
3.5.2 APPLICATION OF MAPS WITH RESPECT TO DISASTER RISK MANAGEMENT<br />
The maps will <strong>for</strong>m the basis <strong>for</strong> understanding the drought prone areas and temporal variation of<br />
drought in various regions. Various focal sectors like agriculture, water resources, disaster management<br />
and Irrigation may use the maps <strong>for</strong> water and food security in the region, development of national and<br />
regional plan <strong>for</strong> sustained agricultural development, Assess the climate change impact and develop the<br />
strategy <strong>for</strong> redefining the cropping pattern and water conservation. The maps will help central and local<br />
government to take proactive measures <strong>for</strong> allocation of resources and relief management.<br />
3.5.3 DATA AVAILABILITY FROM SOURCES<br />
Reliable supporting documents, maps, appropriate models and methods <strong>for</strong> drought assessment were<br />
collected from different sources. Based on data quality, quantity and their spatial distribution overall 40<br />
stations were selected as representative stations covering the entire country. The necessary climatic data<br />
required <strong>for</strong> computing the indices, i.e., monthly total rainfall and monthly mean temperature were<br />
collected from Department of Hydrology and Meteorology <strong>for</strong> the period of 1977-2007. Some of the<br />
sources <strong>for</strong> data is as below:<br />
• Central Bureau Statistics (CBS), 2005. Statistical Year book, <strong>Nepal</strong>.<br />
• DHM, 2001. Weekly Dry Spell Atlas of <strong>Nepal</strong>: Final Report.<br />
• DHM, 2001-2009. Preliminary monthly weather summary of <strong>Nepal</strong> from 2001 to 2008, Department<br />
of Hydrology and Meteorology.<br />
• DHM, 2009. Dry and Warm Winter 2009, Climate Section, Internal report of Department of<br />
Hydrology and Meteorology.<br />
• Gibbs, W. J. and Maher, J. V., 1967. Rainfall deciles as drought indicators. Bureau of Meteorology<br />
Bulletin, No. 48, Commonwealth of Australia, Melbourne.<br />
• National Climatic Data Center, 2006. Climate of 2006, U.S. Standardized Precipitation Index.<br />
• NDMC, 2009. Monitoring Drought. National Drought Mitigation Centre, University of Nebraska–Lincoln<br />
• Thornthwaite, C. W., 1948: An approach toward a rational classification of climate. Geographical<br />
Review, 38, 55–94.<br />
• World Meteorological Organization, 2005. Meteoworld (weather. Climate. Water), WMO , August<br />
2005.<br />
• World Meteorological Organization, 1992. International Meteorological Vocabulary, WMO Report<br />
NO. 182, 2nd and. WMO: Geneva; 784.<br />
3.5.4 SPECIAL REMARK<br />
• The drought assessment has been carried out using two most practiced Indices namely Standard<br />
Precipitation Index (SPI) and Soil Moisture Index (SMI). The indices have been developed based on<br />
rainfall collected from uni<strong>for</strong>mly distributed meteorological stations and temperature data.<br />
• The drought assessment results from both indices are having similar outcomes. It is observed that<br />
most of the severe to extreme droughts are occurring in winters.<br />
3.5.5 METHODOLOGY<br />
The drought hazard assessment methodology is combined of SPI and SMI. The flowchart in Figure 3.34<br />
shows the process of drought hazard assessment. The SPI has many advantages over other drought<br />
indices, such as the Palmer approach, which requires more variables. The details of the methodology and<br />
outcomes may be referred at Annexure-3.<br />
SPI<br />
Monthly Precipitation Data<br />
Format Data to run the model<br />
(SPI_SL_6.exe)<br />
Monthly and seasonal SPI values<br />
Economy impact<br />
Drought Index: SPI+SMI<br />
Monthly Mean Precipitation<br />
and Temperature Data<br />
SOIL MOISTURE/WATER<br />
SURPLUS/DEFICIENCY<br />
SOIL MOISTURE/WATER<br />
DEFICIENCY<br />
Potential Drought?<br />
Social impact<br />
Compute Heat Index and<br />
Potential evapotranpiration<br />
SMI (I m )= 100(P ‐ PET)/PET<br />
Monthly and seasonal SMI values<br />
Environmental impact<br />
Figure 3.34. Flow chart of drought index computation and its impact in different sectors.<br />
67
<strong>Nepal</strong> <strong>Hazard</strong> <strong>Risk</strong> <strong>Assessment</strong><br />
3.5.6 HOW TO READ THIS MAP<br />
Drought susceptibility maps have been prepared based on the probability of occurrence of droughts<br />
(moderate, severe, extreme and moderate to extreme) in identified stations. The climatological drought<br />
susceptibility maps in different seasons show in terms of classification from low to high drought<br />
susceptible areas in four seasons. In empirical manner, drought low susceptible and high drought<br />
susceptible areas has been categorized as areas having 15% to 20% and more than 20% probabilities<br />
respectively, based on the analysis of probability of occurrence of drought at various stations. These<br />
areas are listed in Table 3.8 from the figures one can easily locate low to high susceptible areas in<br />
different seasons. The hazard severity scale has been shown below. The red colour shows high<br />
susceptibility and grey shows the no drought condition.<br />
68
<strong>Nepal</strong> <strong>Hazard</strong> <strong>Risk</strong> <strong>Assessment</strong><br />
30<br />
30<br />
29<br />
29<br />
28<br />
28<br />
27<br />
27<br />
(a) 80 81 82 83 84 85 86 87 88 (b)<br />
80 81 82 83 84 85 86 87 88<br />
30<br />
30<br />
29<br />
29<br />
28<br />
28<br />
27<br />
27<br />
(c) 80 81 82 83 84 85 86 87 88 (d)<br />
80 81 82 83 84 85 86 87 88<br />
-5No drought 0 5 10 15 20 25<br />
Figure 3.35.Moderate drought susceptibility maps <strong>for</strong> (a) Winter (b) Premonsoon (c) Monsoon and (d) Postmonsoon seasons.<br />
69
<strong>Nepal</strong> <strong>Hazard</strong> <strong>Risk</strong> <strong>Assessment</strong><br />
30<br />
30<br />
29<br />
29<br />
28<br />
28<br />
27<br />
27<br />
(a) 80 81 82 83 84 85 86 87 88<br />
(b)<br />
80 81 82 83 84 85 86 87 88<br />
30<br />
30<br />
29<br />
29<br />
28<br />
28<br />
27<br />
27<br />
(c) 80 81 82 83 84 85 86 87 88<br />
(d)<br />
80 81 82 83 84 85 86 87 88<br />
-5No drought 0 5 10 15 20 25<br />
Figure 3.36.Severe drought susceptibility maps <strong>for</strong> (a) Winter (b) Premonsoon (c) Monsoon and (d)<br />
70
<strong>Nepal</strong> <strong>Hazard</strong> <strong>Risk</strong> <strong>Assessment</strong><br />
30<br />
30<br />
29<br />
29<br />
28<br />
28<br />
27<br />
27<br />
(a)<br />
80 81 82 83 84 85 86 87 88<br />
(b)<br />
80 81 82 83 84 85 86 87 88<br />
30<br />
30<br />
29<br />
29<br />
28<br />
28<br />
27<br />
27<br />
(c) 80 81 82 83 84 85 86 87 88<br />
(d)<br />
80 81 82 83 84 85 86 87 88<br />
-5No drought 0 5 10 15 20 25<br />
Figure 3.37.Extreme drought susceptibility maps <strong>for</strong> (a) Winter (b) Premonsoon (c) Monsoon and (d) Postmonsoon seasons<br />
71
<strong>Nepal</strong> <strong>Hazard</strong> <strong>Risk</strong> <strong>Assessment</strong><br />
(a)<br />
(b)<br />
30<br />
30<br />
29<br />
29<br />
28<br />
28<br />
27<br />
27<br />
80 81 82 83 84 85 86 87 88<br />
80 81 82 83 84 85 86 87 88<br />
(c)<br />
(d)<br />
30<br />
30<br />
29<br />
29<br />
28<br />
28<br />
27<br />
27<br />
80 81 82 83 84 85 86 87 88<br />
80 81 82 83 84 85 86 87 88<br />
0 5 10 15 20 25<br />
Figure 3.38.Moderate to extreme drought susceptibility maps <strong>for</strong> (a) winter (b) premonsoon (c) monsoon and d) postmonsoon<br />
72
<strong>Nepal</strong> <strong>Hazard</strong> <strong>Risk</strong> <strong>Assessment</strong><br />
Severity of<br />
Drought<br />
Moderate<br />
Drought<br />
Winter<br />
Season<br />
Premonsoon<br />
Table 3.8. Drought susceptibility.<br />
Low susceptibility<br />
Daman, Tulsipur, Tarahara and<br />
their surroundings<br />
Jiri, Khairinitar, Jumla and their<br />
surroundings<br />
Monsoon Tarahara, Rampur and<br />
surroundings<br />
Postmonsoon Jiri, Nagarkot, Hetauda,<br />
Khairinitar, Gorkha, Chaurjhari<br />
Tar, Tulsipur and surroundings<br />
Severe Drought Winter <strong>Nepal</strong>ganj, Dhangadhi and<br />
surroundings<br />
Extreme<br />
Drought<br />
Moderate<br />
Extreme<br />
Drought<br />
to<br />
High<br />
susceptibility<br />
Nagarkot<br />
surrounding<br />
None<br />
None<br />
None<br />
None<br />
Premonsoon None None<br />
Monsoon None None<br />
Postmonsoon None None<br />
Winter Dhangadhi and surroundings None<br />
Premonsoon None None<br />
Monsoon None None<br />
Postmonsoon None None<br />
Winter<br />
Premonsoon<br />
Monsoon<br />
Postmonsoon<br />
Large parts of EDR, eastern half<br />
portion of CDR, small central<br />
portion of WDR, Southern parts<br />
of MWDR, western half of the<br />
FWDR<br />
Isolated spots in EDR, Large<br />
parts of CDR, Central and<br />
western parts of WDR, Almost<br />
entire MWDR, Southern parts of<br />
FWDR<br />
Nearly central parts of the EDR,<br />
Western half of CDR, Large<br />
parts of WDR and MWDR,<br />
western parts of FWDR<br />
Large parts of EDR and CDR,<br />
Southern half of WDR, Southeastern<br />
portion of MWDR,<br />
North-west parts of FWDR<br />
and<br />
Kailali,<br />
Kanchanpur, Dang,<br />
Nagarkot and<br />
surrounding areas<br />
<strong>Nepal</strong>ganj and<br />
surrounding areas,<br />
Parbat and<br />
surrounding areas,<br />
Dolakha district<br />
Gorkha, Tanahun,<br />
Chitawan districts<br />
Kavre, Adjoining<br />
areas of Bhaktapur,<br />
Dolakha and<br />
Sindhupalchowk<br />
3.5.7 CONCLUSION AND DISCUSSION<br />
Based on SPI criteria, the following remarkable conclusions on drought years can be drawn from the<br />
study. Droughts occurrences in different seasons in different years have been depicted in Table 3.9 and<br />
Figure 3.39 to Figure 3.42 Table and figures show that winter droughts were recorded in more number of<br />
stations recently thus indicating that the winter drought spreading in large parts of the country. More<br />
than 75% of the stations recorded droughts during the winter season year 1999 and 2006. No other<br />
seasons recorded droughts in such a large number of stations. Drought was recorded in as many as 50%-<br />
75% of the stations during winter of 2001, premonsoon of 1979 and monsoon of 1992. Most of the time,<br />
the droughts were recorded in less than half of the country.<br />
% of stations<br />
100<br />
90<br />
80<br />
70<br />
60<br />
50<br />
40<br />
30<br />
20<br />
10<br />
0<br />
Table 3.9. Seasonal Drought occurrence in different years<br />
% of<br />
stations<br />
Winter Premonsoon Monsoon Postmonsoon<br />
>75 1999, 2006 Nil Nil Nil<br />
50-75 2001 1979 1992, NI<br />
25-50 1985, 1993, 2000 1992, 1994, 1995, 1996, 2005 1977, 1979, 2006<br />
1981, 1984, 1988,<br />
1991, 1993, 2000<br />
10-25 1982, 1988, 1997<br />
1982, 1984, 1985, 1986,1989, 1980, 1982, 1983, 1985, 1989, 1980, 1997, 2003,<br />
1999, 2003<br />
1991, 1994, 1997, 2002, 2005 2006, 2007<br />
1977<br />
1978<br />
1979<br />
1980<br />
1981<br />
1982<br />
1983<br />
1984<br />
1985<br />
1986<br />
1987<br />
1988<br />
1989<br />
1990<br />
1991<br />
1992<br />
1993<br />
1994<br />
1995<br />
1996<br />
1997<br />
1998<br />
1999<br />
2000<br />
2001<br />
2002<br />
2003<br />
2004<br />
2005<br />
2006<br />
2007<br />
Year<br />
Figure 3.39. Drought occurrence in winter<br />
73
<strong>Nepal</strong> <strong>Hazard</strong> <strong>Risk</strong> <strong>Assessment</strong><br />
% of stations<br />
% of stations<br />
100<br />
90<br />
80<br />
70<br />
60<br />
50<br />
40<br />
30<br />
20<br />
10<br />
0<br />
100<br />
90<br />
80<br />
70<br />
60<br />
50<br />
40<br />
30<br />
20<br />
10<br />
0<br />
1977<br />
1978<br />
1979<br />
1980<br />
1981<br />
1982<br />
1983<br />
1984<br />
1985<br />
1986<br />
1987<br />
1988<br />
1989<br />
1990<br />
1991<br />
1992<br />
1993<br />
1994<br />
1995<br />
1996<br />
1997<br />
1998<br />
1999<br />
2000<br />
2001<br />
2002<br />
2003<br />
2004<br />
2005<br />
2006<br />
2007<br />
Year<br />
Figure 3.40. Drought occurrence in premonsoon<br />
SPI and SMI were used <strong>for</strong> drought analysis at seasonal scale. It is found that drought of all category<br />
occur in <strong>Nepal</strong> in all seasons. Moderate drought frequently occurs in all seasons. But severe and extreme<br />
droughts in comparison are less common. All categories of drought show increasing trend in winter<br />
season. During winter severe and extreme droughts were rare in past but it has been observed in many<br />
stations recently. It indicates that winter droughts are getting intense. During the premonsoon season,<br />
moderate drought show slightly increasing trend but the severe and extreme drought both showed<br />
decreasing trend. All categories of drought are decreasing in monsoon. From 2001 to 2007 the extreme<br />
drought was not recorded at all. It was also found that there is little correlation between severities of<br />
drought occurrence from one season to another season during a given period. From this it can be inferred<br />
that drought of extended duration (longer than a season) is not common.<br />
Climatologically drought probably is highest during premonsson and lowest during postmonsoon.<br />
However, winter season showed a large increase in the probability of drought occurrence in the recent<br />
decade.<br />
Western parts of the country are more drought prone specially during winter and premonsoon season.<br />
Analysis of soil moisture index shows that highest moisture surplus occurs during monsoon season<br />
where as there is highest moisture deficit during postmonsoon season. Severity of moisture deficit is<br />
highest in premonsoon season in western Tarai belt. In winter, there is moisture surplus in western half<br />
of the country but deficit in the eastern half.<br />
Figure 3.43 show the percentage of coverage of drought hazard area with respect to district area. Most of<br />
the districts are in moderate and low drought zone. There are few districts in high zone.<br />
Winter<br />
1977<br />
1978<br />
1979<br />
1980<br />
1981<br />
1982<br />
1983<br />
1984<br />
1985<br />
1986<br />
1987<br />
1988<br />
1989<br />
1990<br />
1991<br />
1992<br />
1993<br />
1994<br />
1995<br />
1996<br />
1997<br />
1998<br />
1999<br />
2000<br />
2001<br />
2002<br />
2003<br />
2004<br />
2005<br />
2006<br />
Year<br />
Figure 3.41. Drought occurrence in monsoon<br />
100<br />
90<br />
% of stations<br />
80<br />
70<br />
60<br />
50<br />
40<br />
30<br />
20<br />
10<br />
0<br />
Winter<br />
1977<br />
1978<br />
1979<br />
1980<br />
1981<br />
1982<br />
1983<br />
1984<br />
1985<br />
1986<br />
1987<br />
1988<br />
1989<br />
1990<br />
1991<br />
1992<br />
1993<br />
1994<br />
1995<br />
1996<br />
1997<br />
1998<br />
1999<br />
2000<br />
2001<br />
2002<br />
2003<br />
2004<br />
2005<br />
2006<br />
Year<br />
Figure 3.42. Drought occurrence in postmonsoon<br />
Figure 3.43. Percentage of coverage of drought area with respect to district area<br />
74
<strong>Nepal</strong> <strong>Hazard</strong> <strong>Risk</strong> <strong>Assessment</strong><br />
Finally, the output products of this study provide an essential step toward addressing the issue to drought<br />
vulnerability in the country and can be used in guide <strong>for</strong> drought management strategies <strong>for</strong> mitigation<br />
purposes. Identifying regional vulnerabilities can lead to adjustment in practices in water-dependent<br />
sectors and can help decision makers to take the drought into account from hazard perspective and<br />
include the concept of drought vulnerability into natural resource planning.<br />
Following recommendations are prescribed based on the present study:<br />
1. Emphasis should be given <strong>for</strong> Installation of the equipments to measure water holding capacity and<br />
wilting point (soil properties) of different type of soils of <strong>Nepal</strong> to calculate SMI directly.<br />
2. Study on wet and dry spells of one week, two weeks or three weeks and so on should be carried out<br />
to monitor agricultural drought.<br />
3. Develop Meteorological, Agricultural and Hydrological drought declaration criteria <strong>for</strong> <strong>Nepal</strong>.<br />
4. Study on drought in <strong>Nepal</strong> by using remote sensing data should be developed.<br />
5. The study has developed the threshold value of precipitation in various meteorological stations to<br />
indicate and provide necessary parameter contributing to drought assessment <strong>for</strong> various economic<br />
sectors.<br />
75
<strong>Nepal</strong> <strong>Hazard</strong> <strong>Risk</strong> <strong>Assessment</strong><br />
3.6 EPIDEMIC HAZARD ASSESSMENT<br />
<strong>Nepal</strong> is prone to wide range of diseases and epidemics. The Department of Health Services has<br />
compiled comprehensive disease and epidemic events under Health Management In<strong>for</strong>mation System.<br />
The reasons <strong>for</strong> epidemics are linked to several socio-economic factors, demographic profile,<br />
geographical locations and health infrastructure. Due to country’s varying geographical configuration,<br />
the temperature, climate and humidity changes from place to place. Because of acute shortage of water<br />
in hills and mountains leading to sanitation problems, displacement of people due to civil unrest<br />
compelling community to stay in crowded temporary accommodation, poor hygiene, Vector infestation,<br />
contaminated drinking water and food are few factors <strong>for</strong> outbreaks and diseases in the country. The<br />
recent authentic statistical data spells decline of outbreaks and diseases in the country. However, every<br />
year, outbreaks and diseases are reported. Thus it is important to study and analyze the trend of diseases<br />
and outbreaks <strong>for</strong> <strong>Nepal</strong>.<br />
3.6.1 MAP CONTENT<br />
In current susceptible mapping, the assessment have been categorized into two types i.e. diseases and<br />
outbreaks. For disease susceptibility assessment, eight diseases (Leprosy, Malaria, Tuberculosis (TB),<br />
Sexual Transmitted Infection (STI), Diarrhea, Acute Respiratory Infection (ARI), Filariasis and Kalazar)<br />
have been analyzed. The limited date is available <strong>for</strong> disease/ epidemics <strong>for</strong> all districts. The chronology<br />
of events is restricted to about 10-15 years. The each disease map shows specific disease /outbreak<br />
susceptible districts with certain severity, trend of disease/outbreaks in first three years and last three<br />
years. The developed maps are indicators of up/ down trends of specified diseases/ outbreaks.<br />
Similarly the susceptible maps are developed <strong>for</strong> all types of prevailing outbreaks including Typhoid,<br />
Influenza & ARI, Gastroenteritis and Hepatitis. Similarly susceptibility mapping and trends have been<br />
carried out <strong>for</strong> outbreaks.<br />
The diseases and health hazard in<strong>for</strong>mation are available at various sources. However, the authenticity is<br />
lying with Department of Health Services operated Health Management In<strong>for</strong>mation System (HMIS).<br />
DesInventar has also created larger database, collected the in<strong>for</strong>mation from various leading national<br />
newspapers like Gorakhapatra and others. Comparing the data of HMIS and DesInventar, it is found that<br />
trend is same in several cases but number of cases is not matching. The National Technical Group <strong>for</strong> the<br />
project has suggested to using HMIS data <strong>for</strong> further analysis. The data has been collected from various<br />
sources as below:<br />
• Health Management In<strong>for</strong>mation System(HMIS) Managed by Dept. of Health Services<br />
• DesInventar database<br />
• <strong>Nepal</strong> District Health Profiles-Baseline Date through Secondary Sources-published by<br />
World Health Organisation, Country office of <strong>Nepal</strong> & Office <strong>for</strong> the Coordination of<br />
Humanitarian Affairs(OCHA) December 2007<br />
• ED-DAT Website website reference http://www.emdat.be/<br />
• Population Data(2001), Bureau of Statistics, Government of <strong>Nepal</strong> Web site reference<br />
www.cbs.gov.np/<br />
3.6.4 SPECIAL REMARKS<br />
• At present, Health Management In<strong>for</strong>mation system is collecting, compiling comprehensive data on<br />
common diseases in the country since 1993. More than 15 years data is available.<br />
• The methodology <strong>for</strong> diseases / outbreaks mapping are based on exposure of community to specific<br />
diseases / outbreaks<br />
• The data retrieved from authentic sources are discrete <strong>for</strong> some districts. The reasons <strong>for</strong> discrete<br />
data is due to civil unrest in that year, inadequate in<strong>for</strong>mation at local level, unreported cases due to<br />
inaccessibility to the reporting station, poor diagnosis of problems etc.<br />
3.6.2 APPLICATION OF DISEASE AND OUTBREAK HAZARD MAPS WITH RESPECT TO<br />
DISASTER RISK MANAGEMENT<br />
• The susceptibility maps will provide necessary guidance to Department of Health and National<br />
Planning agencies <strong>for</strong> allocating necessary budget <strong>for</strong> eradication or reduction of diseases/ outbreaks.<br />
• Base on produced maps the national and district agencies will give special attention to health,<br />
hygiene, vector control, poverty and health infrastructure in more disease / outbreak susceptible<br />
districts.<br />
• The maps will be helpful <strong>for</strong> national and international health service agencies to provide necessary<br />
support to susceptible districts and region.<br />
• The susceptibility map renders additional dimensions to identify causative factors of diseases and<br />
outbreaks. For example frequent flooding in some low lying areas may lead to water and vector<br />
borne diseases.<br />
3.6.3 DATA AVAILABILITY FROM SOURCES<br />
3.6.5 METHODOLOGY<br />
The methodologies <strong>for</strong> disease / outbreak susceptibility maps have been prepared using the methodology<br />
shown in Figure 3.44.<br />
a. Collection of Data: The data related to number of cases, population, mortality are collected from<br />
authentic sources. The source of data collection may be referred at 3.6.3. The data is collected and<br />
validated <strong>for</strong> its authenticity. The database is generated <strong>for</strong> susceptibility mapping due to disease and<br />
outbreak.<br />
b. Development of Disease / Outbreak susceptibility maps:<br />
• The disease and outbreak data <strong>for</strong> each district has been collected <strong>for</strong> each year since 1993. The<br />
population growth has been further calculated through statistical projection methods on annual<br />
basis based on population data from Bureau of Statistics, Government of <strong>Nepal</strong>. The incidence<br />
index (II) has been developed, which is the simple ratio of diseases / outbreak cases reported in<br />
particular year and population at that year <strong>for</strong> specific district. This index is dimensionless.<br />
76
<strong>Nepal</strong> <strong>Hazard</strong> <strong>Risk</strong> <strong>Assessment</strong><br />
Number of cases reported <strong>for</strong> each class of Disease / outbreak in<br />
specific district in specific year<br />
Incidence Index (II) =<br />
Total population in specific district <strong>for</strong> specific year<br />
• The II has been calculated <strong>for</strong> each class of disease <strong>for</strong> each year. The regression analysis is<br />
carried out to get the generalized II <strong>for</strong> particular district <strong>for</strong> span of study period. The analysis<br />
has been further carried out <strong>for</strong> first and last three II and overall II <strong>for</strong> all districts. Based on<br />
these three II, the susceptibility has been developed <strong>for</strong> all districts. The details of susceptibility<br />
maps may be referred at Figure 3.46 to Figure 3.51<br />
• In case of Outbreaks, The data is not adequately available. The discrete data <strong>for</strong> outbreaks are<br />
available <strong>for</strong> only 5 years (2004-2008). In such limited data, regression modeling is not<br />
appropriate methods. The proposed methodology has carried out cumulative II <strong>for</strong> five years <strong>for</strong><br />
all district data and susceptibility map has been prepared. The outbreak susceptibility map is<br />
developed which shows II <strong>for</strong> all five years in each district.<br />
• The maps have been prepared and validated with Department of Health Services, which is the<br />
focal agency of Epidemiology.<br />
3.6.6 HOW TO READ THE MAP<br />
• The susceptibility map shows the trend of each disease/ outbreak. Background color of the map<br />
represent trend of 15 years disease/ outbreak since 1995 to 2008. The bar of each district represents<br />
trend of first three years and last three years of disease / outbreak trends. First three years trend bar<br />
is in red color and last three years are in blue color.<br />
• Outbreak map show incidence rate of each outbreak. Background color of the map represent<br />
cumulative of incidence rate of 5 years data from 2004 to 2008. The background shows the<br />
incidence rate of each outbreak per 10000 of population. The bar represent incidence rate <strong>for</strong> each<br />
single year. There are five different colors which represent each year. The indications are as below:<br />
Green color bar: incidence ratio per 10000 of population in year 2004<br />
Yellow color bar: incidence ratio per 10000 of population in year 2005<br />
Red color bar: incidence ratio per 10000 of population in year 2006<br />
Blue color bar: incidence ratio per 10000 of population in year 2007<br />
Purple color bar: incidence ratio per 10000 of population in year 2008<br />
3.6.7 ANALYSIS OF DISEASE / OUTBREAK ASSESSMENT<br />
Figure 3.45 show the trend analysis of eight diseases and four outbreaks. The trend of ARI, Diarrhea, TB<br />
and STI are increasing. However the trend of Leprosy, Malaria, Filariasis and Kalazar are decreasing.<br />
The analysis and observation of hazard assessment is as below:<br />
Taplejung and Humla. In recent past, more cases have been reported from Dadeldhura, Bardiya,<br />
Dolpa, Mustang, Surkhet, Kailali, Syangja, Sunsari and Jhapa.<br />
• Dolpa, Mustang, Achham, Humla, Dailekh, Bajura, Jajarkot, Mugu are more susceptible to<br />
Diarrhea. In 1993-1995, more cases were reported in Manang, Humla, Bajura, Mustang, Doti,<br />
Sunsari, Rasuwa, Lamjung, Khotang were reported more cases. However the new trend shows<br />
that Sunsari, Dailekh, Achham, Dolpa, Jajarkot, Salyan, Bajura, Darchula, Doti are reported with<br />
more cases.<br />
• Jhapa, Panchthar, Kanchanpur, Taplejung, Siraha, Banke, Kapilvastu, Parbat are more prone to<br />
Malaria diseases. During 1993-1995, more cases were reported in Kanchanpur, Mahottari, Kavre,<br />
Sindhupalchowk, Banke, Saptari, Dadeldhura and Surkhet. Recently more cases have been<br />
reported in Saptari, Kapilvastu, Makwanpur, Bara, Surkhet, Dang, Sindhuli and Sarlahi.<br />
• Bara, Kathmandu, Kapilvastu, Sarlahi, Mahottari, Surkhet, Banke, Rautahat, Arghakhanchi,<br />
Bajhang, Jajarkot, Bajura are highly prone to Tuberculosis. During 1993-1995, uptrend was<br />
shown in Banke, Kathmandu, Surkhet, Mahottari, Rautahat, Kapilvastu and Jajarkot. More TB<br />
has been reported in recent past from Sunsari, Solukhumbu, Jajarkot, Mustang, Siraha, Bajura,<br />
Dang, Salyan.<br />
• Jajarkot, Salyan, Teharthum, Ilam, Doti, Panchthar are highly prone to Leprosy. During 1993-<br />
1995, Morang, Rupandehi, Sarlahi, Saptari, Nuwakot, Kathmandu, Humla, Dhanusha, More<br />
leprocy cases were reported. In recent past, more cases have been reported from Jajarkot,<br />
Dhanusha, Kathmandu, Rautahat, Banke, Jhapa.<br />
• Western and Far western districts like Humla, Kalikot, Dailekh, Jajarkot, Accham, Rukum, Doti,<br />
Banke, Surkhet, are susceptible to Gastroenteritis. However, no case has been reported from<br />
Jumla. The reason <strong>for</strong> more cases in the surrounding districts and no case in Jumla is due to<br />
unavailability of outbreak data.<br />
• Very limited in<strong>for</strong>mation is available <strong>for</strong> hepatitis outbreaks. Only cases are reported in Dailekh,<br />
Bhaktapur and Kathmandu.<br />
• Acute Respiratory Infection (ARI), Influenza; has been mostly reported from Humla, Mugu,<br />
Dolpa, Accham, Salyan, Solukhumbu, Okhaldhunga and some eastern districts. These districts<br />
are more susceptible to ARI.<br />
• More Typhoid cases have been reported from Rolpa, Kaski, Nuwakot, Morang and Ilam.<br />
• In case of STI, Palpa, Banke,Baglung, Taplejung, Sunsari, Humla, Rukum, Dolpa, Nuwakot,<br />
Dhading, Dang and Jajarkot are highly susceptible. STI trend in first three years reveals that<br />
more cases were reported in Dhading, Dolpa, Banke, Jajarkot, Dang, Baglung, Nuwakot, Rukum,<br />
77
<strong>Nepal</strong> <strong>Hazard</strong> <strong>Risk</strong> <strong>Assessment</strong><br />
Demographic data<br />
i.e. Population<br />
Diseases / Outbreak data<br />
from Health Management<br />
In<strong>for</strong>mation system( DOHS)<br />
District and<br />
National Maps<br />
Classification of Diseases and<br />
Outbreak<br />
8 Classes of Diseases i.e. Leprosy, Malaria,<br />
Tuberculosis (TB), Sexual Transmitted Infection<br />
(STI), Diarrhea, Acute Respiratory Infection<br />
(ARI), Filariasis and Kalazar<br />
4 Classes of Outbreaks Typhoid,<br />
Influenza & ARI, Gastroenteritis and<br />
Hepatitis<br />
Database<br />
management<br />
(Data Validation)<br />
Incidence rate<br />
calculation <strong>for</strong><br />
diseases <strong>for</strong> all<br />
districts<br />
Incidence Index <strong>for</strong><br />
specific District =<br />
Number of cases<br />
-------------------------<br />
Total Population<br />
Incidence rate<br />
calculation <strong>for</strong><br />
outbreaks <strong>for</strong> all<br />
districts<br />
Calculation of<br />
overall trend of<br />
diseases /<br />
outbreak <strong>for</strong> each<br />
district<br />
Trend Analysis <strong>for</strong><br />
First and Last<br />
three years<br />
Mapping of<br />
Disease /<br />
Outbreak<br />
Susceptibility<br />
Figure 3.44 Methodology of disease / outbreak susceptibility mapping<br />
Figure 3.45.Trend analysis of Diseases and outbreak<br />
78
<strong>Nepal</strong> <strong>Hazard</strong> <strong>Risk</strong> <strong>Assessment</strong><br />
3.6.8 RECOMMENDATIONS<br />
• The disease/ outbreak susceptibility maps (Figure 3.46 to Figure 3.51) are showing most vulnerable<br />
districts in the country. This gives broader pictures of distribution of diseases / outbreaks in the<br />
country. The disease / outbreak distribution can provide understanding about the causative factors <strong>for</strong><br />
such problems.<br />
• The HMIS has comprehensively maintaining Health Management In<strong>for</strong>mation System. Comparing<br />
to disease database, Outbreak database is very much limited within the system. At present, outbreak<br />
data is only available <strong>for</strong> 5 years. It is recommended to restrength the system so that data is available<br />
to the department and ministry <strong>for</strong> addressing the need <strong>for</strong> better health emergency situation.<br />
• ARI and Diarrhea are most prevalent in west, farwest hills and mountain districts. Specially, the hill<br />
and mountain regions are prone to hygiene and sanitation related diseases and outbreaks. These<br />
regions are having acute shortage of water in winter and pre monsoon. This is reflected in shortage of<br />
water <strong>for</strong> drinking and daily use purposes. So community is largely dependent on limited water<br />
source which is largely used <strong>for</strong> cattle feed and daily utilities. The community uses polluted water <strong>for</strong><br />
drinking, which is the source of Hepatitis, Diarrhea and other water borne diseases. There is lack of<br />
health infrastructure in these remote districts, leading to poor diagnosis and treatment mechanism. So<br />
there is a need <strong>for</strong> providing necessary health infrastructure in these areas.<br />
• Filariasis is mostly prevalent in far West and Central Terai districts. The reason <strong>for</strong> more cases are<br />
due to climatic factors like temperature, humidity, precipitation, altitude, vegetation, landuse<br />
landcover in these region. This gives conducive environment <strong>for</strong> nematode worms namely<br />
Wuchereria bancrofti, Brugia malayi, and Brugia timori.<br />
• Tropical diseases like Leprosy, TB, STI are reported across the country. Thus there is a need <strong>for</strong><br />
expediting the programs aiming to eradicate these diseases.<br />
• Malaria is prevalent across all Terai and eastern districts. The reasons <strong>for</strong> more cases in identified<br />
districts are due to their geo and topographical configuration. Terai region is having large density of<br />
water bodies and rivers. The Terai region is almost flat and accumulates water in low lying areas.<br />
These stagnated water in ponds and lakes with high humidity and temperature gives appropriate<br />
environment <strong>for</strong> malaria vectors to grow.<br />
• There is a linkage of disease and outbreaks to other socio-economic factors, climate and<br />
meteorological factors, civil unrest and ongoing hydro meteorological disasters. The water and<br />
vector borne diseases are also governed by drought and flood events it is recommended to integrate<br />
various ongoing projects & program, so the causative factor <strong>for</strong> disease/outbreak are advanced<br />
adequately and reduce the impact of disease and outbreak.<br />
79
<strong>Nepal</strong> <strong>Hazard</strong> <strong>Risk</strong> <strong>Assessment</strong><br />
Figure 3.46. Maps showing disease susceptibility maps <strong>for</strong> TB and STI<br />
80
<strong>Nepal</strong> <strong>Hazard</strong> <strong>Risk</strong> <strong>Assessment</strong><br />
Figure 3.47. Maps showing disease suscetibility maps <strong>for</strong> Diarrhea and ARI<br />
81
<strong>Nepal</strong> <strong>Hazard</strong> <strong>Risk</strong> <strong>Assessment</strong><br />
Figure 3.48.Maps showing disease susceptibility maps <strong>for</strong> Fliariasisi and Kalazar<br />
82
<strong>Nepal</strong> <strong>Hazard</strong> <strong>Risk</strong> <strong>Assessment</strong><br />
Figure 3.49. Maps showing disease susceptibility maps <strong>for</strong> Leprocy and Malaria<br />
83
<strong>Nepal</strong> <strong>Hazard</strong> <strong>Risk</strong> <strong>Assessment</strong><br />
Figure 3.50. Maps showing disease susceptibility maps <strong>for</strong> Typhoid and Hepatitis<br />
84
<strong>Nepal</strong> <strong>Hazard</strong> <strong>Risk</strong> <strong>Assessment</strong><br />
Figure 3.51. Maps showing disease susceptibility maps <strong>for</strong> Gastroenteritis and Influenza ARI<br />
85
<strong>Nepal</strong> <strong>Hazard</strong> <strong>Risk</strong> <strong>Assessment</strong><br />
3.7 APPROACH FOR MULTI-HAZARD ASSESSMENT<br />
The study reveals that <strong>Nepal</strong> is prone to various kinds of hazards. There is a dire need to diagnose all<br />
possible hazards in the country and evolve strategy to mitigate the negative impacts of prevailing<br />
hazards. The idea behind the multi-hazard assessment (Multi-HA) is to compare the severity of various<br />
hydro-meteorological, geological and health hazards, understand the distribution of various hazards in<br />
the country, identify multiple hazard districts and region, their causative factors and identify the regions<br />
and districts <strong>for</strong> intensifying mitigation intervention.<br />
3.7.1 APPLICATION OF MULTI-HAZARD ASSESSMENT (MULTI-HA)<br />
• Multi-HA facilitates nodal disaster management agency (MOHA), Government and Non-government<br />
agencies to launch mitigation projects integrating all hazard approach. This will help the<br />
implementing agency to optimize project resources and reduce the project implementation cost by<br />
integrating all hazard approach.<br />
• Multi-HA provides necessary background <strong>for</strong> policy development, awareness and knowledge about<br />
disaster risk reduction.<br />
• Multi-HA provides better understanding about correlation and linkage between various hazards and<br />
causative factors.<br />
• The assessment facilitates better cooperation between various agencies working in the area of hazard<br />
mitigation and management. For example, MOHA is overall managing the disasters, however,<br />
Department of Mines and Geology, DWIDP, DMH, Department of Road and many more agencies<br />
are working in geological and hydro-meteorological hazards. The Multi-HA provides conducive<br />
plat<strong>for</strong>m <strong>for</strong> communication, cooperation and collaboration towards creating disaster resilient<br />
society.<br />
3.7.2 METHODOLOGY FOR MULTI HAZARD ASSESSMENT<br />
The details of earthquake, landslide, floods, drought and health hazard assessment have been discussed<br />
in earlier sections. The previous sections have identified districts and regions prone to various types of<br />
hazards. Based on earlier assessment, the Multi-HA criteria have been developed. These are as below:<br />
• Two scenarios are considered. Scenario-One includes earthquake of 500 year return period,<br />
Earthquake induced landslide, Rainfall induced landslides, Floods of 10 years return period, Drought<br />
in winter and Health hazards susceptibility. The Scenario-Two includes earthquake of 250 years<br />
return period, Rainfall induced landslides, Floods of 10 years return period, Drought in winter and<br />
Health hazards susceptibility.<br />
• Two earthquake scenarios are considered <strong>for</strong> multi hazard assessment ie., earthquake of return period<br />
500 years and 250 years. For Multi-HA purpose, only high and very high earthquake hazard prone<br />
areas have been considered. The GIS tools are used to tabulate area coverage under each class of<br />
severity. The threshold value <strong>for</strong> identification of district <strong>for</strong> earthquake hazard is 33% of area falling<br />
under high and very high earthquake severity.<br />
• Earthquake induced landslides hazard assessment is carried out based on 500 years return period.<br />
The medium and high landslide susceptible area of each district has been calculated. If the district’s<br />
area more than 15% falls under medium and high landslide hazard, they district is considered as<br />
earthquake induced landslide prone district.<br />
• Precipitation induced landslide has been carried out, which has been classified into negligible, low,<br />
medium and high susceptible zones. Similar to earthquake induced landslide, the districts have been<br />
identified as landslide prone which is having more than 15 % of area falling under medium to high<br />
susceptible zones.<br />
• Flood hazard assessment has been carried out <strong>for</strong> seven rivers. The flood hazard assessment has been<br />
carried out <strong>for</strong> 10 years, 25 years, 50 years, 100 Years and 500 years. The flood depth and inundation<br />
area has been calculated <strong>for</strong> each affected district. These all districts have been considered <strong>for</strong> Multi-<br />
HA criteria.<br />
• Drought hazard assessment considers districts having critical drought during winter season.<br />
• Disease and outbreak susceptible districts have been identified. There are 12 disease and outbreak<br />
cases are considered under health hazard. The district having three of more types of health hazards<br />
are considered <strong>for</strong> Multi-HA.<br />
Based on above stated criteria two scenarios are created. The results are presented in tabular <strong>for</strong>ms <strong>for</strong><br />
reference.<br />
3.7.3 ANALYSIS OF MULTI-HA<br />
• The scenario one considers six types of hazards. The analysis shows that more than 55 districts are<br />
prone to more than three hazards. The breakdown is given below in Table 3.10.<br />
Table 3.10 Districts prone to multiple hazards under scenario one<br />
S. no Number of Districts Number of <strong>Hazard</strong>s<br />
1 Jhapa, Pythan, Sankhuasabha, Bhojpur, Khotang,<br />
Okhaldhunga, Udaypur, Sarlahi, Ramechhap,<br />
Dolakha, Sindhupalchowk, Kabhrepalanchok,<br />
Bhaktapur, Kathmandu, Nuwakot, Rasuwa, Chitawan,<br />
Gorkha, Lamjung, Tanahu, Parbat, Baglung, Myagdi,<br />
Nawalparasi, Arghakhanchi, Gulmi, Banke, Dolpa,<br />
Jumla, Mugu, Humla, Bajhang, Bajura, Doti, Kailali,<br />
Dadeldhura, Baitadi and Darchula.<br />
2 Ilam, Lalitpur, Dhading, Kaski, Syangja, Mustang,<br />
Rukum,Makawanpur, Dang, Jajarkot, Dailekh, Kalikot<br />
and Accham<br />
Three types of Geological,<br />
Hydro-meteorological hazards<br />
Four types of Geological,<br />
Hydro-meteorological hazards<br />
3 Sindhuli, Salyan and Rolpa Five types of Geological,<br />
Hydro-meteorological hazards<br />
86
<strong>Nepal</strong> <strong>Hazard</strong> <strong>Risk</strong> <strong>Assessment</strong><br />
• The scenario two considers five types of hazards. The analysis shows that more than 24 districts are<br />
prone to more than three hazards. The details are shown below in Table 3.11.<br />
Table 3.11 Districts prone to multiple hazards under scenario two<br />
S. no Number of Districts Number of <strong>Hazard</strong>s<br />
1 Accham, Arghakhanchi, Chitawan, Dadeldhura,<br />
Dailekh, Dang, Dhading, Dolpa, Doti, Ilam, Jajarkot,<br />
Kalikot, Kaski, Lalitpur, Makwanpur, Mustang,<br />
Nawalparasi, Pyuthan, Rukum, Sarlahi, and Syangja<br />
Three types of Geological,<br />
Hydro-meteorological hazards<br />
2 Rolpa, Salyan And Sindhuli Four types of Geological,<br />
Hydro-meteorological hazards<br />
3.7.4 RECOMMENDATIONS<br />
• The Multiple hazard prone districts should be given first priority <strong>for</strong> disaster mitigation interventions.<br />
The focal departments, agencies and ministries should give special emphasis <strong>for</strong> disaster mitigation<br />
in multiple hazard districts.<br />
• Most multiple hazard prone districts like Rolpa, Salyan and Sindhuli should be given priority <strong>for</strong><br />
disaster intervention. However it is necessary to check the exposure of lives and necessary<br />
infrastructure in multiple hazard districts. The details of exposure to live and infrastructure to<br />
multiple hazard prone districts will be discussed in next chapter.<br />
87
<strong>Nepal</strong> <strong>Hazard</strong> <strong>Risk</strong> <strong>Assessment</strong><br />
Figure 3.52 Multi hazard assessment scenario 1<br />
88
<strong>Nepal</strong> <strong>Hazard</strong> <strong>Risk</strong> <strong>Assessment</strong><br />
Figure 3.53 Multi hazard assessment scenario 2<br />
89
<strong>Nepal</strong> <strong>Hazard</strong> <strong>Risk</strong> <strong>Assessment</strong><br />
REFERENCE<br />
BGR, GAI, 2009. Guidebook <strong>for</strong> Assessing the risks to Natural <strong>Hazard</strong>s, Case Study: Province of<br />
Central Java. Bandung, Indonesia.<br />
Bilham, R., 1995. LOCATION AND MAGNITUDE OF THE 1833 NEPAL EARTHQUAKE AND<br />
ITS RELATION TO RUPTURE ZONES OF CONTIGUOUS GREAT HIMALAYAN<br />
EARTHQUAKES. Current Science 69, 28.<br />
CBS, 2001. Population of <strong>Nepal</strong>'s VDC (table data). In: (CBS), C.B.o.S. (Ed.). Central Bureau of<br />
Statistics, Kathmandu, <strong>Nepal</strong>.<br />
CERD, 2007. Development of database <strong>for</strong> irrigation development in <strong>Nepal</strong>. March,2007,<br />
Kathmandu.<br />
CPC, Moisture index data. Climate Prediction Center (CPC), Maryland, USA.<br />
CRED, 2009. EM-DAT, The OFDA/CRED International <strong>Disaster</strong> Database -www.emdat.be-.<br />
Centre <strong>for</strong> Research on the Epidemiologi of <strong>Disaster</strong>s (CRED), Université Catholique de Louvain –<br />
Brussels – Belgium.<br />
DesInventar, <strong>Disaster</strong> In<strong>for</strong>mation Management System, Data of <strong>Nepal</strong>. <strong>Disaster</strong> In<strong>for</strong>mation<br />
Management System (DESINVENTAR).<br />
DHM, 2001-2009. Preliminary monthly weather summary of <strong>Nepal</strong> from 2001 to 2008.<br />
DHM, 2009. Dry and Worm Winter 2009, Climate Section, Internal Report of Department of<br />
Hydrology and Meteorology.<br />
DMG, 1987. Geological Map of <strong>Nepal</strong>, 1:250,000 scale (5 sheets). Department of Mines and<br />
Geology (DMG), Kathmandu, <strong>Nepal</strong>.<br />
DMG, 2009. Revenue and Production of Minerals.<br />
DOI, 2008. Industrial statistic Fiscal year 2064/065(2007/2008). Department of Industry (DOI),<br />
Kathmandu,<strong>Nepal</strong>.<br />
DOS, 2001. Digital Map of <strong>Nepal</strong>. In: Survey, D.o. (Ed.). <strong>Nepal</strong> Department of Survey.<br />
EHA, D., 2007. <strong>Nepal</strong> District Health Profiles Baseline Data Through Secoenday Source.<br />
Kathdmandu, <strong>Nepal</strong>.<br />
ESA, Land cover database. European Space Agency (ESA).<br />
GPCC, Precipitation data. Global Precipitation Climatology Centre, Deutscher Wetterdienst,<br />
Offenbach, Germany.<br />
GR Chitrakar, M.P., 1986. Historical Earthquakes of <strong>Nepal</strong>. Bulletin Geological Society, <strong>Nepal</strong><br />
1986.<br />
ICIMOD, 2007. Natural <strong>Hazard</strong>s in <strong>Nepal</strong>, <strong>Disaster</strong> Preparedness <strong>for</strong> Natural <strong>Hazard</strong>s, Current<br />
status in <strong>Nepal</strong>. International Centre <strong>for</strong> Integrated Mountain Development (ICIMOD),<br />
Kathmandu, <strong>Nepal</strong>.<br />
ICIMOD, CBS, 2003a. Districts of <strong>Nepal</strong> Indicator Development, Update 2003. In: (CBS), C.B.o.S.<br />
(Ed.). International Centre <strong>for</strong> Integrated Mountain Development (ICIMOD), Kathmandu, <strong>Nepal</strong>.<br />
ICIMOD, CBS, 2003b. Mapping <strong>Nepal</strong> Census Indicators 2001 and Trends. In: Statistics, C.B.o.<br />
(Ed.). International Centre <strong>for</strong> Integrated Mountain Development (ICIMOD), Kathmandu, <strong>Nepal</strong>.<br />
Jain, S.K., 1998. Lessons from Recent Indian Earthquakes, Guest Editor of Special Issue on<br />
Earthquakes in India. Indian Concrete Journal 72.<br />
Kayastha, R.P., Shreshtha, N.L., 2005. Housing and household characteristics and family, Chapter<br />
5. Central Bureau Statistics (CBS).<br />
METI, 2006. ASTER Digital Elevation Model (DEM), <strong>Nepal</strong> Area. The Ministry of Economy,<br />
Trade and Industry of Japan (METI) and the National Aeronautics and Space Administration<br />
(NASA).<br />
MOHA, 2004. <strong>Disaster</strong> scenario of <strong>Nepal</strong> 2000-2003. Ministry of Home Affairs (MOHA),<br />
Government of <strong>Nepal</strong>, Kathmandu, <strong>Nepal</strong>.<br />
MoI, 2009. Non Conventional Irrigation Technmology Project. Ministry of Irrigation (MoI).<br />
MTCA, 2008. <strong>Nepal</strong> Tourism Satistics 2008 (Anual statistic Report). Ministry of Tourism and<br />
Civil Aviation (MTCA), Kathmandu.<br />
NEA, 2009. AYear in Review Fiscal Year 2008/09. Kathmandu.<br />
NGI, 2004. Landslide hazard and risk assessment in <strong>Nepal</strong> - A desk study. NGI Report 20041239-<br />
1. Norwegian Geotechnical Institute (NGI).<br />
NSC, 2005. Epicentre Map of <strong>Nepal</strong> Himalaya (1994-2005). National Seismological Centre (NSC)<br />
<strong>Nepal</strong>, Kathmandu, <strong>Nepal</strong>.<br />
NSC, 2009. Historical Earthquake of <strong>Nepal</strong>. National Seismological Center (NSC), Kathmandu,<br />
<strong>Nepal</strong>.<br />
Pandey, M.R., Chitrakar, G.R., Kafle, B., Sapkota, S.N., Rajaure, S., Gautam, U.P., 2002. Seismic<br />
<strong>Hazard</strong> Map of <strong>Nepal</strong>. Department of Mines and Geology, Kathmandu.<br />
Sharma, C.K., 1981. Landslides and Soil Erosion in <strong>Nepal</strong>. Kathmandu, p. 93.<br />
Sharma, C.M., 2008. Freshwater fishes, fisheries, and habitat prospects of <strong>Nepal</strong>. Aquatic<br />
Ecosystem Health & Management 11, 289-297.<br />
Trifunac, M.D., Brady, A.G., 1975. A Study on the Duration of Strong Earthquake Ground<br />
Motion. Bulletin of Seismology Society America 65, 581-626.<br />
USACE, 2009a. Hec-GeoHMS Software. United State Army Corps of Engineering (USACE).<br />
90
<strong>Nepal</strong> <strong>Hazard</strong> <strong>Risk</strong> <strong>Assessment</strong><br />
USACE, 2009b. Hec-GeoRAS Software. United State Army Corps of Engineering (USACE).<br />
USACE, 2009c. Hec-RAS Software. United State Army Corps of Engineering (USACE).<br />
USGS, Earthquake hazard program, Earthquake Catalog. United States Geological Survey<br />
(USGS).<br />
USGS, 2003. Shuttle Radar Topography Mission, <strong>Nepal</strong> Area. Consortium <strong>for</strong> Spatial In<strong>for</strong>mation<br />
(CGIAR-CSI) of the Consultative Group <strong>for</strong> International Agricultural Research.<br />
Wald, D.J., Quitoriano, V., Heaton, T.H., Kanamori, H., 1999. Relationships between Peak<br />
Ground Acceleration, Peak Ground Velocity, and Modified Mercalli Intensity in Cali<strong>for</strong>nia.<br />
Earthquake Spectra 15.<br />
91
<strong>Nepal</strong> <strong>Hazard</strong> <strong>Risk</strong> <strong>Assessment</strong><br />
Annexure<br />
92
<strong>Nepal</strong> <strong>Hazard</strong> <strong>Risk</strong> <strong>Assessment</strong><br />
1 ANNEXURE 1<br />
GIS METHODOLOGY FOR ASSESSMENT OF LANDSLIDE HAZARD<br />
1.1 INTRODUCTION<br />
The major triggering factors <strong>for</strong> landslides are extreme precipitation events, strong earthquakes, and<br />
human activity. The strong correlation between landslides and other natural hazard triggers like<br />
hurricanes or earthquakes has resulted in an underestimation of their socio-economic impact. This<br />
underestimation contributes to reduced awareness and concern of both authorities and general public<br />
about landslide risk.<br />
1.2 MODEL FOR LANDSLIDE HAZARD EVALUATION<br />
The term "landslide" in this study refers to events involving gravity-driven rapid mass movement downslope,<br />
like rockslides, debris flows, and rainfall- and earthquake-induced slides; which pose a threat to<br />
human life. Slow moving slides have significant economic consequences <strong>for</strong> constructions and<br />
infrastructure, but rarely cause any fatalities.<br />
to the in<strong>for</strong>mation available in landslide inventories and physical processes. The general approach used<br />
in the present study is a modified and improved version of the approach used by Nadim et al. (2006).<br />
One of the key improvements in the present model is the increased resolution on the DEM and<br />
consequently the slope data. In previous studies a 30 arc second resolution was used, whereas the present<br />
study uses the 3 arc seconds SRTM dataset.<br />
The hazard maps are divided in precipitation induced landslide hazard and earthquake induced landslide<br />
hazard. The landslide hazard indices were estimated using the following equations:<br />
H r = (S r x Six S h x S v )xT p (1)<br />
He = (Sr X Si X Sh X Sv) x T s (2)<br />
where Hr and He are landslide hazard indices <strong>for</strong> rainfall and earthquake induced landslides respectively,<br />
Sr is the slope factor within a selected grid, Sl is lithological (or geological) conditions factor, S h<br />
describes the soil moisture condition, T p is the precipitation factor and T s describes the seismic<br />
conditions. The index Sv described the vegetation cover.<br />
1.2.1 SLOPE FACTOR SR<br />
The slope factor represents the natural landscape ruggedness within a grid unit. In February 2000, NASA<br />
collected elevation data <strong>for</strong> much of the world using a radar instrument aboard the Space Shuttle. The<br />
raw data collected on the mission were processed over three years. NASA has now released a global<br />
elevation dataset called SRTM3, referring to the name of the mission and the resolution of the data,<br />
which is 3 arc-seconds, or approximately 90 by 90 m per data sample near the equator. The SRTM3 data<br />
set covers the globe from 60 degrees south latitude to 60 degrees north latitude. The vertical accuracy is<br />
estimated such that 90% of posts are within 16m tolerance of the actual position.<br />
Table 1.1. Slope angle classification.<br />
Figure 1.1. Schematic approach <strong>for</strong> landslide hazard and risk evaluation.<br />
As part of the "Natural <strong>Disaster</strong> Hotspots" project of The World Bank (Dilley et al., 2005), (Nadim et<br />
al., 2006) adopted a simplified first-pass analysis method <strong>for</strong> identifying the global landslide hazard and<br />
risk "hotspots",. The scale of their analysis was a grid of roughly 1km x 1km pixels where landslide<br />
hazard, defined as the annual probability of occurrence of a potentially destructive landslide event, was<br />
estimated by an appropriate combination of the triggering factors (mainly extreme precipitation and<br />
seismicity) and susceptibility factors (slope, lithology, and soil moisture). The principles of the method<br />
are depicted in Figure 1.1. The weights of different triggering and susceptibility factors were calibrated<br />
Range of slopes angle (unit 1/100 degrees) Classification Sr<br />
0000 - 0100 Very low 0<br />
0101 - 0600 Low 1<br />
0601 - 1200 Moderate 2<br />
1201 - 1800 Medium 3<br />
1801 - 2400 High 4<br />
2401 - 4000 Very high 5<br />
4001 - 4500 Medium 3<br />
4501 - 9000 Medium 3<br />
In the analyses, the slope data were reclassified on a geographical grid (WGS84). Cells were distributed<br />
in the 6 different categories (0 - 5) presented in the category table above.<br />
93
<strong>Nepal</strong> <strong>Hazard</strong> <strong>Risk</strong> <strong>Assessment</strong><br />
Note: <strong>for</strong> slopes which angle is less than 1° (i.e. <strong>for</strong> flat or nearly flat areas), S r is set equal to zero<br />
because the resulting landslide hazard is zero even if the other factors are favourable. Slopes greater than<br />
40° are most likely comprised of competent rock; there<strong>for</strong>e S r is reduced to 3 <strong>for</strong> these very steep slopes.<br />
1.2.2 LITHOLOGY FACTOR S I<br />
Figure 1.2. Slope factor Sr <strong>for</strong> <strong>Nepal</strong>.<br />
This is probably the most difficult parameter to assess. Ideally, detailed geotechnical in<strong>for</strong>mation should<br />
be used but, at the global scale, only a general geological description is available. Rock strength and<br />
fracturing are the most important factors to evaluate lithological characteristics, and these characteristics<br />
can vary greatly over short distances.<br />
The dataset used in the study was the digital geological map of <strong>Nepal</strong> provided by Department mines<br />
and Geology (DMG, 1987). Five susceptibility classes were used in the analyses, as shown in the table<br />
below. Usually old rocks are stronger than young rocks. Plutonic rocks will usually be strong and<br />
represent low risk. Strength of metamorphic rocks is variable, but these rocks often have planar<br />
structures such as foliation and there<strong>for</strong>e may represent higher risk than plutonic rocks. Lava rocks will<br />
usually be strong, but may be associated with tuff (weak material). There<strong>for</strong>e, areas with recent<br />
volcanism are classified as high risk. Sedimentary rocks are often very weak, especially young ones.<br />
Table 1.2. Geological classification.<br />
Description of Lithology and Geological Unit Age Si<br />
Quartzites<br />
Augen gneisses, banded gneisses<br />
Upper Pre Cambrian ‐Late Paleozoic ‐ Devonian<br />
Granites<br />
1<br />
Tow mica leucocratic granites with tourmaline<br />
Miocene<br />
Grey siliceous dolomites<br />
Upper Pre Cambrian ‐Late Paleozoic<br />
Augen gneisses, granitic gneisses, and feldsphatic schists Pre Cambrian<br />
Crystalline limestones<br />
Pre Cambrian ‐ Devonian<br />
Grey to greenish grey quartzites, calcareous quartzites Pre Cambrian<br />
Gneisses and thin bands of marbles<br />
Pre Cambrian<br />
2<br />
Quartzitic schists<br />
Pre Cambrian<br />
Dolomite underlain by crinoidal limestones<br />
Pre Cambrian ‐ Devonian<br />
Muscovite biotite quartz schists<br />
Pre Cambrian ‐ Devonian<br />
Crystalline marbles<br />
Pre Cambrian ‐ Devonian<br />
Quartz mica schist<br />
Pre Cambrian<br />
Schists metamorphosed rocks<br />
Pre Cambrian<br />
Dark slates with white quartzites<br />
Pre Cambrian ‐ Devonian<br />
Calcareous silicate rocks and marble bands<br />
Pre Cambrian ‐ Devonian<br />
Dark gray slates<br />
Upper pre cambrian ‐Late Paleozoic<br />
Crystalline marble<br />
Pre Cambrian ‐ Devonian<br />
Phyllites quartzites and phyllitic schists<br />
Pre Cambrian<br />
Sandstones<br />
Mid Miocene ‐ Pleistocene<br />
Limestone, sandstone and shale<br />
Cambrian to Permian<br />
Phyllites grilstones with conglomerates and white massive<br />
3<br />
quartzites.<br />
Upper Pre Cambrian ‐ Late Paleozoic<br />
Biotite and quartzitic mica schists<br />
Pre Cambiran ‐ Devonian<br />
Schists quartzites gneisses and calcareous silicate rocks Pre Cambrian ‐ Devonian<br />
Muscovite biotite quartz schists quartzites<br />
Pre Cambrian ‐ Devonian<br />
Schists<br />
Pre Cambrian<br />
Crystalline limestones<br />
Pre Cambrian<br />
Sandstones, chloritic phyllites, lamprophyre sills<br />
Permo ‐ Carboniferous<br />
Sandstones<br />
Pre Cambrian ‐ Devonian<br />
Carbonates and dolomitic limestones<br />
Upper pre cambrian ‐Late Paleozoic<br />
Carbonaceous slates and green shales<br />
Upper pre cambrian ‐ Late Paleozoic<br />
Sandstones<br />
Mid Miocene ‐ Pleistocene<br />
Continental plate<strong>for</strong>m sediments<br />
Triassic to Lower Cretaceous<br />
Quartzites with ripple marks interbedded with shales beds<br />
Calcareous rocks<br />
Upper pre cambrian Late Paleozoic<br />
Early to Middle Paleozoic<br />
Grey shales with intercalation of limestones and quartzites Upper pre cambrian ‐Late Paleozoic<br />
Slates with thin limestones<br />
Pre Cambiran ‐ Devonian<br />
Sandstones<br />
Cretaceous ‐ Eocene<br />
Shales with lenses of fine grained fossiliferous<br />
Cretaceous ‐ Eocene<br />
Calcareous quartzites and quartzitic limestones<br />
Upper pre cambrian ‐Late Paleozoic<br />
Coarse boulders, conglomerates<br />
Mid Miocene ‐ Pleistocene<br />
Mainly fluvial and fluvio terrential sediments with local lacustrine<br />
clays and marlstones<br />
Plio‐Pleistocene,<br />
Alluvium, boulders, gravels, sands and clays<br />
Quaternary<br />
Alluvium, boulders, gravels, sands and clays<br />
Recent<br />
4<br />
5<br />
94
<strong>Nepal</strong> <strong>Hazard</strong> <strong>Risk</strong> <strong>Assessment</strong><br />
Three classes <strong>for</strong> soil moisture index are determined based on NCEP/CPC dataset:<br />
Table 1.3. Soil moisture classification.<br />
Soil moisture index (NCEP/CPC) Susceptibility Sh<br />
0 80 Low to moderate 1<br />
80 —> 160 Medium 2<br />
160 —» 250 High to very high 3<br />
The CPC data are available <strong>for</strong> download from:<br />
http://iridl.ldeo.columbia.edu/SOURCES/.NOAA/.NCEP/.CPC/.GMSM/<br />
Three classes <strong>for</strong> soil moisture index are determined based on NCEP/CPC dataset (Table 1.4):<br />
Table 1.4. Soil moisture index.<br />
Soil moisture<br />
index Susceptibility Sh<br />
(NCEP/CPC)<br />
0 → 80 Low to moderate 1<br />
80 → 160 Medium 2<br />
160 → 250 High to very high 3<br />
1.2.3 SOIL MOISTURE FACTOR, S H<br />
Figure 1.3. Lithology factor Si the <strong>Nepal</strong>.<br />
S h is a soil moisture index, which indicates the mean humidity throughout the year and gives an<br />
indication of the state of the soil prior to heavy rainfall and possible destabilization.<br />
The data <strong>for</strong> the study were extracted from the Moisture Index by the Climate Prediction Center ((CPC),<br />
Fan and Van den Dool 2004). The model used to produce the dataset is based on the algorithm of Huang<br />
et al. (1996). The data cover the period from 1948 to the present (the data are updated daily in near- real<br />
time) and the resolution is 0.5° x 0.5°. The model uses precipitation and temperature as its<br />
meteorological inputs and calculates evaporation based on Thornthwaite (1948). Surface run off and<br />
base flow are separately parameterised, and parameter calibration <strong>for</strong> runoff and soil moisture is<br />
per<strong>for</strong>med using field data from Oklahoma (Huang et al. 1996).These calibration values are then applied<br />
globally.<br />
1.2.4 VEGETATION COVER INDEX S V<br />
The GLOBECOVER v2.2 database has 22 different classes of vegetation cover, which have been<br />
translated into 5 categories (scale 1 to 5) with respect to resistance to landslides. The table below shows<br />
the range of Sv <strong>for</strong> these 5 categories.<br />
Category of<br />
vegetation cover<br />
w.r.t. resistance to<br />
landslides<br />
Table 1.5. Vegetation cover index.<br />
Vegetation cover<br />
index Sv <strong>for</strong> rainfallinduced<br />
slides<br />
Vegetation cover<br />
index Sv <strong>for</strong><br />
earthquakeinduced<br />
slides<br />
5 0.8 0.9<br />
4 0.9 0.95<br />
3 1 1<br />
2 1.1 1.05<br />
1 1.2 1.1<br />
95
<strong>Nepal</strong> <strong>Hazard</strong> <strong>Risk</strong> <strong>Assessment</strong><br />
On the basis of the estimated 100-year extreme monthly rainfall, a precipitation index Tp1 was assigned<br />
as listed in the table below.<br />
Table 1.6. Precipitation index T p1<br />
100‐year extreme<br />
monthly rainfall Susceptibility Tp1<br />
(mm)<br />
0000 – 0330 Low 1<br />
0331 – 0625 Moderate 2<br />
0626 – 1000 Medium 3<br />
1001 – 1500 High 4<br />
> 1500 Very high 5<br />
Figure 1.4. Vegetation cover index Sv <strong>for</strong> precipitation-induced landslides.<br />
1.2.5 PRECIPITATION TRIGGER FACTOR T P :<br />
The categorisation of Tp was based on the estimate of the 100-year extreme monthly rainfall (i.e. extreme<br />
monthly rainfall with 100 years return period). The source of data was the monthly precipitation time<br />
series (1951 - 2004) from Global Precipitation Climatology Centre (GPCC) run by Germany’s National<br />
Meteorological Service, DWD (Rudolf et al, 2005). The dataset is based on quality-controlled data from<br />
a larger number of stations (up to 43,000) with irregular coverage in time. This product is optimised <strong>for</strong><br />
best spatial coverage and use <strong>for</strong> water budget studies. The products contain precipitation totals,<br />
anomalies, number of gauges and systematic error correction factors. The grid resolution is 0.5° x 0.5°<br />
latitude / longitude.<br />
At the time of the study, the monthly values were available <strong>for</strong> 54 years, from 1951 to 2004. The<br />
maximum registered values per annum were used to calculate the expected 100-year monthly<br />
precipitation <strong>for</strong> every grid point assuming a Gumbel distribution. This is done by:<br />
The precipitation index used by Nadim et al. (2006) in the Global Hotspots study was identical to Tp1.<br />
Recent research has shown that it is the extreme precipitation events that trigger slides, and the definition<br />
of “extreme” depends on what is “normal” at a particular location. In other words, the geometry of<br />
natural slopes is adapted to the normal precipitation events at a given location. In order to trigger a slide,<br />
anomalously high precipitation is required. In the present study, an anomaly factor in included in the<br />
precipitation trigger index. The potential <strong>for</strong> anomaly was quantified by considering the coefficient of<br />
variation (mean divided by standard deviation) of the data obtained in Step 2 of estimation of the 100-<br />
year extreme monthly rainfall. The following range <strong>for</strong> anomaly factor is suggested (in the table below<br />
“a” denotes the smallest value of CoV = σ /µ obtained <strong>for</strong> the whole globe, and “b” denotes the largest<br />
value of CoV. The values of “a” and “b” obtained from the calculations were respectively 0.11 and<br />
3.60):<br />
Table 1.7. Anomaly factor <strong>for</strong> precipitation.<br />
Coefficient of variation of<br />
highest monthly annual<br />
rainfall, CoV = σ/µ<br />
Anomaly<br />
factor Ta<br />
a →a + 0.2 (b – a) 0.8<br />
a + 0.2 (b – a) →a + 0.4 (b – a) 0.9<br />
a + 0.4 (b – a) →a + 0.6 (b – a) 1<br />
a + 0.6 (b – a) →a + 0.8 (b – a) 1.1<br />
a + 0.8 (b – a) →b 1.2<br />
1. Choosing the highest monthly rainfall in the dataset <strong>for</strong> each year in each pixel.<br />
2. Evaluating the mean µ and the standard deviation σ of the annual maximums<br />
3. Fitting a Gumbel distribution to the data using the mean and standard deviation computed in Step<br />
2.<br />
4. Finding the 1%-percentile of the Gumbel distribution which corresponds to the 100-year extreme<br />
monthly rainfall.<br />
96
<strong>Nepal</strong> <strong>Hazard</strong> <strong>Risk</strong> <strong>Assessment</strong><br />
Figure 1.5. Precipitation index Tp1 <strong>for</strong> <strong>Nepal</strong>.<br />
The precipitation trigger index, Tp, was obtained by the equation below:<br />
Tp = Tp1 Ta (3)<br />
The variation range <strong>for</strong> Tp is there<strong>for</strong>e 0.8 – 6.0.<br />
1.2.6 SEISMIC TRIGGER FACTOR T S<br />
The data set used <strong>for</strong> the classification of the seismic trigger factor was the expected peak ground<br />
acceleration (PGA) with 475 to 500 years return period (10% probability of exceedance in 50 years).<br />
The PGA map was developed on the basis of the site-specific data provided by Department of Mines and<br />
Geology (DMG) in <strong>Nepal</strong> (Pandey et al., 2002) and an earlier study by NGI (2004).<br />
The peak ground acceleration (PGA) with 500-year return period was used as the representative<br />
triggering parameter <strong>for</strong> seismically-induced landslides in the present study,.<br />
Figure 1.6. Seismic trigger factor Ts <strong>for</strong> <strong>Nepal</strong>.<br />
The seismic trigger index, Ts, was evaluated from the PGA500 data according to the table below.<br />
Table 1.8. The seismic trigger index, Ts<br />
PGA500 (m/s 2 ) Ts<br />
0.00 – 0.50 0.1<br />
0.51 – 1.00 0.4<br />
1.01 – 1.50 0.8<br />
1.51 – 2.00 1.5<br />
2.01 – 2.50 2.5<br />
2.51 – 3.00 3.5<br />
3.01 – 3.50 5<br />
3.51 – 4.00 6<br />
4.01 – 4.50 7.5<br />
Greater than 4.50 10<br />
97
<strong>Nepal</strong> <strong>Hazard</strong> <strong>Risk</strong> <strong>Assessment</strong><br />
1.2.7 CATEGORISATION OF LANDSLIDE HAZARD<br />
The obtained landslide hazard indices were calibrated against the databases of landslide events in<br />
selected (mostly European) countries to obtain the frequency of the events. On the basis of this<br />
calibration, the landslide hazard classifications listed in the following table were established.<br />
Values <strong>for</strong><br />
Hlandslide, rainfall<br />
Values <strong>for</strong><br />
Hlandslide, earthquake Class<br />
Classification of<br />
landslide hazard<br />
potential<br />
Representative<br />
annual frequency in<br />
1 km 2 grid cell<br />
≤ 32 ≤ 55 0 Negligible ~ 0<br />
33 – 81 56 – 146 1 Low 0.01 – 0.2 %<br />
82 – 134 147 – 164 2 Medium 0.3 – 2 %<br />
134 – 288 165 – 591 3 High 3 – 10 %<br />
Figure 1.8. Map of precipitation-induced landslide hazard in <strong>Nepal</strong>.<br />
1.3 USING THE LANDSLIDE HAZARD RESULTS IN RISK ESTIMATION<br />
The intersection of the landslide hazard "hotspots" with population density (see Figure 1.9) and<br />
infrastructure density maps, and appropriate set of socio-economic indicators (GDP, Human<br />
Development Index, etc.) provides a first-pass estimate of landslide risk "hotspots".<br />
Figure 1.7. Map of earthquake-induced landslide hazard in <strong>Nepal</strong>.<br />
Since landslides are highly correlated with other natural disasters, one may overestimate the total risk<br />
from all natural hazards if one simply adds the individual risks. This is particularly significant <strong>for</strong><br />
earthquake-induced landslides, where the fatalities due to the earthquake event reported in various<br />
databases are inclusive of those caused by landslides. In the analyses presented in this note, the landslide<br />
hazard due to earthquakes and rainfall are differentiated. This should make it possible to correct <strong>for</strong><br />
some of the correlations among the risks associated with different natural hazards when the total risk is<br />
estimated.<br />
98
<strong>Nepal</strong> <strong>Hazard</strong> <strong>Risk</strong> <strong>Assessment</strong><br />
http://gpcc.dwd.de<br />
Seismic trigger factor: Global Seismic <strong>Hazard</strong> <strong>Assessment</strong> Program<br />
(GSHAP), Geo Forschungs Zentrum, Potsdam, Germany<br />
http://seismo.ethz.ch/GSHAP/index.html<br />
Population data: Gridded Population of the World (GPWv3), Columbia<br />
University, New York, USA<br />
http://sedac.ciesin.columbia.edu/gpw/<br />
International disaster database: EM-DAT: The OFDA/CRED International<br />
<strong>Disaster</strong> Database, Université catholique de Louvain, Brussels, Belgium<br />
http://www.em-dat.net/<br />
Land cover database: Erupean Space Agency<br />
http://www.esa.int/esaEO/SEMGSY2IU7E_index_0.html<br />
Figure 1.9. Map of population density in <strong>Nepal</strong>.<br />
1.4 REFERENCES<br />
CPC, Moisture index data. Climate Prediction Center (CPC), Maryland, USA.<br />
Dilley, M., Chen, R.S., Deichmann, U., Lerner-Lam, A.L., Arnold, M., 2005. Natural <strong>Disaster</strong><br />
Hotspots - A Global <strong>Risk</strong> Analysis. Report International Bank <strong>for</strong> Reconstruction and<br />
Development. World Bank and Columbia University.<br />
DMG, 1987. Geological Map of <strong>Nepal</strong>, 1:250,000 scale (5 sheets). Department of Mines and<br />
Geology (DMG), Kathmandu, <strong>Nepal</strong>.<br />
Nadim, F., Kjekstad, O., Peduzzi, P., Herold, C., Jaedicke, C., 2006. Global landslide and<br />
avalanche hotspots. Landslides 3, 159 - 174.<br />
Pandey, M.R., Chitrakar, G.R., Kafle, B., Sapkota, S.N., Rajaure, S., Gautam, U.P., 2002. Seismic<br />
<strong>Hazard</strong> Map of <strong>Nepal</strong>. Department of Mines and Geology, Kathmandu.<br />
(Internet) data sources:<br />
Elevation data (SRTM): Isciences, Michigan, USA<br />
http://www.isciences.com/index.html<br />
Moisture index data: Climate Prediction Center, Maryland, USA<br />
http://iridl.ldeo.columbia.edu/SOURCES/.NOAA/.NCEP/.CPC/.GMSM/.w/<br />
Precipitation data: Global Precipitation Climatology Centre, Deutscher<br />
Wetterdienst, Offenbach, Germany<br />
99
<strong>Nepal</strong> <strong>Hazard</strong> <strong>Risk</strong> <strong>Assessment</strong><br />
2 ANNEXURE 2<br />
EARTHQUAKE HAZARD ASSESSMENT<br />
Overall methodology can be seen in Figure 2.1. PGA map is modified from <strong>Nepal</strong> PGA map that later<br />
converted to MMI to create MMI map.<br />
Figure 2.2. Peak Ground Acceleration in <strong>Nepal</strong> (NGI, 2004), modified from map of Department of Mine and Geology of <strong>Nepal</strong>.<br />
2.1 GROUND MOTION<br />
Figure 2.1. Methodology <strong>for</strong> earthquake hazard assessment.<br />
PGA of <strong>Nepal</strong> is presented in Figure 2.2, modified from map of bedrocks peak ground acceleration from<br />
Department mine and Geology of <strong>Nepal</strong> ((Pandey et al., 2002))<br />
2.2 CONVERSION OF PGA TO MMI<br />
The wide used <strong>for</strong>mulas <strong>for</strong> conversion of PGA to MMI based on the work of (Trifunac and Brady,<br />
1975) and (Wald et al., 1999), can be seen in equation below:<br />
MMI Trifunac 1 log 980 0.014<br />
0.3<br />
MMI Wald 2.20 log 1.00<br />
The result <strong>for</strong> PGA conversion to MMI and statistic distribution can be seen in Figure 2.3, Figure 2.4,<br />
Figure 2.5, and Figure 2.6. The conversion of PGA to MMI usually saturated in MMI value of 8,<br />
there<strong>for</strong>e maximum value of MMI by conversion <strong>for</strong> dangerous zone will be around value of 8.<br />
100
<strong>Nepal</strong> <strong>Hazard</strong> <strong>Risk</strong> <strong>Assessment</strong><br />
Figure 2.3. MMI map from PGA conversion (Trifunac).<br />
Figure 2.5. MMI map from PGA conversion (Wald).<br />
Figure 2.4. Statistics of MMI (Trifunac)<br />
Figure 2.6. Statistics of MMI (Wald)<br />
101
<strong>Nepal</strong> <strong>Hazard</strong> <strong>Risk</strong> <strong>Assessment</strong><br />
2.3 RETURN PERIOD CALCULATION<br />
For lower return period analysis we basically run the model of PSHA based on report from Seismic<br />
<strong>Hazard</strong> of <strong>Nepal</strong> assessment by Department of Mines and Geology. Several sources identified as seen in<br />
Figure 2.7. Detachment area source characterize higher magnitude (and more rare) earthquake. Thrust<br />
fault sources characterized most of moderate and high earthquake in <strong>Nepal</strong> (magnitude of 6 – 7.3).<br />
Character of detachment zone are described as ((Pandey et al., 2002)):<br />
- Segmentation of the MHT using seismological and geological symptoms<br />
- Assignment of Magnitude on the basis of arc length or surface area<br />
- M>7.3<br />
- Assignment of Mean return period (expert's opinion)<br />
- Adaptation of Characteristic Fault model <strong>for</strong> PSHA<br />
For thrust and transverse faults the following operations have been carried out to determine source<br />
characteristics:<br />
- Delineation of linear segments from microseismic observations and structural geological map<br />
- M < 6.3 corresponding to approximately 40 km length of linear segments<br />
- Assignment of seismicity parameters from DMG catalogue<br />
- Adaptation of Poisonian model<br />
Overall report of DMG (department of mines and geology) earthquake hazard assessment will be given<br />
in attachment (pdf file).<br />
Figure 2.7. Earthquake sources in <strong>Nepal</strong><br />
The analysis evolved on trial and error basis to match parameter from DMG. Flow chart <strong>for</strong> creating<br />
PGA map <strong>for</strong> lower return period is provided in Figure 2.8. The latest map result is presented in Figure<br />
2.9. PSHA analysis also produced several return period value, which trend will be used <strong>for</strong> the<br />
continuous zone of PGA (PGA map provided from NGI).<br />
102
<strong>Nepal</strong> <strong>Hazard</strong> <strong>Risk</strong> <strong>Assessment</strong><br />
Average value of each PGA (different return period base on PSHA analysis) is calculated. This will<br />
resulted in several value decrements as seen in Table 2.1. This decrement value is applied to the baseline<br />
PGA from NGI (Figure 2.2). The results of peak ground acceleration <strong>for</strong> lower return periods are given<br />
in Figure 2.10, Figure 2.11, Figure 2.12. Values of PGA in lower return periods have maximum value of<br />
±150 gals that quite low <strong>for</strong> usual structural building standard.<br />
Table 2.1. average value decrements of PGA<br />
PGA 050<br />
year<br />
PGA 100<br />
year<br />
PGA 250<br />
year<br />
PGA 500<br />
year<br />
average PGA 0.13 0.19 0.30 0.39<br />
ratio 0.34 0.49 0.75 1.00<br />
Figure 2.8. Flowchart in creating PGA value <strong>for</strong> lower return period<br />
Figure 2.10. Peak Ground Acceleration in <strong>Nepal</strong>, 250 year return period.<br />
Figure 2.9. PGA of 475 year return period based on analysis.<br />
103
<strong>Nepal</strong> <strong>Hazard</strong> <strong>Risk</strong> <strong>Assessment</strong><br />
2.4 MODEL FOR CONVERTING PGA TO MMI<br />
Conversion of PGA to MMI is started by using table result from PSHA analysis as main input. This grid<br />
file is then plotted to map and interpolated to produce PGA map, as seen in Figure 2.13. The PGA then<br />
is converted to gals unit that resulted as PGA100 output. The PGA100 is the main intermediate input <strong>for</strong><br />
converting to MMI. Based on several equation:<br />
MMI Trifunac 1 log 980 0.014<br />
0.3<br />
MMI Wald 2.20 log 1.00<br />
MMI Wald, 5M 3.6 log 1.66<br />
PGA100 is converted to MMI. The result showed that Trifunac method has higher MMI value compared<br />
to Wald. Trifunac value peaked in around 9.2 while Wald peaked in 8.7 MMI.<br />
Figure 2.11. Peak Ground Acceleration in <strong>Nepal</strong> 100 year return period.<br />
Figure 2.13. Flowchart of converting PGA to MMI<br />
Figure 2.12. Peak Ground Acceleration in <strong>Nepal</strong> 50 year return period<br />
104
<strong>Nepal</strong> <strong>Hazard</strong> <strong>Risk</strong> <strong>Assessment</strong><br />
2.5 REFERENCE<br />
CPC, Moisture index data. Climate Prediction Center (CPC), Maryland, USA.<br />
Dilley, M., Chen, R.S., Deichmann, U., Lerner-Lam, A.L., Arnold, M., 2005. Natural <strong>Disaster</strong> Hotspots -<br />
A Global <strong>Risk</strong> Analysis. Report International Bank <strong>for</strong> Reconstruction and Development. World Bank<br />
and Columbia University.<br />
DMG, 1987. Geological Map of <strong>Nepal</strong>, 1:250,000 scale (5 sheets). Department of Mines and Geology<br />
(DMG), Kathmandu, <strong>Nepal</strong>.<br />
Nadim, F., Kjekstad, O., Peduzzi, P., Herold, C., Jaedicke, C., 2006. Global landslide and avalanche<br />
hotspots. Landslides 3, 159 - 174.<br />
NGI, 2004. Landslide hazard and risk assessment in <strong>Nepal</strong> - A desk study. NGI Report 20041239-1.<br />
Norwegian Geotechnical Institute (NGI).<br />
Pandey, M.R., Chitrakar, G.R., Kafle, B., Sapkota, S.N., Rajaure, S., Gautam, U.P., 2002. Seismic<br />
<strong>Hazard</strong> Map of <strong>Nepal</strong>. Department of Mines and Geology, Kathmandu.<br />
Trifunac, M.D., Brady, A.G., 1975. A Study on the Duration of Strong Earthquake Ground Motion.<br />
Bulletin of Seismology Society America 65, 581-626.<br />
Wald, D.J., Quitoriano, V., Heaton, T.H., Kanamori, H., 1999. Relationships between Peak Ground<br />
Acceleration, Peak Ground Velocity, and Modified Mercalli Intensity in Cali<strong>for</strong>nia. Earthquake Spectra<br />
15.<br />
105
<strong>Nepal</strong> <strong>Hazard</strong> <strong>Risk</strong> <strong>Assessment</strong><br />
3 ANNEXURE 3<br />
DROUGHT HAZARD ASSESSMENT METHODOLOGY<br />
(a)<br />
Moderate drought in Winter<br />
(b)<br />
Severe drought in Winter<br />
In order to understand the drought hazard in <strong>Nepal</strong>, the SPI was used to quantify the precipitation deficit<br />
<strong>for</strong> multiple time scales, which reflect the impact of drought in different locations of <strong>Nepal</strong>. It is<br />
reasonable and more convenient to assess drought hazard and analysis at least by using two indices viz:<br />
1. Standardized Precipitation Index (SPI)<br />
2. The Soil Moisture Index (SMI)<br />
% of stations<br />
50<br />
40<br />
30<br />
20<br />
10<br />
0<br />
1978<br />
1981<br />
1984<br />
1987<br />
1990<br />
1993<br />
1996<br />
1999<br />
2002<br />
2005<br />
% of stations<br />
50<br />
40<br />
30<br />
20<br />
10<br />
0<br />
1978<br />
1981<br />
1984<br />
1987<br />
1990<br />
1993<br />
1996<br />
1999<br />
2002<br />
2005<br />
3.1 STANDARDIZED PRECIPITATION INDEX (SPI)<br />
Year<br />
Year<br />
SPI has been computed <strong>for</strong> all the seasons from 1977 to 2007 to investigate the spatial and temporal<br />
variation of drought and its severity.<br />
(c)<br />
Extreme drought in Winter<br />
(a) Temporal variation of drought<br />
Year to year variation of SPI <strong>for</strong> winter, premonsoon, monsoon and postmonsoon seasons <strong>for</strong> each<br />
station were computed. In order to comprehend the behavior of drought more concisely and holistically<br />
interannual variation of moderate to extreme drought occurrence (expressed in percentage of “drought”<br />
station out of all data available stations) was also computed (Figure 3.1 - Figure 3.4). The figures show<br />
that drought of all category occurs in <strong>Nepal</strong> in all seasons. It seems that moderate drought frequently<br />
occurs in all the seasons. But severe and extreme droughts in comparison are less common. All<br />
categories of drought show increasing trend in winter season. Severe and extreme droughts which used<br />
to be less common in winter season have now been observed in many stations recently. It indicates that<br />
winter droughts are getting intense in <strong>Nepal</strong>. During the premonsoon season, moderate drought show<br />
slightly increasing trend but the severe and extreme drought both showed decreasing trend. This means<br />
less number of stations recorded intense droughts in the recent decade during the premonsoon season. In<br />
the monsoon season the trend in all categories of drought are decreasing. Interestingly, the extreme<br />
droughts have occurred sporadically during monsoon however, there was a lull period in the 90's. On the<br />
contrary, during the 90's the severe drought was experienced in more stations in the postmonsoon<br />
season. Extreme droughts though occurred during the 80's and 90's in this season but were observed only<br />
in few places. From 2001 to 2007 the extreme drought was not recorded at all.<br />
(a)<br />
% of stations<br />
35<br />
30<br />
25<br />
20<br />
15<br />
10<br />
5<br />
0<br />
% of stations<br />
50<br />
40<br />
30<br />
20<br />
10<br />
0<br />
1978<br />
1981<br />
1984<br />
1987<br />
1990<br />
1993<br />
1996<br />
1999<br />
2002<br />
2005<br />
Year<br />
Figure 3.1. Interannual variation of a) moderate b) severe and c) extreme drought occurrence during winter<br />
Moderate drought in Premonsoon<br />
(b) Severe drought in Premonsoon<br />
35<br />
30<br />
% of stations<br />
25<br />
20<br />
15<br />
10<br />
5<br />
0<br />
1977<br />
1980<br />
1983<br />
1986<br />
1989<br />
1992<br />
1995<br />
1998<br />
2001<br />
2004<br />
2007<br />
1977<br />
1980<br />
1983<br />
1986<br />
1989<br />
1992<br />
1995<br />
1998<br />
2001<br />
2004<br />
2007<br />
Year<br />
Year<br />
106
<strong>Nepal</strong> <strong>Hazard</strong> <strong>Risk</strong> <strong>Assessment</strong><br />
(c)<br />
% of stations<br />
35<br />
30<br />
25<br />
20<br />
15<br />
10<br />
5<br />
0<br />
1977<br />
Extreme drought in Premonsoon<br />
1980<br />
1983<br />
1986<br />
1989<br />
1992<br />
1995<br />
1998<br />
2001<br />
Year<br />
2004<br />
2007<br />
(a) Moderate drought in Postmonsoon<br />
50<br />
% of stations<br />
40<br />
30<br />
20<br />
10<br />
0<br />
1977<br />
1980<br />
1983<br />
1986<br />
1989<br />
1992<br />
1995<br />
1998<br />
2001<br />
2004<br />
Year<br />
2007<br />
(b)<br />
% of stations<br />
50<br />
40<br />
30<br />
20<br />
10<br />
0<br />
1977<br />
Severe drought in Postmonsoon<br />
1980<br />
1983<br />
1986<br />
1989<br />
1992<br />
1995<br />
1998<br />
2001<br />
Year<br />
2004<br />
2007<br />
Figure 3.2. Interannual variation of a) moderate b) severe and c) extreme drought occurrence during premonsoon<br />
(c)<br />
Extreme drought in Postmonsoon<br />
(a)<br />
% of stations<br />
40<br />
30<br />
20<br />
10<br />
0<br />
1977<br />
Moderate drought in Monsoon<br />
1980<br />
1983<br />
1986<br />
1989<br />
1992<br />
1995<br />
1998<br />
2001<br />
Year<br />
2004<br />
2007<br />
(b)<br />
% of stations<br />
40<br />
30<br />
20<br />
10<br />
0<br />
1977<br />
Severe drought in Monsoon<br />
1980<br />
1983<br />
1986<br />
1989<br />
1992<br />
1995<br />
1998<br />
2001<br />
Year<br />
2004<br />
2007<br />
% of stations<br />
50<br />
40<br />
30<br />
20<br />
10<br />
0<br />
1977<br />
1980<br />
1983<br />
1986<br />
1989<br />
1992<br />
1995<br />
1998<br />
2001<br />
2004<br />
2007<br />
Year<br />
Figure 3.4. Interannual variation of a) moderate b) severe and c) extreme drought occurrence during postmonsoon<br />
(c)<br />
% of stations<br />
40<br />
30<br />
20<br />
10<br />
Extreme drought in Monsoon<br />
The result coming out from these graphs (Figure 3.1 - Figure 3.4) is as shown in Table 3.1.<br />
Table 3.1: Summary of drought situation<br />
Drought type Winter Premonsoon Monsoon Postmonsoon<br />
0<br />
1977<br />
1980<br />
1983<br />
1986<br />
1989<br />
1992<br />
Year<br />
1995<br />
1998<br />
2001<br />
2004<br />
Moderate Most common Occur most<br />
frequently<br />
Most common<br />
Sporadic but reported in<br />
less number of stations<br />
recently<br />
Figure 3.3. Interannual variation of a) moderate b) severe and c) extreme drought occurrence during monsoon<br />
Severe Sporadic but<br />
reported in more<br />
stations recently<br />
Less occurrence<br />
in recent years.<br />
1996 a worst<br />
premonsoon<br />
drought year<br />
Occur<br />
intermittently<br />
Infrequent. Common<br />
during 1988 to 1994.<br />
107
<strong>Nepal</strong> <strong>Hazard</strong> <strong>Risk</strong> <strong>Assessment</strong><br />
Extreme Did not exist<br />
be<strong>for</strong>e 1999.<br />
2006 is a worst<br />
winter drought<br />
year<br />
(b) Drought occurrence probability<br />
More common<br />
since 1990's, but<br />
reported in less<br />
number of<br />
stations recently<br />
Lull period<br />
during 1990's.<br />
Occur in few<br />
places<br />
Rare and reported in only<br />
few places. Has not<br />
occurred since 2001.<br />
The average probabilities of occurrence of moderate, severe and extreme droughts have been computed<br />
and depict the climatological (1977-2007) and decadal probabilities <strong>for</strong> the four seasons (Tables 2, 3 and<br />
4).<br />
The Table 3.2 depicts the climatological (1977-2007) and decadal probability of occurrence of moderate<br />
drought <strong>for</strong> the four seasons. Climatologically, monsoon shows less probability (3.2%) and premonsoon<br />
shows high probability (8.3%) of experiencing moderate drought. In both of these seasons including<br />
postmonsoon season, during 1988-1997, the probability of drought occurrence increased, but decreased<br />
again during 1998-2007. However winter drought showed a slight decrease during 1988-1997 but the<br />
probability increased (10.3%) in the recent decade (1998-2007). This indicates that chances of occurring<br />
droughts in winter are increasing and are more than the other seasons. So there is need to promote<br />
drought tolerant verities and prioritize research in development of drought resistance varieties especially<br />
<strong>for</strong> winter crops. Emerging threats to food security also demand the need of building irrigation<br />
infrastructure in highly productive but drought susceptible areas.<br />
Table 3.2: Moderate drought occurrence probability (%)<br />
Winter Premonsoon Monsoon Postmonsoon<br />
Climatology 7.7 8.3 3.2 6.5<br />
1977-1987 6.4 8.9 8.2 6.4<br />
1988-1997 6.1 9.3 10.9 13.2<br />
1998-2007 10.3 5.2 4.6 5.4<br />
Table 3.3 depicts the climatological (1977-2007) and decadal probability of occurrence of severe<br />
droughts <strong>for</strong> the four seasons. Climatologically, monsoon shows less probability of occurrence (3.8%)<br />
and winter shows comparatively high probability (5.3%) of experiencing severe drought. In monsoon the<br />
probability decreased during 1988-1997 but increased slightly during 1998-2007. During premonsoon<br />
and postmonsoon seasons the probability increased during the 1988-1997 decade but then decreased<br />
again significantly during 1998-2007. However winter drought showed no change in average probability<br />
during 1988-1997 but the probability remarkably increased (11.3%) in the recent decade (1998-2007).<br />
This indicates that chances of occurring severe droughts in winter have increased significantly and are<br />
also more than in the other seasons.<br />
Table 3.3: Severe drought Occurrence probability (%)<br />
Winter Premonsoon Monsoon Postmonsoon<br />
Climatology 5.3 4.2 3.8 3.9<br />
1977-1987 2.3 4.2 4.6 1.6<br />
1988-1997 2.3 6.7 3 7.5<br />
1998-2007 11.3 1.7 3.6 2.8<br />
Table 3.4 depicts the climatological (1977-2007) and decadal probability of occurrence of extreme<br />
drought <strong>for</strong> the four seasons. Climatologically, postmonsoon shows less probability (3.8%) and pre and<br />
post monsoon show comparatively high probability (3.5%) of experiencing extreme drought. In<br />
monsoon the probability decreased during 1988-1997 but increased again during 1998-2007. During<br />
premonsoon and postmonsoon seasons the probability increased during the 1988-1997 decade but then<br />
decreased again during 1998-2007. However winter drought showed increase in probability of<br />
occurrence during 1988-1997 (0.5%) and significantly (7.6%) in the recent decade (1998-2007). This<br />
indicates that chances of occurring extreme droughts in winter have increased significantly and are also<br />
higher than in the other seasons.<br />
Table 3.4: Extreme drought occurrence probability (%)<br />
Winter Premonsoon Monsoon Postmonsoon<br />
Climatology 2.8 3.5 3.5 0.9<br />
1977-1987 0.4 2.8 5.5 0.7<br />
1988-1997 0.5 5.7 0.8 1.3<br />
1998-2007 7.6 2.2 4.1 0.8<br />
The probability of occurrence of moderate to extreme droughts was also computed (Table 3.5). The table<br />
depicts the climatological and decadal probability <strong>for</strong> all the seasons. Climatologically, postmonsoon<br />
shows less probability (13.6%) and premonsoon shows most probability (15.9%) of experiencing<br />
drought in <strong>Nepal</strong>. In both of these seasons, during 1988-1997, the probability of drought occurrence<br />
increased suddenly, but decreased significantly again during 1998-2007. The monsoon season shows the<br />
decrease in the probability in later decades. Winter season however shows a large increase in the<br />
probability (28.7%) in the recent decade (1998-2007). This indicates that chances of occurring droughts<br />
in winter are more than in the other seasons.<br />
Table 3.5: Probability of occurrence of moderate to extreme drought (%)<br />
Winter Premonsoon Monsoon Postmonsoon<br />
Climatology 15.3 15.9 15.5 13.6<br />
1977-1987 8.7 15.9 18.1 8.7<br />
1988-1997 8.4 21.4 14.7 22.0<br />
1998-2007 28.7 10.6 13.7 10.4<br />
108
<strong>Nepal</strong> <strong>Hazard</strong> <strong>Risk</strong> <strong>Assessment</strong><br />
(c) Spatial variation of drought<br />
Spatial variation of drought is equally important as the temporal variation, as it shows the areas<br />
more/less prone to various <strong>for</strong>ms of droughts. Probability of moderate, severe and extreme droughts <strong>for</strong><br />
all seasons was computed <strong>for</strong> each station and presented in Table 3.6. From the table, one can easily<br />
compare drought susceptible locations and seasons amongst the stations.<br />
• During the winter there is higher chance of occurring severe drought in Dhangadhi (18.5%) and<br />
<strong>Nepal</strong>ganj (16.7%) and extreme drought in Dhangadhi (18.5%) compared to other places. Moderate<br />
drought is more likely in Nagarkot (27.6%), Tulsipur (17.2%), Daman (17.2%) and Tarahara<br />
(16.7%).<br />
• During premonsoon Jiri (17.1%), Jumla (16.1%) and Lumle (16.1%) may experience moderate<br />
drought. Where as severe drought is more probable in Pusmacamp (10.3%), Daman (10.3%) and<br />
Tarahara (9.7%) and extreme drought in Gorkha (7.4%) and Dhangadhi (7.1%).<br />
• During monsoon there is more chances of moderate drought in Rampur (19.4%) and Tarahara<br />
(19.4%), Severe drought in Dailekh (10%) and Dadeldhura (9.7%) and extreme drought in Jiri<br />
(7.7%) and Ilam Tea Estate (7.4%) compared to rest of the places.<br />
• During postmonsoon Gorkha (20%) and Hetauda (19.4%) are likely to experience moderate drought<br />
compared to other places. Moderate drought is probable in Kanyam Tea Estate (13.3 %), Bhairahawa<br />
(10%), Khanchikot (9.7%), Rampur (9.7%) and Jumla (9.7%) where as Biratnagar (6.5%) is more<br />
prone to extreme drought in this season.<br />
Table 3.6: Probability of drought occurrence (%)<br />
Station winter premonsoon monsoon postmonsoon<br />
MOD SED EXD MOD SED EXD MOD SED EXD MOD SED EXD<br />
DADELDHURA 3.3 6.7 6.7 12.9 0.0 3.2 9.7 9.7 0.0 6.5 6.5 0.0<br />
MAHENDRA NAGAR 13.6 4.5 4.5 0.0 8.7 4.3 8.3 4.2 4.2 0.0 0.0 0.0<br />
CHAINPUR (WEST) 3.3 3.3 6.7 9.7 0.0 3.2 10.0 0.0 3.3 12.9 6.5 0.0<br />
SILGADHI DOTI 6.7 6.7 3.3 9.7 0.0 3.2 3.4 3.4 3.4 0.0 0.0 0.0<br />
DHANGADHI 3.7 18.5 18.5 10.7 3.6 7.1 13.8 3.4 3.4 0.0 0.0 0.0<br />
JUMLA 0.0 6.7 3.3 16.1 0.0 3.2 3.2 0.0 6.5 3.2 9.7 0.0<br />
PUSMA CAMP 3.3 6.7 3.3 6.9 10.3 0.0 10.0 3.3 3.3 0.0 0.0 0.0<br />
DAILEKH 3.6 7.1 3.6 6.9 3.4 3.4 3.3 10.0 3.3 0.0 0.0 0.0<br />
CHISAPANI (KARNALI) 3.4 6.9 3.4 6.5 6.5 3.2 0.0 3.2 3.2 13.3 6.7 0.0<br />
BIRENDRA NAGAR 10.0 3.3 3.3 9.7 6.5 3.2 6.5 3.2 3.2 12.9 0.0 0.0<br />
NEPALGANJ (REG.OFF.) 0.0 16.7 0.0 12.9 9.7 0.0 13.3 6.7 0.0 0.0 0.0 0.0<br />
TULSIPUR 17.2 6.9 0.0 6.7 0.0 6.7 6.9 6.9 3.4 16.1 0.0 0.0<br />
CHAUR JHARI TAR 6.9 3.4 3.4 6.5 6.5 3.2 12.9 3.2 3.2 16.1 0.0 0.0<br />
JOMSOM 10.7 3.6 0.0 6.7 3.3 6.7 13.3 0.0 6.7 0.0 0.0 0.0<br />
DUMKAULI 6.7 6.7 0.0 6.5 3.2 3.2 12.9 3.2 3.2 10.0 6.7 0.0<br />
BHAIRAHAWA (AGRIC) 3.4 6.9 3.4 3.3 3.3 6.7 6.7 6.7 3.3 10.0 10.0 0.0<br />
KHANCHIKOT 6.7 0.0 3.3 10.0 3.3 6.7 3.2 6.5 3.2 6.5 9.7 0.0<br />
KHUDI BAZAR 0.0 3.4 3.4 0.0 3.3 3.3 9.7 3.2 3.2 6.5 3.2 3.2<br />
POKHARA AIRPORT 10.0 3.3 3.3 12.9 6.5 0.0 9.7 0.0 6.5 9.7 3.2 3.2<br />
GORKHA 6.9 6.9 0.0 11.1 0.0 7.4 9.7 6.5 6.5 20.0 0.0 0.0<br />
LUMLE 13.3 3.3 3.3 16.1 6.5 0.0 3.2 0.0 6.5 6.5 6.5 0.0<br />
KHAIRINI TAR 0.0 6.7 0.0 9.7 3.2 6.5 13.3 6.7 0.0 16.7 0.0 3.3<br />
RAMPUR 0.0 0.0 6.7 6.5 3.2 3.2 19.4 3.2 0.0 9.7 9.7 0.0<br />
Station winter premonsoon monsoon postmonsoon<br />
MOD SED EXD MOD SED EXD MOD SED EXD MOD SED EXD<br />
DAMAN 17.2 0.0 0.0 0.0 10.3 0.0 13.8 0.0 3.4 13.8 0.0 0.0<br />
HETAUNDA N.F.I. 6.7 6.7 0.0 12.9 0.0 3.2 12.9 6.5 0.0 19.4 3.2 0.0<br />
SIMARA AIRPORT 0.0 3.3 10.0 6.5 6.5 3.2 9.7 6.5 0.0 9.7 6.5 3.2<br />
PARWANIPUR 13.3 0.0 0.0 6.5 6.5 3.2 9.7 9.7 0.0 12.9 6.5 0.0<br />
KAKANI 3.6 10.7 0.0 10.0 3.3 3.3 12.9 0.0 6.5 6.5 0.0 3.2<br />
KHUMALTAR 3.4 6.9 0.0 13.3 0.0 6.7 6.5 6.5 3.2 3.2 3.2 3.2<br />
NAGARKOT 27.6 0.0 0.0 10.3 6.9 0.0 10.0 3.3 6.7 16.1 6.5 0.0<br />
JIRI 3.8 3.8 3.8 17.9 7.1 0.0 0.0 0.0 7.7 16.7 3.3 0.0<br />
JANAKPUR AIRPORT 13.3 6.7 0.0 3.2 3.2 6.5 3.2 3.2 3.2 12.9 0.0 0.0<br />
OKHALDHUNGA 10.0 6.7 0.0 9.7 3.2 3.2 3.2 9.7 3.2 9.7 6.5 0.0<br />
CHAINPUR (EAST) 6.7 3.3 3.3 6.5 3.2 3.2 6.5 0.0 6.5 9.7 3.2 3.2<br />
DHANKUTA 10.0 6.7 0.0 9.7 3.2 3.2 9.7 3.2 3.2 3.2 9.7 0.0<br />
BIRATNAGAR AP. 10.0 6.7 0.0 3.2 3.2 6.5 0.0 6.5 3.2 6.5 3.2 6.5<br />
TARAHARA 16.7 0.0 0.0 3.2 9.7 0.0 19.4 3.2 0.0 13.3 3.3 3.3<br />
TAPLEJUNG 13.3 6.7 0.0 6.5 3.2 3.2 9.7 0.0 3.2 3.2 9.7 3.2<br />
ILAM TEA ESTATE 3.8 3.8 7.7 6.9 0.0 6.9 3.7 0.0 7.4 14.3 0.0 0.0<br />
KANYAM TEA ESTATE 13.8 0.0 3.4 10.0 6.7 0.0 0.0 0.0 3.4 3.3 13.3 0.0<br />
Threshold rainfall <strong>for</strong> drought occurrence (corresponding to SPI equal to minus one) is also computed<br />
<strong>for</strong> all seasons at each station (Table 3.7). Seasonal rainfall equal to or below the threshold rainfall<br />
implies drought condition <strong>for</strong> that season in the given station. As per SPI computation of 31 years,<br />
drought did not commenced in some stations during postmonsoon season though no rainfall was<br />
recorded <strong>for</strong> few years in that season i.e. SPI value was greater than minus one throughout 31 year<br />
period. This seems to be due to potential limitation in SPI in handling short duration (2 months) seasonal<br />
data, but other possible causes also need to be explored.<br />
Table 3.7: Threshold rainfall values (mm) at different stations<br />
No Station name District Winter Premonsoon Monsoon Postmonsoon<br />
0104 DADELDHURA Dadeldhura 80 111 760 4<br />
0105 MAHENDRANAGAR Kanchanpur 34 31 1175 No drought<br />
0202 CHAINPUR (WEST) Bajhang 83 105 1012 8<br />
0203 SILGADHI (DOTI) Doti 75 122 760 No drought<br />
0209 DHANGADHI (ATARIYA) Kaliali 33 43 1235 No drought<br />
0303 JUMLA Jumla 48 92 442 7<br />
0401 PUSMA CAMP Surkhet 46 71 1001 No drought<br />
0402 DAILEKH Dailekh 47 100 1000 1<br />
0405 CHISAPANI (KARNALI) Bardiya 40 58 1290 8<br />
0406 SURKHET (BIRENDRA NAGAR) Surkhet 43 75 1090 3<br />
0416 NEPALGANJ (REG.OFF.) Banke 25 48 840 No drought<br />
0508 TULSIPUR Dang Deukhuri 25 66 1088 9<br />
0513 CHAUR JHARI TAR Rukum 33 66 820 8<br />
0601 JOMSOM Mustang 6 21 82 No drought<br />
0706 DUMKAULI Nawalparasi 16 122 1650 25<br />
0707 BHAIRAHAWA (AGRIC) Rupandehi 15 51 1220 8<br />
0715 KHANCHIKOT Arghakhanchi 27 110 1106 7<br />
109
<strong>Nepal</strong> <strong>Hazard</strong> <strong>Risk</strong> <strong>Assessment</strong><br />
No Station name District Winter Premonsoon Monsoon Postmonsoon<br />
0802 KHUDI BAZAR Lamjung 41 265 2405 29<br />
0804 POKHARA AIRPORT Kaski 39 405 2612 36<br />
0809 GORKHA Gorkha 25 182 914 5<br />
0814 LUMLE Kaski 59 378 3984 126<br />
0815 KHAIRINI TAR Tanahun 28 305 1424 20<br />
0902 RAMPUR Chitawan 9 139 1362 26<br />
0905 DAMAN Makwanpur 12 171 966 9<br />
0906 HETAUNDA N.F.I. Makwanpur 12 170 1625 36<br />
0909 SIMARA AIRPORT Bara 10 101 1172 20<br />
0911 PARWANIPUR Bara 11 88 918 22<br />
1007 KAKANI Nuwakot 25 206 1892 37<br />
1029 Khumal tar Lalitpur 15 118 745 12<br />
1043 NAGARKOT Kathmandu 12 150 1177 20<br />
1103 JIRI Dolkha 18 237 1418 34<br />
1111 JANAKPUR AIRPORT Dhanusa 9 60 837 3<br />
1206 OKHALDHUNGA Okhaldhunga 20 147 1184 21<br />
1303 CHAINPUR (EAST) Sankhuwasabh 16 240 815 23<br />
a<br />
1307 DHANKUTA Dhankuta 13 131 580 9<br />
1319 BIRATNAGAR AIRPOART Morang 7 151 1090 13<br />
1320 TARAHARA Sunsari 9 190 1157 28<br />
1405 TAPLEJUNG Taplejung 36 471 1367 38<br />
1407 ILAM TEA ESTATE Ilam 10 142 801 15<br />
1416 KANYAM TEA ESTATE Ilam 22 285 1620 33<br />
(d) Monitoring Drought<br />
Monthly SPI provides a lot of useful in<strong>for</strong>mation about the drought. Time series plot of SPI (figure 5: a<br />
and b) shows the onset of drought, and its duration. Further, it provided in<strong>for</strong>mation on drought intensity.<br />
There<strong>for</strong>e SPI is a very good index <strong>for</strong> monitoring the drought. For example Figure 3.5 is the time series<br />
plot of monthly SPI <strong>for</strong> Jumla from 2003 to 2004. Figure 3.6 shows that the 2005-2006 winter drought<br />
started from December, reached its highest intensity during February, lasted <strong>for</strong> almost three months and<br />
ended in March.<br />
(e) Limitation<br />
Besides its advantages, practical applications of the SPI possess some disadvantages (Guttman, 1999). It<br />
is assumed that a suitable theoretical probability distribution can be found to model the raw precipitation<br />
data prior to standardization (Hayes et al., 1999). Another limitation of the SPI emerges from the<br />
standardization process of the index itself. Drought measured by the SPI can occur with same frequency<br />
at all locations when considered over a long time period. A third problem is that misleadingly large<br />
positive or negative SPI values may result when the index is applied at short time steps to regions of low<br />
seasonal precipitation (Sönmez et al, 2005). In analysis of short duration (2 months) seasonal data, SPI<br />
may not show drought condition even when there is high rainfall deficit or no rainfall at all during some<br />
years.<br />
SPI<br />
1.5<br />
1<br />
0.5<br />
0<br />
-0.5<br />
-1<br />
-1.5<br />
-2<br />
Jan Feb Mar Apr May Jun Jul Aug Sep Oct Nov Dec Jan Feb Mar Apr May Jun Jul Aug Sep Oct Nov Dec<br />
2003 2004<br />
Year/Month<br />
SPI<br />
2<br />
1.5<br />
1<br />
0.5<br />
0<br />
-0.5<br />
-1<br />
-1.5<br />
-2<br />
-2.5<br />
-3<br />
3.2 THE SOIL MOISTURE INDEX (SMI)<br />
Figure 3.5: Time series plot of monthly SPI <strong>for</strong> Simara from 2003 to 2004<br />
Jan Feb Mar Apr May Jun Jul Aug Sep Oct Nov Dec Jan Feb Mar Apr May Jun Jul Aug Sep Oct Nov Dec<br />
2005 2006<br />
Year/Month<br />
Figure 3.6. Time series plot of monthly SPI <strong>for</strong> Simara from 2005 to 2006<br />
It was noted above that Monthly SPI is useful method <strong>for</strong> drought monitoring in the scale of a month to<br />
few years but SPI can occur with same frequency at all locations when considered over a long time<br />
period so is not effective in monitoring long term variation in soil moisture. On the other hand, SMI is<br />
useful <strong>for</strong> monitoring the (seasonal) soil moisture variation over long periods (a decade or more) which<br />
could be useful specially in the context of climate change.<br />
110
<strong>Nepal</strong> <strong>Hazard</strong> <strong>Risk</strong> <strong>Assessment</strong><br />
1977‐<br />
2007<br />
Table 3.8. Seasonal Soil moisture index<br />
Winter Premonsoon Monsoon<br />
1977‐<br />
1987<br />
1988‐<br />
1997<br />
1998‐<br />
2007<br />
1977‐<br />
2007<br />
1977‐<br />
1987<br />
1988‐<br />
1997<br />
1998‐<br />
2007<br />
1977‐<br />
2007<br />
1977‐<br />
1987<br />
1988‐<br />
1997<br />
Moisture index is used to identify season and region with adequate or deficit soil moisture taking<br />
account of moisture surplus or deficits. Thornthwaite method was used to compute SMI <strong>for</strong> each station.<br />
Climatological and decadal seasonal soil moisture index is as shown in Table 3.8. From the table,<br />
decadal evolution of SMI <strong>for</strong> different seasons at each station can be assessed. For example in<br />
Dadendhura winter SMI is near normal in 1977-1987 but increased by about 40% in 1988-1997 and then<br />
dropped to almost half the climatological value in the 1998-2007 period.<br />
1998‐<br />
2007<br />
1977‐<br />
2007<br />
Postmonsoon<br />
1977‐ 1988‐<br />
1987 1997<br />
Station<br />
DADELDHURA 8.3 8.4 11.7 4.8 ‐1.4 3.2 ‐3.8 ‐4 74 79.3 71.1 71.3 ‐7.4 ‐3.9 ‐9.5 ‐8.9<br />
MAHENDRA<br />
NAGAR 1.1 0.7 2.6 0.1 ‐22.9 ‐22.7 ‐24.8 ‐21.7 52.4 52.2 56.8 48 ‐8.2 ‐8 ‐8.3 ‐8.2<br />
CHAINPUR (WEST) 8 7.5 12.1 4.8 ‐5.8 0.5 ‐9.2 ‐8.8 68.6 63.3 71.4 71.9 ‐6.2 ‐3.7 ‐7.6 ‐7.4<br />
SILGADHI DOTI 6.2 4.9 10.3 4 ‐7.3 ‐6.2 ‐6.9 ‐9 41.4 37 36.8 48.2 ‐5.8 ‐4.4 ‐7.3 ‐5.9<br />
DHANGADHI 0.6 0.1 1.7 ‐0.1 ‐22.2 ‐22.2 ‐23 ‐21.6 46.7 43.2 46.4 50.3 ‐8.3 ‐7.6 ‐8.6 ‐8.8<br />
JUMLA 6.2 6.8 8.9 2.9 ‐0.3 5.6 ‐3.8 ‐3.2 18.3 19.7 18 17.2 ‐5.2 ‐3.4 ‐5.8 ‐6.6<br />
PUSMA CAMP 2.5 1 3.6 2.7 ‐19.6 ‐18.6 ‐21.4 ‐19.1 62.1 60.5 66 59.8 ‐7.1 ‐5.6 ‐9.2 ‐6.6<br />
DAILEKH 2.5 2.7 3.2 1.5 ‐10.2 ‐5.9 ‐8.2 ‐17.5 112 108 127 102 ‐6.8 ‐4.3 ‐8.9 ‐7.2<br />
CHISAPANI<br />
(KARNALI) 0.5 0.2 2.1 ‐1 ‐24.1 ‐24.9 ‐23.8 ‐23.3 76.1 72.5 74 82.6 ‐7.4 ‐6.4 ‐8.3 ‐7.6<br />
BIRENDRA NAGAR 2.3 1.6 3 2.4 ‐16.8 ‐15.7 ‐18.9 ‐16 59.6 62.4 54.5 61.5 ‐6.9 ‐5.5 ‐7.8 ‐7.4<br />
NEPALGANJ ‐0.9 ‐0.9 0.1 ‐1.9 ‐25.4 ‐25.8 ‐25.6 ‐24.9 16.9 20.9 15.9 13.9 ‐7.6 ‐6.5 ‐8 ‐8.3<br />
TULSIPUR ‐1.8 ‐1.5 ‐1.9 ‐2.2 ‐20.8 ‐20.8 ‐22.1 ‐19.5 60.5 69.2 51.8 59.4 ‐4.5 ‐3.6 ‐6.6 ‐3.3<br />
CHAUR JHARI TAR 0.1 ‐0.4 0.5 0.1 ‐17.5 ‐16.1 ‐20.1 ‐16.5 27.3 35 26.4 20.9 ‐6.3 ‐5.2 ‐7.8 ‐6<br />
JOMSOM ‐2.7 ‐2.8 ‐0.8 ‐3.8 ‐15.2 ‐15.5 ‐14.1 ‐15.9 ‐35.6 ‐37.4 ‐37.5 ‐32 ‐7.1 ‐6.2 ‐6.9 ‐8.3<br />
DUMKAULI ‐2 ‐2.5 ‐0.9 ‐2.7 ‐11.5 ‐15.1 ‐14.9 ‐4.1 69.6 63.9 64.6 80.8 ‐5.2 ‐3.8 ‐7.8 ‐3.9<br />
BHAIRAHAWA ‐1.8 ‐2.5 ‐1 ‐2.1 ‐21.1 ‐22.6 ‐22.2 ‐18.6 43.7 43.3 38.9 48 ‐6.9 ‐6 ‐8 ‐6.8<br />
KHANCHIKOT 2.4 2.3 6.9 ‐1.9 ‐5.9 ‐5.7 ‐7 ‐4.9 139 165 132 120 ‐4.9 ‐2.4 ‐4.9 ‐7.4<br />
KHUDI BAZAR 1.3 0.2 4.7 ‐1.1 11.7 13.9 5.6 15.4 204 216 201 196 ‐1.6 2.1 ‐3.5 ‐3.4<br />
POKHARA 0 1.1 0.8 ‐2 25.4 20.8 19.6 35.5 238 233 239 241 3.6 5.4 1.8 3.3<br />
GORKHA ‐2.5 ‐2.3 ‐2.5 ‐2.6 0.2 1.2 0 ‐1.4 70.2 86.5 66.1 55.2 ‐7.6 ‐4.6 ‐8.9 ‐9.3<br />
LUMLE 4.3 2.4 9 1.8 36.7 29.6 35.4 45.4 536 509 545 555 16.3 15.3 12.3 21.2<br />
KHAIRINI TAR ‐1.6 ‐1.9 0.5 ‐3.2 10.4 8.1 7.4 15.6 77.2 77.4 81.6 72.7 ‐5.4 ‐3.2 ‐6.9 ‐6.2<br />
RAMPUR ‐2.3 ‐2.4 ‐1.6 ‐3 ‐12.2 ‐13.6 ‐15.9 ‐7.2 54.6 55.9 43.1 63.9 ‐6 ‐4.6 ‐7 ‐6.3<br />
DAMAN ‐0.7 ‐0.5 1.3 ‐3.3 14 18.8 8.4 14.6 144 141 124 167 ‐4.1 ‐0.7 ‐8.9 ‐3.3<br />
HETAUNDA ‐2.7 ‐2.9 ‐1.1 ‐4.1 ‐7.6 ‐9.1 ‐9.2 ‐4.4 102 99.8 83.2 124 ‐3.2 ‐1 ‐5.7 ‐2.9<br />
SIMARA ‐2.7 ‐2.6 ‐2.1 ‐3.3 ‐15.2 ‐15.3 ‐17.6 ‐12.7 51.8 52.9 35.3 66.8 ‐6.9 ‐5.6 ‐8 ‐7.2<br />
PARWANIPUR ‐2.8 ‐2.8 ‐2.3 ‐3.4 ‐18.4 ‐18.9 ‐19.4 ‐16.7 31.5 32.9 18.9 42.7 ‐8 ‐6.5 ‐9.3 ‐8.5<br />
KAKANI ‐1.6 ‐1.9 0.6 ‐3.3 14.2 7.3 15 20 265 252 271 273 ‐1.6 1.3 ‐5.2 ‐1<br />
KHUMALTAR ‐1.5 ‐1.1 ‐0.1 ‐3.1 ‐4.2 ‐4.5 ‐6.2 ‐2.1 48.6 57.6 44 43.5 ‐6.3 ‐2.7 ‐9 ‐7.4<br />
NAGARKOT ‐2.8 ‐5 0.6 ‐3.5 3.9 ‐3.6 6.8 9.3 157 139 171 162 ‐3 ‐1.1 ‐5.9 ‐2.3<br />
JIRI 0.2 ‐0.4 1.6 ‐0.7 17.6 13.4 20.4 19.2 200 184 207 211 ‐1.3 ‐1.7 ‐2.6 0.1<br />
JANAKPUR ‐3.6 ‐3.2 ‐3.1 ‐4.6 ‐18.2 ‐18.9 ‐19.5 ‐16.1 24.3 16.7 17.2 39.3 ‐8.2 ‐6.2 ‐9.9 ‐8.6<br />
OKHALDHUNGA ‐5 ‐5.1 ‐3.4 ‐6.6 1.1 ‐2.3 1 4.7 126 120 132 127 ‐4.5 ‐2.4 ‐7.3 ‐4.1<br />
CHAINPUR (EAST) ‐5.4 ‐6.4 ‐4.2 ‐5.4 7.3 5 6.6 10.5 57.2 50.9 50.7 70.9 ‐5.7 ‐4.1 ‐7.7 ‐5.4<br />
DHANKUTA ‐5.3 ‐5.8 ‐3.9 ‐6.1 ‐7.3 ‐8.2 ‐8.2 ‐5.8 30.5 34.8 31.5 24.3 ‐6.6 ‐3.9 ‐8.6 ‐7.4<br />
BIRATNAGAR ‐4.3 ‐5 ‐3 ‐4.6 ‐12.6 ‐12.8 ‐13.6 ‐11.3 47 45 44.8 50.8 ‐6.2 ‐5.5 ‐7.6 ‐5.6<br />
TARAHARA ‐3.7 ‐4 ‐3 ‐4.2 ‐9.2 ‐10.8 ‐10.1 ‐6.8 51.5 50 54.1 50.4 ‐5.4 ‐4.1 ‐7.7 ‐4.6<br />
TAPLEJUNG ‐1.2 ‐3.3 1.7 ‐2.4 28.6 29 30 26.8 128 130 126 127 ‐0.5 1.8 ‐3.6 0.2<br />
ILAM ‐6.2 ‐7 ‐3.9 ‐7.8 ‐4.6 ‐4.4 ‐4.4 ‐4.9 95.7 96 109 80.1 ‐5 ‐2.2 ‐9.5 ‐3<br />
KANYAM ‐1.3 ‐0.4 0.6 ‐4.5 20.7 23.5 16.7 21.8 279 281 304 245 5.2 11.7 1.8 1.2<br />
1998‐<br />
2007<br />
(a) Soil Moisture climatology<br />
The SMI maps are useful to identify areas with excess and deficit soil moisture in different seasons.<br />
Comparison of climatological moisture index map of four seasons (Figure 3.7d, Figure 3.8d, Figure 3.9d,<br />
Figure 3.10d) clearly shows that monsoon is the season with highest moisture surplus. The comparison<br />
also shows that there is moisture deficit over largest portion of the country in postmonsoon season where<br />
as it is more severe in larger portion of country in premonsoon season. In winter, there is moisture<br />
surplus in western half of the country but deficit in the eastern half. Seasonal and spatial variation of<br />
SMI is described below:<br />
Monsoon:<br />
Monsoon is wettest season with about 80% of the annual rainfall. As a result, there is moisture surplus<br />
all over the country except <strong>for</strong> northern side of Dolpa district and western portion of Jomsom district.<br />
Due to lack of representative station from this region there is low confidence in the severity and extent of<br />
the moisture deficit as depicted in the Figure 3.9d. On the other hand, moisture index is highest in Lumle<br />
region where the monsoon seasonal moisture index is over 500 which is understandable as this is the<br />
region of highest monsoon and annual rainfall. During this season, moisture index is higher over regions<br />
adjacent to Lumle (Central part of Western development region), Northern belt of Central development<br />
region and far eastern part of eastern development region (SMI > 200). In comparison, moisture surplus<br />
is low over Far and mid western development region and southern portion of Western, Central and<br />
Eastern development regions (SMI < 100). In rest of the country, Moisture index is of moderate<br />
magnitude (SMI between 100 and 200).<br />
Winter:<br />
The pattern of moisture budget closely follows the rainfall (precipitation) pattern in this season. Winter<br />
precipitation in the country is influenced by western disturbances, so there is highest amount of winter<br />
precipitation in the north western part of the country which gradually decreases towards the east. This<br />
pattern of winter precipitation is closely matched by climatological winter moisture index of the country<br />
where there is highest moisture surplus (SMI > 8) in the northwestern portion which gradually decreases<br />
in the southeastern direction (Figure 3.7d). Moisture index is positive over far western and Midwestern<br />
development region except <strong>for</strong> few districts in south. It is also positive over about half of the western<br />
development region. The moisture index is negative over the eastern half of the country and Jomsom and<br />
adjacent areas. Moisture deficit is highest over Tarai and mid mountains of the eastern development<br />
region (SMI < -4).<br />
111
<strong>Nepal</strong> <strong>Hazard</strong> <strong>Risk</strong> <strong>Assessment</strong><br />
Premonsoon:<br />
During premosoon season, moisture index is positive over mid and high mountains of the east, central<br />
and western development regions except Jomsom district (moisture surplus over the northwest part of<br />
the country is not considered due to lack of representative station over that region: Figure 3.8d). Out of<br />
this, moisture surplus is highest over the eastern mountains and Lumle region (SMI > 20). Moisture<br />
index is negative over Tarai and Siwalik belts out of which Soil moisture deficit is highest over the<br />
Tarai/ Siwalik range of mid and far western development regions (SMI < -20). There is moisture deficit<br />
over rest of the far western, Midwestern and western parts of western development regions.<br />
Postmonsoon:<br />
This is the season of lowest rainfall in western regions of <strong>Nepal</strong>. Moisture index is predominantly<br />
negative (deficit) in this season. Except <strong>for</strong> Lumle region and far eastern portion of the country moisture<br />
index is deficit in rest of the country (Figure 3.10d). Except <strong>for</strong> Lumle positive values of SMI is confined<br />
below 5 in surplus regions where as over more than half of the country SMI is below -5.<br />
(b) Comparison of decadal and climatological moisture index<br />
Using the values tabulated in Table 3.8, decadal and climatological SMI maps are plotted. These maps<br />
are analyzed to assess the decadal fluctuation of SMI at different region in different seasons. This study<br />
is limited <strong>for</strong> the period of just over 3 decade so it doesn’t give a very clear picture of the decadal<br />
evolution of SMI but later studies can build on it and monitor the SMI variation over the long term in the<br />
context of climate change. In following section spatial pattern of three decadal moisture indices was<br />
compared against climatological moisture index <strong>for</strong> all seasons.<br />
Winter:<br />
Figure 6 shows that there is moisture surplus in largest portion of the country in the period 1988-1997<br />
while moisture deficit in largest portion of the country in the period 1988-2007 with the intermediate<br />
condition in 1977-1987 period. In 1977-1987 and 1988-1997 period highest positive amplitude of<br />
moisture index was observed in north-western part of the large portion of the country (SMI > 8)<br />
compared to 1998-2007. Likewise, moisture surplus is noted over the far western, large portion of mid<br />
western and parts of western region in 1977-1987, which extends further eastward and covers most of<br />
mid western and mountainous region in east and central region in 1988-1997 period. In 1998-2007<br />
period moisture deficit penetrated further westward and moisture surplus was confined to small region in<br />
far and mid western regions. Moreover, area with highest deficit (SMI < -4) covered larger geographical<br />
extent over Tarai and mid mountain in eastern region. These finding are again in agreement with decadal<br />
variation of probability of drought occurrence in winter as computed from SPI (Table 3.5), where the<br />
probability is least in 1988-1997 (which is almost equal that in the first decade) but increases sharply in<br />
the final decade.<br />
Premonsoon:<br />
Comparison of three decadal and climatological spatial pattern of premonsoon moisture index doesn’t<br />
depict considerable differences however some subtle differences are noted mainly over the western parts<br />
of the country (figure 7). In 1977-1987 decade there was mild moisture surplus in the northwest portion<br />
of the country which is absent in the following two decades, on the other hand out of three decades,<br />
magnitude of moisture surplus is highest in 1988-1997 decade over the Lumle region. The areal extent of<br />
severe moisture deficit was largest in the 1998-2007 decade and covered most of Tarai and Siwalik belts<br />
of far and mid western regions. These findings are not consistent with decadal variation of probability of<br />
drought occurrence in premonsoon as computed from SPI (Table 3.5), where the probability is least in<br />
1998-2007 and highest in 1988-1997.<br />
Monsoon:<br />
No significant change in moisture index is seen between the three decades and the climatology during<br />
monsoon season (Figure 3.9). This is apparently because of large magnitude of the moisture index and<br />
only small fluctuations in decadal mean. This is in line with the relatively constant probability of<br />
occurrence of monsoon drought <strong>for</strong> different decade and climatology as computed from SPI (Table 3.8).<br />
This is understandable as monsoon is the dominant system with excessive rainfall.<br />
Postmonsoon:<br />
This is the season with moisture deficit over almost the entire country with surplus in Lumle pocket and<br />
small parts of eastern region (figure 9). The areal extent and severity of moisture deficit is highest in the<br />
1988-1997 decade. Severity of moisture deficit is least in 1977-1987 decade and aerial extent of<br />
moisture surplus is also larger in this decade. The decade of 1998-2007 lies in between in terms of aerial<br />
extent and severity of moisture deficit. However, moisture surplus was of highest magnitude in the 1998-<br />
2007 decade over Lumle region. These finding are again in agreement with decadal variation of<br />
probability of drought occurrence in postmonsoon as computed from SPI (Table 3.5), where the<br />
probability is least in 1977-1987 but increased sharply in the 1988-1997 and finally dropped to almost<br />
the first decade value in the final decade.<br />
112
<strong>Nepal</strong> <strong>Hazard</strong> <strong>Risk</strong> <strong>Assessment</strong><br />
(c) Advantage and limitation of soil moisture index<br />
• Moisture index allows <strong>for</strong> comparison of temporal (seasonal) and spatial variation of moisture<br />
budget.<br />
• Being an index based on climatological consideration this method is suitable <strong>for</strong> computing temporal<br />
variation over the long term only. So this method is not suitable <strong>for</strong> monitoring drought over the<br />
short term period.<br />
• This method doesn’t take into consideration water holding capacity of the soil and so doesn’t carry<br />
over moisture surplus in one season to augment deficit in the following season.<br />
•<br />
(c)<br />
30<br />
29<br />
28<br />
27<br />
80 81 82 83 84 85 86 87 88<br />
(d)<br />
30<br />
29<br />
28<br />
27<br />
80 81 82 83 84 85 86 87 88<br />
(a)<br />
(b)<br />
-30 -20 -10 0 10 20 30 40<br />
30<br />
30<br />
Figure 3.8. Decadal (a) 1977-1987, (b) 1988-1997, (c) 1998-2007 and (d) Climatological (1977-2007) soil moisture index <strong>for</strong> premonsoon (%)<br />
29<br />
29<br />
(a)<br />
(b)<br />
28<br />
28<br />
30<br />
30<br />
27<br />
27<br />
29<br />
29<br />
80 81 82 83 84 85 86 87 88<br />
80 81 82 83 84 85 86 87 88<br />
28<br />
28<br />
(c)<br />
(d)<br />
27<br />
27<br />
30<br />
30<br />
80 81 82 83 84 85 86 87 88<br />
80 81 82 83 84 85 86 87 88<br />
29<br />
29<br />
(c)<br />
(d)<br />
28<br />
28<br />
30<br />
30<br />
27<br />
27<br />
29<br />
29<br />
80 81 82 83 84 85 86 87 88<br />
80 81 82 83 84 85 86 87 88<br />
-8 -4 0 4 8<br />
28<br />
28<br />
Figure 3.7. Decadal (a) 1977-1987, (b) 1988-1997, (c) 1998-2007 and (d) Climatological (1977-2007) soil moisture index <strong>for</strong> winter (%).<br />
27<br />
27<br />
80 81 82 83 84 85 86 87 88<br />
80 81 82 83 84 85 86 87 88<br />
(a)<br />
(b)<br />
-100 0 100 200 300 400 500<br />
30<br />
30<br />
Figure 3.9. Decadal (a) 1977-1987, (b) 1988-1997, (c) 1998-2007 and (d) Climatological (1977-2007) soil moisture index <strong>for</strong> monsoon (%)<br />
29<br />
29<br />
28<br />
28<br />
27<br />
27<br />
80 81 82 83 84 85 86 87 88<br />
80 81 82 83 84 85 86 87 88<br />
113
<strong>Nepal</strong> <strong>Hazard</strong> <strong>Risk</strong> <strong>Assessment</strong><br />
(a)<br />
(b)<br />
30<br />
30<br />
29<br />
29<br />
28<br />
28<br />
27<br />
27<br />
80 81 82 83 84 85 86 87 88<br />
80 81 82 83 84 85 86 87 88<br />
(c)<br />
(d)<br />
30<br />
30<br />
29<br />
29<br />
28<br />
28<br />
27<br />
27<br />
80 81 82 83 84 85 86 87 88<br />
80 81 82 83 84 85 86 87 88<br />
-10 -5 0 5 10 15 20<br />
Figure 3.10. Decadal (a) 1977-1987, (b) 1988-1997, (c) 1998-2007 and (d) Climatological (1977-2007) soil moisture index <strong>for</strong> postmonsoon (%)<br />
114


