

Nepal Hazard Risk Assessment - Asia-Pacific Gateway for Disaster ...
Nepal Hazard Risk Assessment - Asia-Pacific Gateway for Disaster ...
Nepal Hazard Risk Assessment - Asia-Pacific Gateway for Disaster ...

Create successful ePaper yourself
Turn your PDF publications into a flip-book with our unique Google optimized e-Paper software.
<strong>Nepal</strong> <strong>Hazard</strong> <strong>Risk</strong> <strong>Assessment</strong><br />
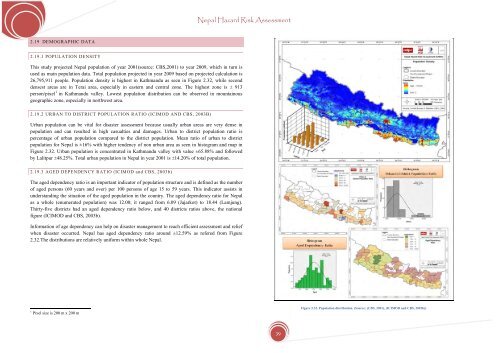
2.19 DEMOGRAPHIC DATA<br />
2.19.1 POPULATION DENSITY<br />
This study projected <strong>Nepal</strong> population of year 2001(source: CBS,2001) to year 2009, which in turn is<br />
used as main population data. Total population projected in year 2009 based on projected calculation is<br />
26,795,911 people. Population density is highest in Kathmandu as seen in Figure 2.32, while second<br />
densest areas are in Terai area, especially in eastern and central zone. The highest zone is ± 913<br />
person/pixel 1 in Kathmandu valley. Lowest population distribution can be observed in mountainous<br />
geographic zone, especially in northwest area.<br />
2.19.2 URBAN TO DISTRICT POPULATION RATIO (ICIMOD AND CBS, 2003B)<br />
Urban population can be vital <strong>for</strong> disaster assessment because usually urban areas are very dense in<br />
population and can resulted in high casualties and damages. Urban to district population ratio is<br />
percentage of urban population compared to the district population. Mean ratio of urban to district<br />
population <strong>for</strong> <strong>Nepal</strong> is ±16% with higher tendency of non urban area as seen in histogram and map in<br />
Figure 2.32. Urban population is concentrated in Kathmandu valley with value ±65.88% and followed<br />
by Lalitpur ±48.25%. Total urban population in <strong>Nepal</strong> in year 2001 is ±14.20% of total population.<br />
2.19.3 AGED DEPENDENCY RATIO (ICIMOD and CBS, 2003b)<br />
The aged dependency ratio is an important indicator of population structure and is defined as the number<br />
of aged persons (60 years and over) per 100 persons of age 15 to 59 years. This indicator assists in<br />
understanding the situation of the aged population in the country. The aged dependency ratio <strong>for</strong> <strong>Nepal</strong><br />
as a whole (enumerated population) was 12.00; it ranged from 6.09 (Jajarkot) to 18.44 (Lamjung).<br />
Thirty-five districts had an aged dependency ratio below, and 40 districts ratios above, the national<br />
figure (ICIMOD and CBS, 2003b).<br />
In<strong>for</strong>mation of age dependency can help on disaster management to reach efficient assessment and relief<br />
when disaster occurred. <strong>Nepal</strong> has aged dependency ratio around ±12.59% as refered from Figure<br />
2.32.The distributions are relatively uni<strong>for</strong>m within whole <strong>Nepal</strong>.<br />
1 Pixel size is 200 m x 200 m<br />
Figure 2.32. Population distribution. (Source: (CBS, 2001), (ICIMOD and CBS, 2003b))<br />
39


