

Nepal Hazard Risk Assessment - Asia-Pacific Gateway for Disaster ...
Nepal Hazard Risk Assessment - Asia-Pacific Gateway for Disaster ...
Nepal Hazard Risk Assessment - Asia-Pacific Gateway for Disaster ...

Create successful ePaper yourself
Turn your PDF publications into a flip-book with our unique Google optimized e-Paper software.
<strong>Nepal</strong> <strong>Hazard</strong> <strong>Risk</strong> <strong>Assessment</strong><br />
Three classes <strong>for</strong> soil moisture index are determined based on NCEP/CPC dataset:<br />
Table 1.3. Soil moisture classification.<br />
Soil moisture index (NCEP/CPC) Susceptibility Sh<br />
0 80 Low to moderate 1<br />
80 —> 160 Medium 2<br />
160 —» 250 High to very high 3<br />
The CPC data are available <strong>for</strong> download from:<br />
http://iridl.ldeo.columbia.edu/SOURCES/.NOAA/.NCEP/.CPC/.GMSM/<br />
Three classes <strong>for</strong> soil moisture index are determined based on NCEP/CPC dataset (Table 1.4):<br />
Table 1.4. Soil moisture index.<br />
Soil moisture<br />
index Susceptibility Sh<br />
(NCEP/CPC)<br />
0 → 80 Low to moderate 1<br />
80 → 160 Medium 2<br />
160 → 250 High to very high 3<br />
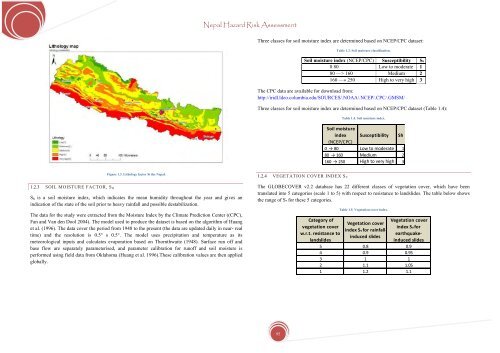
1.2.3 SOIL MOISTURE FACTOR, S H<br />
Figure 1.3. Lithology factor Si the <strong>Nepal</strong>.<br />
S h is a soil moisture index, which indicates the mean humidity throughout the year and gives an<br />
indication of the state of the soil prior to heavy rainfall and possible destabilization.<br />
The data <strong>for</strong> the study were extracted from the Moisture Index by the Climate Prediction Center ((CPC),<br />
Fan and Van den Dool 2004). The model used to produce the dataset is based on the algorithm of Huang<br />
et al. (1996). The data cover the period from 1948 to the present (the data are updated daily in near- real<br />
time) and the resolution is 0.5° x 0.5°. The model uses precipitation and temperature as its<br />
meteorological inputs and calculates evaporation based on Thornthwaite (1948). Surface run off and<br />
base flow are separately parameterised, and parameter calibration <strong>for</strong> runoff and soil moisture is<br />
per<strong>for</strong>med using field data from Oklahoma (Huang et al. 1996).These calibration values are then applied<br />
globally.<br />
1.2.4 VEGETATION COVER INDEX S V<br />
The GLOBECOVER v2.2 database has 22 different classes of vegetation cover, which have been<br />
translated into 5 categories (scale 1 to 5) with respect to resistance to landslides. The table below shows<br />
the range of Sv <strong>for</strong> these 5 categories.<br />
Category of<br />
vegetation cover<br />
w.r.t. resistance to<br />
landslides<br />
Table 1.5. Vegetation cover index.<br />
Vegetation cover<br />
index Sv <strong>for</strong> rainfallinduced<br />
slides<br />
Vegetation cover<br />
index Sv <strong>for</strong><br />
earthquakeinduced<br />
slides<br />
5 0.8 0.9<br />
4 0.9 0.95<br />
3 1 1<br />
2 1.1 1.05<br />
1 1.2 1.1<br />
95


