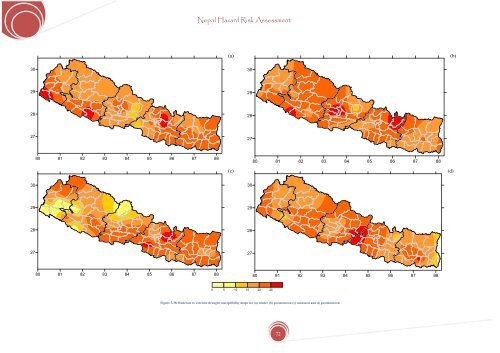
<strong>Nepal</strong> <strong>Hazard</strong> <strong>Risk</strong> <strong>Assessment</strong> (a) (b) 30 30 29 29 28 28 27 27 80 81 82 83 84 85 86 87 88 80 81 82 83 84 85 86 87 88 (c) (d) 30 30 29 29 28 28 27 27 80 81 82 83 84 85 86 87 88 80 81 82 83 84 85 86 87 88 0 5 10 15 20 25 Figure 3.38.Moderate to extreme drought susceptibility maps <strong>for</strong> (a) winter (b) premonsoon (c) monsoon and d) postmonsoon 72
<strong>Nepal</strong> <strong>Hazard</strong> <strong>Risk</strong> <strong>Assessment</strong> Severity of Drought Moderate Drought Winter Season Premonsoon Table 3.8. Drought susceptibility. Low susceptibility Daman, Tulsipur, Tarahara and their surroundings Jiri, Khairinitar, Jumla and their surroundings Monsoon Tarahara, Rampur and surroundings Postmonsoon Jiri, Nagarkot, Hetauda, Khairinitar, Gorkha, Chaurjhari Tar, Tulsipur and surroundings Severe Drought Winter <strong>Nepal</strong>ganj, Dhangadhi and surroundings Extreme Drought Moderate Extreme Drought to High susceptibility Nagarkot surrounding None None None None Premonsoon None None Monsoon None None Postmonsoon None None Winter Dhangadhi and surroundings None Premonsoon None None Monsoon None None Postmonsoon None None Winter Premonsoon Monsoon Postmonsoon Large parts of EDR, eastern half portion of CDR, small central portion of WDR, Southern parts of MWDR, western half of the FWDR Isolated spots in EDR, Large parts of CDR, Central and western parts of WDR, Almost entire MWDR, Southern parts of FWDR Nearly central parts of the EDR, Western half of CDR, Large parts of WDR and MWDR, western parts of FWDR Large parts of EDR and CDR, Southern half of WDR, Southeastern portion of MWDR, North-west parts of FWDR and Kailali, Kanchanpur, Dang, Nagarkot and surrounding areas <strong>Nepal</strong>ganj and surrounding areas, Parbat and surrounding areas, Dolakha district Gorkha, Tanahun, Chitawan districts Kavre, Adjoining areas of Bhaktapur, Dolakha and Sindhupalchowk 3.5.7 CONCLUSION AND DISCUSSION Based on SPI criteria, the following remarkable conclusions on drought years can be drawn from the study. Droughts occurrences in different seasons in different years have been depicted in Table 3.9 and Figure 3.39 to Figure 3.42 Table and figures show that winter droughts were recorded in more number of stations recently thus indicating that the winter drought spreading in large parts of the country. More than 75% of the stations recorded droughts during the winter season year 1999 and 2006. No other seasons recorded droughts in such a large number of stations. Drought was recorded in as many as 50%- 75% of the stations during winter of 2001, premonsoon of 1979 and monsoon of 1992. Most of the time, the droughts were recorded in less than half of the country. % of stations 100 90 80 70 60 50 40 30 20 10 0 Table 3.9. Seasonal Drought occurrence in different years % of stations Winter Premonsoon Monsoon Postmonsoon >75 1999, 2006 Nil Nil Nil 50-75 2001 1979 1992, NI 25-50 1985, 1993, 2000 1992, 1994, 1995, 1996, 2005 1977, 1979, 2006 1981, 1984, 1988, 1991, 1993, 2000 10-25 1982, 1988, 1997 1982, 1984, 1985, 1986,1989, 1980, 1982, 1983, 1985, 1989, 1980, 1997, 2003, 1999, 2003 1991, 1994, 1997, 2002, 2005 2006, 2007 1977 1978 1979 1980 1981 1982 1983 1984 1985 1986 1987 1988 1989 1990 1991 1992 1993 1994 1995 1996 1997 1998 1999 2000 2001 2002 2003 2004 2005 2006 2007 Year Figure 3.39. Drought occurrence in winter 73