

Nepal Hazard Risk Assessment - Asia-Pacific Gateway for Disaster ...
Nepal Hazard Risk Assessment - Asia-Pacific Gateway for Disaster ...
Nepal Hazard Risk Assessment - Asia-Pacific Gateway for Disaster ...

Create successful ePaper yourself
Turn your PDF publications into a flip-book with our unique Google optimized e-Paper software.
<strong>Nepal</strong> <strong>Hazard</strong> <strong>Risk</strong> <strong>Assessment</strong><br />
3.5 DROUGHT HAZARD ASSESSMENT<br />
3.5.1 MAP CONTENT<br />
The map shows set of drought susceptibility maps developed based on Standard Precipitation Index<br />
(SPI). The SPI has been developed on the data collected from uni<strong>for</strong>mly distributed 40 meteorological<br />
stations across the country <strong>for</strong> the time span of more than three decades. The susceptibility maps have<br />
been developed based on the probability of occurrence of droughts with class of severity such as<br />
moderate, severe, extreme and moderate to extreme. The map shows the variation of drought in various<br />
seasons i.e. winter, Pre monsoon, Monsoon and Post Monsoon.<br />
3.5.2 APPLICATION OF MAPS WITH RESPECT TO DISASTER RISK MANAGEMENT<br />
The maps will <strong>for</strong>m the basis <strong>for</strong> understanding the drought prone areas and temporal variation of<br />
drought in various regions. Various focal sectors like agriculture, water resources, disaster management<br />
and Irrigation may use the maps <strong>for</strong> water and food security in the region, development of national and<br />
regional plan <strong>for</strong> sustained agricultural development, Assess the climate change impact and develop the<br />
strategy <strong>for</strong> redefining the cropping pattern and water conservation. The maps will help central and local<br />
government to take proactive measures <strong>for</strong> allocation of resources and relief management.<br />
3.5.3 DATA AVAILABILITY FROM SOURCES<br />
Reliable supporting documents, maps, appropriate models and methods <strong>for</strong> drought assessment were<br />
collected from different sources. Based on data quality, quantity and their spatial distribution overall 40<br />
stations were selected as representative stations covering the entire country. The necessary climatic data<br />
required <strong>for</strong> computing the indices, i.e., monthly total rainfall and monthly mean temperature were<br />
collected from Department of Hydrology and Meteorology <strong>for</strong> the period of 1977-2007. Some of the<br />
sources <strong>for</strong> data is as below:<br />
• Central Bureau Statistics (CBS), 2005. Statistical Year book, <strong>Nepal</strong>.<br />
• DHM, 2001. Weekly Dry Spell Atlas of <strong>Nepal</strong>: Final Report.<br />
• DHM, 2001-2009. Preliminary monthly weather summary of <strong>Nepal</strong> from 2001 to 2008, Department<br />
of Hydrology and Meteorology.<br />
• DHM, 2009. Dry and Warm Winter 2009, Climate Section, Internal report of Department of<br />
Hydrology and Meteorology.<br />
• Gibbs, W. J. and Maher, J. V., 1967. Rainfall deciles as drought indicators. Bureau of Meteorology<br />
Bulletin, No. 48, Commonwealth of Australia, Melbourne.<br />
• National Climatic Data Center, 2006. Climate of 2006, U.S. Standardized Precipitation Index.<br />
• NDMC, 2009. Monitoring Drought. National Drought Mitigation Centre, University of Nebraska–Lincoln<br />
• Thornthwaite, C. W., 1948: An approach toward a rational classification of climate. Geographical<br />
Review, 38, 55–94.<br />
• World Meteorological Organization, 2005. Meteoworld (weather. Climate. Water), WMO , August<br />
2005.<br />
• World Meteorological Organization, 1992. International Meteorological Vocabulary, WMO Report<br />
NO. 182, 2nd and. WMO: Geneva; 784.<br />
3.5.4 SPECIAL REMARK<br />
• The drought assessment has been carried out using two most practiced Indices namely Standard<br />
Precipitation Index (SPI) and Soil Moisture Index (SMI). The indices have been developed based on<br />
rainfall collected from uni<strong>for</strong>mly distributed meteorological stations and temperature data.<br />
• The drought assessment results from both indices are having similar outcomes. It is observed that<br />
most of the severe to extreme droughts are occurring in winters.<br />
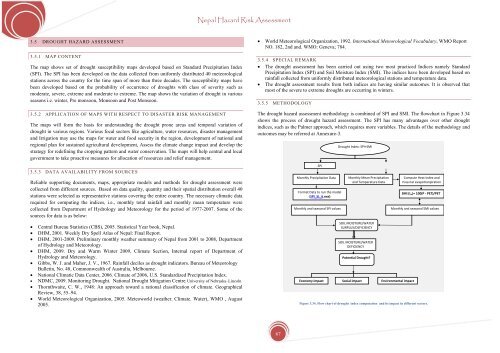
3.5.5 METHODOLOGY<br />
The drought hazard assessment methodology is combined of SPI and SMI. The flowchart in Figure 3.34<br />
shows the process of drought hazard assessment. The SPI has many advantages over other drought<br />
indices, such as the Palmer approach, which requires more variables. The details of the methodology and<br />
outcomes may be referred at Annexure-3.<br />
SPI<br />
Monthly Precipitation Data<br />
Format Data to run the model<br />
(SPI_SL_6.exe)<br />
Monthly and seasonal SPI values<br />
Economy impact<br />
Drought Index: SPI+SMI<br />
Monthly Mean Precipitation<br />
and Temperature Data<br />
SOIL MOISTURE/WATER<br />
SURPLUS/DEFICIENCY<br />
SOIL MOISTURE/WATER<br />
DEFICIENCY<br />
Potential Drought?<br />
Social impact<br />
Compute Heat Index and<br />
Potential evapotranpiration<br />
SMI (I m )= 100(P ‐ PET)/PET<br />
Monthly and seasonal SMI values<br />
Environmental impact<br />
Figure 3.34. Flow chart of drought index computation and its impact in different sectors.<br />
67


