

Nepal Hazard Risk Assessment - Asia-Pacific Gateway for Disaster ...
Nepal Hazard Risk Assessment - Asia-Pacific Gateway for Disaster ...
Nepal Hazard Risk Assessment - Asia-Pacific Gateway for Disaster ...

Create successful ePaper yourself
Turn your PDF publications into a flip-book with our unique Google optimized e-Paper software.
<strong>Nepal</strong> <strong>Hazard</strong> <strong>Risk</strong> <strong>Assessment</strong><br />
1977‐<br />
2007<br />
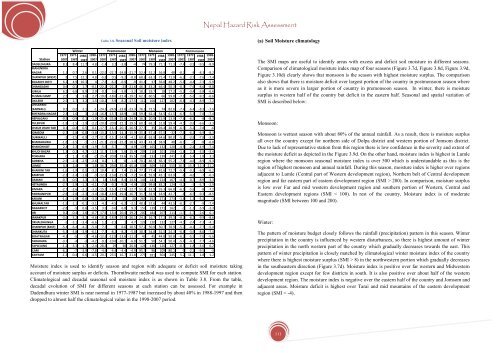
Table 3.8. Seasonal Soil moisture index<br />
Winter Premonsoon Monsoon<br />
1977‐<br />
1987<br />
1988‐<br />
1997<br />
1998‐<br />
2007<br />
1977‐<br />
2007<br />
1977‐<br />
1987<br />
1988‐<br />
1997<br />
1998‐<br />
2007<br />
1977‐<br />
2007<br />
1977‐<br />
1987<br />
1988‐<br />
1997<br />
Moisture index is used to identify season and region with adequate or deficit soil moisture taking<br />
account of moisture surplus or deficits. Thornthwaite method was used to compute SMI <strong>for</strong> each station.<br />
Climatological and decadal seasonal soil moisture index is as shown in Table 3.8. From the table,<br />
decadal evolution of SMI <strong>for</strong> different seasons at each station can be assessed. For example in<br />
Dadendhura winter SMI is near normal in 1977-1987 but increased by about 40% in 1988-1997 and then<br />
dropped to almost half the climatological value in the 1998-2007 period.<br />
1998‐<br />
2007<br />
1977‐<br />
2007<br />
Postmonsoon<br />
1977‐ 1988‐<br />
1987 1997<br />
Station<br />
DADELDHURA 8.3 8.4 11.7 4.8 ‐1.4 3.2 ‐3.8 ‐4 74 79.3 71.1 71.3 ‐7.4 ‐3.9 ‐9.5 ‐8.9<br />
MAHENDRA<br />
NAGAR 1.1 0.7 2.6 0.1 ‐22.9 ‐22.7 ‐24.8 ‐21.7 52.4 52.2 56.8 48 ‐8.2 ‐8 ‐8.3 ‐8.2<br />
CHAINPUR (WEST) 8 7.5 12.1 4.8 ‐5.8 0.5 ‐9.2 ‐8.8 68.6 63.3 71.4 71.9 ‐6.2 ‐3.7 ‐7.6 ‐7.4<br />
SILGADHI DOTI 6.2 4.9 10.3 4 ‐7.3 ‐6.2 ‐6.9 ‐9 41.4 37 36.8 48.2 ‐5.8 ‐4.4 ‐7.3 ‐5.9<br />
DHANGADHI 0.6 0.1 1.7 ‐0.1 ‐22.2 ‐22.2 ‐23 ‐21.6 46.7 43.2 46.4 50.3 ‐8.3 ‐7.6 ‐8.6 ‐8.8<br />
JUMLA 6.2 6.8 8.9 2.9 ‐0.3 5.6 ‐3.8 ‐3.2 18.3 19.7 18 17.2 ‐5.2 ‐3.4 ‐5.8 ‐6.6<br />
PUSMA CAMP 2.5 1 3.6 2.7 ‐19.6 ‐18.6 ‐21.4 ‐19.1 62.1 60.5 66 59.8 ‐7.1 ‐5.6 ‐9.2 ‐6.6<br />
DAILEKH 2.5 2.7 3.2 1.5 ‐10.2 ‐5.9 ‐8.2 ‐17.5 112 108 127 102 ‐6.8 ‐4.3 ‐8.9 ‐7.2<br />
CHISAPANI<br />
(KARNALI) 0.5 0.2 2.1 ‐1 ‐24.1 ‐24.9 ‐23.8 ‐23.3 76.1 72.5 74 82.6 ‐7.4 ‐6.4 ‐8.3 ‐7.6<br />
BIRENDRA NAGAR 2.3 1.6 3 2.4 ‐16.8 ‐15.7 ‐18.9 ‐16 59.6 62.4 54.5 61.5 ‐6.9 ‐5.5 ‐7.8 ‐7.4<br />
NEPALGANJ ‐0.9 ‐0.9 0.1 ‐1.9 ‐25.4 ‐25.8 ‐25.6 ‐24.9 16.9 20.9 15.9 13.9 ‐7.6 ‐6.5 ‐8 ‐8.3<br />
TULSIPUR ‐1.8 ‐1.5 ‐1.9 ‐2.2 ‐20.8 ‐20.8 ‐22.1 ‐19.5 60.5 69.2 51.8 59.4 ‐4.5 ‐3.6 ‐6.6 ‐3.3<br />
CHAUR JHARI TAR 0.1 ‐0.4 0.5 0.1 ‐17.5 ‐16.1 ‐20.1 ‐16.5 27.3 35 26.4 20.9 ‐6.3 ‐5.2 ‐7.8 ‐6<br />
JOMSOM ‐2.7 ‐2.8 ‐0.8 ‐3.8 ‐15.2 ‐15.5 ‐14.1 ‐15.9 ‐35.6 ‐37.4 ‐37.5 ‐32 ‐7.1 ‐6.2 ‐6.9 ‐8.3<br />
DUMKAULI ‐2 ‐2.5 ‐0.9 ‐2.7 ‐11.5 ‐15.1 ‐14.9 ‐4.1 69.6 63.9 64.6 80.8 ‐5.2 ‐3.8 ‐7.8 ‐3.9<br />
BHAIRAHAWA ‐1.8 ‐2.5 ‐1 ‐2.1 ‐21.1 ‐22.6 ‐22.2 ‐18.6 43.7 43.3 38.9 48 ‐6.9 ‐6 ‐8 ‐6.8<br />
KHANCHIKOT 2.4 2.3 6.9 ‐1.9 ‐5.9 ‐5.7 ‐7 ‐4.9 139 165 132 120 ‐4.9 ‐2.4 ‐4.9 ‐7.4<br />
KHUDI BAZAR 1.3 0.2 4.7 ‐1.1 11.7 13.9 5.6 15.4 204 216 201 196 ‐1.6 2.1 ‐3.5 ‐3.4<br />
POKHARA 0 1.1 0.8 ‐2 25.4 20.8 19.6 35.5 238 233 239 241 3.6 5.4 1.8 3.3<br />
GORKHA ‐2.5 ‐2.3 ‐2.5 ‐2.6 0.2 1.2 0 ‐1.4 70.2 86.5 66.1 55.2 ‐7.6 ‐4.6 ‐8.9 ‐9.3<br />
LUMLE 4.3 2.4 9 1.8 36.7 29.6 35.4 45.4 536 509 545 555 16.3 15.3 12.3 21.2<br />
KHAIRINI TAR ‐1.6 ‐1.9 0.5 ‐3.2 10.4 8.1 7.4 15.6 77.2 77.4 81.6 72.7 ‐5.4 ‐3.2 ‐6.9 ‐6.2<br />
RAMPUR ‐2.3 ‐2.4 ‐1.6 ‐3 ‐12.2 ‐13.6 ‐15.9 ‐7.2 54.6 55.9 43.1 63.9 ‐6 ‐4.6 ‐7 ‐6.3<br />
DAMAN ‐0.7 ‐0.5 1.3 ‐3.3 14 18.8 8.4 14.6 144 141 124 167 ‐4.1 ‐0.7 ‐8.9 ‐3.3<br />
HETAUNDA ‐2.7 ‐2.9 ‐1.1 ‐4.1 ‐7.6 ‐9.1 ‐9.2 ‐4.4 102 99.8 83.2 124 ‐3.2 ‐1 ‐5.7 ‐2.9<br />
SIMARA ‐2.7 ‐2.6 ‐2.1 ‐3.3 ‐15.2 ‐15.3 ‐17.6 ‐12.7 51.8 52.9 35.3 66.8 ‐6.9 ‐5.6 ‐8 ‐7.2<br />
PARWANIPUR ‐2.8 ‐2.8 ‐2.3 ‐3.4 ‐18.4 ‐18.9 ‐19.4 ‐16.7 31.5 32.9 18.9 42.7 ‐8 ‐6.5 ‐9.3 ‐8.5<br />
KAKANI ‐1.6 ‐1.9 0.6 ‐3.3 14.2 7.3 15 20 265 252 271 273 ‐1.6 1.3 ‐5.2 ‐1<br />
KHUMALTAR ‐1.5 ‐1.1 ‐0.1 ‐3.1 ‐4.2 ‐4.5 ‐6.2 ‐2.1 48.6 57.6 44 43.5 ‐6.3 ‐2.7 ‐9 ‐7.4<br />
NAGARKOT ‐2.8 ‐5 0.6 ‐3.5 3.9 ‐3.6 6.8 9.3 157 139 171 162 ‐3 ‐1.1 ‐5.9 ‐2.3<br />
JIRI 0.2 ‐0.4 1.6 ‐0.7 17.6 13.4 20.4 19.2 200 184 207 211 ‐1.3 ‐1.7 ‐2.6 0.1<br />
JANAKPUR ‐3.6 ‐3.2 ‐3.1 ‐4.6 ‐18.2 ‐18.9 ‐19.5 ‐16.1 24.3 16.7 17.2 39.3 ‐8.2 ‐6.2 ‐9.9 ‐8.6<br />
OKHALDHUNGA ‐5 ‐5.1 ‐3.4 ‐6.6 1.1 ‐2.3 1 4.7 126 120 132 127 ‐4.5 ‐2.4 ‐7.3 ‐4.1<br />
CHAINPUR (EAST) ‐5.4 ‐6.4 ‐4.2 ‐5.4 7.3 5 6.6 10.5 57.2 50.9 50.7 70.9 ‐5.7 ‐4.1 ‐7.7 ‐5.4<br />
DHANKUTA ‐5.3 ‐5.8 ‐3.9 ‐6.1 ‐7.3 ‐8.2 ‐8.2 ‐5.8 30.5 34.8 31.5 24.3 ‐6.6 ‐3.9 ‐8.6 ‐7.4<br />
BIRATNAGAR ‐4.3 ‐5 ‐3 ‐4.6 ‐12.6 ‐12.8 ‐13.6 ‐11.3 47 45 44.8 50.8 ‐6.2 ‐5.5 ‐7.6 ‐5.6<br />
TARAHARA ‐3.7 ‐4 ‐3 ‐4.2 ‐9.2 ‐10.8 ‐10.1 ‐6.8 51.5 50 54.1 50.4 ‐5.4 ‐4.1 ‐7.7 ‐4.6<br />
TAPLEJUNG ‐1.2 ‐3.3 1.7 ‐2.4 28.6 29 30 26.8 128 130 126 127 ‐0.5 1.8 ‐3.6 0.2<br />
ILAM ‐6.2 ‐7 ‐3.9 ‐7.8 ‐4.6 ‐4.4 ‐4.4 ‐4.9 95.7 96 109 80.1 ‐5 ‐2.2 ‐9.5 ‐3<br />
KANYAM ‐1.3 ‐0.4 0.6 ‐4.5 20.7 23.5 16.7 21.8 279 281 304 245 5.2 11.7 1.8 1.2<br />
1998‐<br />
2007<br />
(a) Soil Moisture climatology<br />
The SMI maps are useful to identify areas with excess and deficit soil moisture in different seasons.<br />
Comparison of climatological moisture index map of four seasons (Figure 3.7d, Figure 3.8d, Figure 3.9d,<br />
Figure 3.10d) clearly shows that monsoon is the season with highest moisture surplus. The comparison<br />
also shows that there is moisture deficit over largest portion of the country in postmonsoon season where<br />
as it is more severe in larger portion of country in premonsoon season. In winter, there is moisture<br />
surplus in western half of the country but deficit in the eastern half. Seasonal and spatial variation of<br />
SMI is described below:<br />
Monsoon:<br />
Monsoon is wettest season with about 80% of the annual rainfall. As a result, there is moisture surplus<br />
all over the country except <strong>for</strong> northern side of Dolpa district and western portion of Jomsom district.<br />
Due to lack of representative station from this region there is low confidence in the severity and extent of<br />
the moisture deficit as depicted in the Figure 3.9d. On the other hand, moisture index is highest in Lumle<br />
region where the monsoon seasonal moisture index is over 500 which is understandable as this is the<br />
region of highest monsoon and annual rainfall. During this season, moisture index is higher over regions<br />
adjacent to Lumle (Central part of Western development region), Northern belt of Central development<br />
region and far eastern part of eastern development region (SMI > 200). In comparison, moisture surplus<br />
is low over Far and mid western development region and southern portion of Western, Central and<br />
Eastern development regions (SMI < 100). In rest of the country, Moisture index is of moderate<br />
magnitude (SMI between 100 and 200).<br />
Winter:<br />
The pattern of moisture budget closely follows the rainfall (precipitation) pattern in this season. Winter<br />
precipitation in the country is influenced by western disturbances, so there is highest amount of winter<br />
precipitation in the north western part of the country which gradually decreases towards the east. This<br />
pattern of winter precipitation is closely matched by climatological winter moisture index of the country<br />
where there is highest moisture surplus (SMI > 8) in the northwestern portion which gradually decreases<br />
in the southeastern direction (Figure 3.7d). Moisture index is positive over far western and Midwestern<br />
development region except <strong>for</strong> few districts in south. It is also positive over about half of the western<br />
development region. The moisture index is negative over the eastern half of the country and Jomsom and<br />
adjacent areas. Moisture deficit is highest over Tarai and mid mountains of the eastern development<br />
region (SMI < -4).<br />
111


