

Nepal Hazard Risk Assessment - Asia-Pacific Gateway for Disaster ...
Nepal Hazard Risk Assessment - Asia-Pacific Gateway for Disaster ...
Nepal Hazard Risk Assessment - Asia-Pacific Gateway for Disaster ...

Create successful ePaper yourself
Turn your PDF publications into a flip-book with our unique Google optimized e-Paper software.
<strong>Nepal</strong> <strong>Hazard</strong> <strong>Risk</strong> <strong>Assessment</strong><br />
No Station name District Winter Premonsoon Monsoon Postmonsoon<br />
0802 KHUDI BAZAR Lamjung 41 265 2405 29<br />
0804 POKHARA AIRPORT Kaski 39 405 2612 36<br />
0809 GORKHA Gorkha 25 182 914 5<br />
0814 LUMLE Kaski 59 378 3984 126<br />
0815 KHAIRINI TAR Tanahun 28 305 1424 20<br />
0902 RAMPUR Chitawan 9 139 1362 26<br />
0905 DAMAN Makwanpur 12 171 966 9<br />
0906 HETAUNDA N.F.I. Makwanpur 12 170 1625 36<br />
0909 SIMARA AIRPORT Bara 10 101 1172 20<br />
0911 PARWANIPUR Bara 11 88 918 22<br />
1007 KAKANI Nuwakot 25 206 1892 37<br />
1029 Khumal tar Lalitpur 15 118 745 12<br />
1043 NAGARKOT Kathmandu 12 150 1177 20<br />
1103 JIRI Dolkha 18 237 1418 34<br />
1111 JANAKPUR AIRPORT Dhanusa 9 60 837 3<br />
1206 OKHALDHUNGA Okhaldhunga 20 147 1184 21<br />
1303 CHAINPUR (EAST) Sankhuwasabh 16 240 815 23<br />
a<br />
1307 DHANKUTA Dhankuta 13 131 580 9<br />
1319 BIRATNAGAR AIRPOART Morang 7 151 1090 13<br />
1320 TARAHARA Sunsari 9 190 1157 28<br />
1405 TAPLEJUNG Taplejung 36 471 1367 38<br />
1407 ILAM TEA ESTATE Ilam 10 142 801 15<br />
1416 KANYAM TEA ESTATE Ilam 22 285 1620 33<br />
(d) Monitoring Drought<br />
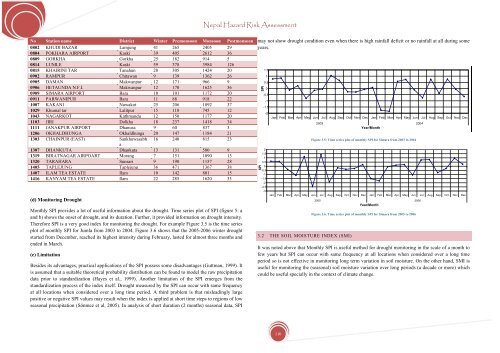
Monthly SPI provides a lot of useful in<strong>for</strong>mation about the drought. Time series plot of SPI (figure 5: a<br />
and b) shows the onset of drought, and its duration. Further, it provided in<strong>for</strong>mation on drought intensity.<br />
There<strong>for</strong>e SPI is a very good index <strong>for</strong> monitoring the drought. For example Figure 3.5 is the time series<br />
plot of monthly SPI <strong>for</strong> Jumla from 2003 to 2004. Figure 3.6 shows that the 2005-2006 winter drought<br />
started from December, reached its highest intensity during February, lasted <strong>for</strong> almost three months and<br />
ended in March.<br />
(e) Limitation<br />
Besides its advantages, practical applications of the SPI possess some disadvantages (Guttman, 1999). It<br />
is assumed that a suitable theoretical probability distribution can be found to model the raw precipitation<br />
data prior to standardization (Hayes et al., 1999). Another limitation of the SPI emerges from the<br />
standardization process of the index itself. Drought measured by the SPI can occur with same frequency<br />
at all locations when considered over a long time period. A third problem is that misleadingly large<br />
positive or negative SPI values may result when the index is applied at short time steps to regions of low<br />
seasonal precipitation (Sönmez et al, 2005). In analysis of short duration (2 months) seasonal data, SPI<br />
may not show drought condition even when there is high rainfall deficit or no rainfall at all during some<br />
years.<br />
SPI<br />
1.5<br />
1<br />
0.5<br />
0<br />
-0.5<br />
-1<br />
-1.5<br />
-2<br />
Jan Feb Mar Apr May Jun Jul Aug Sep Oct Nov Dec Jan Feb Mar Apr May Jun Jul Aug Sep Oct Nov Dec<br />
2003 2004<br />
Year/Month<br />
SPI<br />
2<br />
1.5<br />
1<br />
0.5<br />
0<br />
-0.5<br />
-1<br />
-1.5<br />
-2<br />
-2.5<br />
-3<br />
3.2 THE SOIL MOISTURE INDEX (SMI)<br />
Figure 3.5: Time series plot of monthly SPI <strong>for</strong> Simara from 2003 to 2004<br />
Jan Feb Mar Apr May Jun Jul Aug Sep Oct Nov Dec Jan Feb Mar Apr May Jun Jul Aug Sep Oct Nov Dec<br />
2005 2006<br />
Year/Month<br />
Figure 3.6. Time series plot of monthly SPI <strong>for</strong> Simara from 2005 to 2006<br />
It was noted above that Monthly SPI is useful method <strong>for</strong> drought monitoring in the scale of a month to<br />
few years but SPI can occur with same frequency at all locations when considered over a long time<br />
period so is not effective in monitoring long term variation in soil moisture. On the other hand, SMI is<br />
useful <strong>for</strong> monitoring the (seasonal) soil moisture variation over long periods (a decade or more) which<br />
could be useful specially in the context of climate change.<br />
110


