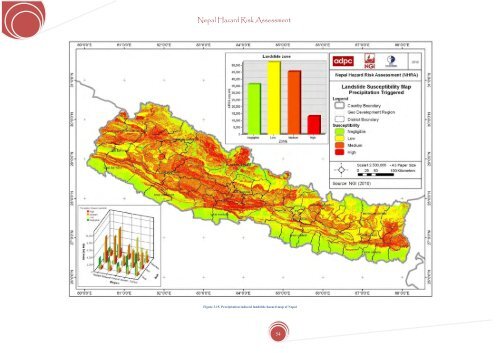
<strong>Nepal</strong> <strong>Hazard</strong> <strong>Risk</strong> <strong>Assessment</strong> Figure 3.15. Precipitation induced landslide hazard map of <strong>Nepal</strong> 54
<strong>Nepal</strong> <strong>Hazard</strong> <strong>Risk</strong> <strong>Assessment</strong> 3.4 FLOOD HAZARD ASSESSMENT 3.4.1 MAP CONTENT Flood hazard maps have been developed <strong>for</strong> most frequent flood prone river basins. In close consultation with the national focal departments <strong>for</strong> flood mitigation i.e., Department of Meteorology and Hydrology (DMH) and Department of Water Induced <strong>Disaster</strong> Prevention (DWIDP), seven rivers have been identified <strong>for</strong> flood hazard and risk assessment. These Rivers are Rapti, Babai, Bagmati, Narayani, Tinau, Kankai and Kamala. The flood hazard maps show the flood inundation and flood water depth wrt various return period scenarios. These return periods are 10 years, 25 years, 50 years, 100 years and 500 years. In common terms, bigger the return period, worst is the flood scenario. The flood inundation area <strong>for</strong> particular scenario has been indicated in square kilometers. The results of the flood hazard maps are shown in Figure 3.27 to Figure 3.33. 3.4.2 APPLICATION OF HAZARD MAPS IN DISASTER RISK MANAGEMENT The flood hazard maps have been developed <strong>for</strong> most flood prone rivers as state above. The purposes of developing these hazard maps are: • The maps will help and support policymakers, decision makers and planners <strong>for</strong> future developing master plans and safe development. The authority can take necessary actions to reduce the impacts on various economic sectors like agriculture, housing, tourism, industry, production etc. • The maps will help district administration and local authority to understand the severity of flood hazards in the area and develop necessary mitigation and preparedness plans. • The maps will help international and national relief agencies and humanitarian organizations to prioritize hazard disaster preparedness and mitigation interventions. • The maps will be referred by Department of Irrigation(DoI) and Department of Water Induced <strong>Disaster</strong> Preparedness (DWIDP) <strong>for</strong> prioritizing the actions <strong>for</strong> DRM. • The Department of Agriculture may use these maps to change the crop pattern and other non structural measures <strong>for</strong> reducing negative impacts on agriculture. 3.4.3 DATA AVAILABILITY FROM SOURCES For extensive flood hazard mapping, detailed hydrological, meteorological, demographic and geomorphological data are required. It is also imperative to understand the scale of the flood hazard assessment. More precise and detailed data are required <strong>for</strong> site specific flood studies. The objective of the current project is to develop flood hazard maps at national level scale. The current hazard maps have been developed based on data available with focal departments and established authentic sources. The parameters are classified into following categories with their sources. a. Hydrological data (Source: Streamflow Summary (1962-2006) compiled by Hydrology Division, Department of Hydrology and Meteorology, Ministry of Environment, Science & Technology, Published in 2008) • Average monthly and yearly discharge <strong>for</strong> meteorology stations <strong>for</strong> identified rivers • Maximum monthly and yearly discharge <strong>for</strong> meteorology stations <strong>for</strong> identified rivers • Minimum monthly and yearly discharge <strong>for</strong> meteorology stations <strong>for</strong> identified rivers • Extreme discharge b. Geographical data (Elevation, Landuse, land cover) (Source : Department of Survey, <strong>Nepal</strong>) c. Elevation (source: SRTM, resolution 90Meters)(Source http://srtm.csi.cgiar.org/ ) d. Elevation (Source : Aster resolution 30 Meters)(source http://asterweb.jpl.nasa.gov/gdem.asp) e. River network and catchments (Google Map and Department of Survey) Software required <strong>for</strong> Flood <strong>Hazard</strong> <strong>Assessment</strong> The flood hazard assessment has been developed using several software like ArcGIS 9.3, HEC-GeoHMS (USACE, 2009a), HEC-GeoRAS (USACE, 2009b) and HEC-RAS (USACE, 2009c). The Geospatial Hydrologic Modeling Extension (HEC-GeoHMS) has been developed as a geospatial hydrology toolkit which uses ArcView and the Spatial Analyst extension to develop a number of hydrologic modeling inputs <strong>for</strong> the Hydrologic Engineering Center's Hydrologic Modeling System, HEC-HMS. ArcView GIS and its Spatial Analyst extension are available from the Environmental Systems Research Institute, Inc. (ESRI). Analyzing digital terrain data, HEC-GeoHMS trans<strong>for</strong>ms the drainage paths and watershed boundaries into a hydrologic data structure that represents the drainage network. The program allows users to visualize spatial in<strong>for</strong>mation, document watershed characteristics, per<strong>for</strong>m spatial analysis, and delineate subbasins and streams. HEC-GeoRAS is a set of procedures, tools, and utilities <strong>for</strong> processing geospatial data in ArcGIS using a graphical user interface (GUI). The interface allows the preparation of geometric data <strong>for</strong> import into HEC-RAS and processes simulation results exported from HEC-RAS. To create the import file, the user must have an existing digital terrain model (DTM) of the river system in the ArcInfo TIN <strong>for</strong>mat. The user creates a series of line themes pertinent to developing geometric data <strong>for</strong> HEC-RAS. The themes created are the Stream Centerline, Flow Path Centerlines (optional), Main Channel Banks (optional), and Cross Section Cut Lines referred to as the RAS Themes. HEC-RAS is designed to per<strong>for</strong>m one-dimensional hydraulic calculations <strong>for</strong> a full network of natural and constructed channels. The HEC-RAS system contains four one-dimensional river analysis components <strong>for</strong>: (1) steady flow water surface profile computations; (2) unsteady flow simulation; (3) movable boundary sediment transport computations; and (4) water quality analysis. A key element is that all four components use a common geometric data representation and common geometric and hydraulic computation routines. 3.4.4 METHODOLOGY FOR FLOOD HAZARD MAPPING Figure 3.1 shows the methodology <strong>for</strong> mapping the flood inundation area and depth <strong>for</strong> various return periods. The methodology <strong>for</strong> flood hazard mapping has been developed based on secondary available data from various authentic sources like DOS, DWIDP, DMH and ICIMOD. The methodology largely used software Hec-GeoRAS, Hec-GoHMS, Hec-RAS and ArcGIS 9.3 as stated above. The creation of river basin and river profile has been validated using Google-map images of the river basin. The following are the steps used in the development of flood inundation maps. 55