

Nepal Hazard Risk Assessment - Asia-Pacific Gateway for Disaster ...
Nepal Hazard Risk Assessment - Asia-Pacific Gateway for Disaster ...
Nepal Hazard Risk Assessment - Asia-Pacific Gateway for Disaster ...

Create successful ePaper yourself
Turn your PDF publications into a flip-book with our unique Google optimized e-Paper software.
<strong>Nepal</strong> <strong>Hazard</strong> <strong>Risk</strong> <strong>Assessment</strong><br />
2.8 EDUCATION SECTOR<br />
2.8.1 TYPE OF EDUCATION INSTITUTIONS<br />
The educational sector (ICIMOD and CBS, 2003b) in <strong>Nepal</strong> consists broadly of primary, lower<br />
secondary, secondary, and higher education school system (beyond School Leaving Certificate or SLC).<br />
The total literate population is classified into five categories of successfully completed level of<br />
education: primary (grades 1 to 5); lower secondary and secondary (grades 6 to 10); SLC and equivalent;<br />
certificate and above; ‘no schooling’ (includes literate persons with non-<strong>for</strong>mal education) and ‘other’<br />
level includes literate persons completing an education level other than mentioned above, but not<br />
including those who did not state their level attainment.<br />
Table 2.4. Number of School per thousand people of <strong>Nepal</strong> (source: (ICIMOD and CBS, 2003b))<br />
The Department of Education (reference) is the main source of in<strong>for</strong>mation on the school system and the<br />
development of education. The Department has compiled lists the schools in year 2000 (primary, lower<br />
secondary, and secondary, both government and private) which amount to 37,566. District-wise the total<br />
number of schools varied from 45 in Manang (0.12% of all schools) to 2014 in Kathmandu (5.36%).<br />
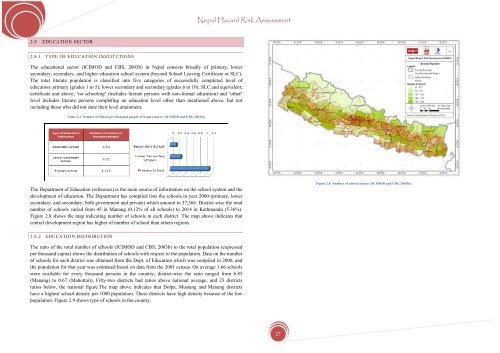
Figure 2.8 shows the map indicating number of schools in each district The map above indicates that<br />
central development region has higher of number of school than others regions.<br />
Figure 2.8. Number of school (source: (ICIMOD and CBS, 2003b))<br />
2.8.2 EDUCATION DISTRIBUTION<br />
The ratio of the total number of schools (ICIMOD and CBS, 2003b) to the total population (expressed<br />
per thousand capita) shows the distribution of schools with respect to the population. Data on the number<br />
of schools <strong>for</strong> each district was obtained from the Dept. of Education which was compiled in 2000, and<br />
the population <strong>for</strong> that year was estimated based on data from the 2001 census. On average 1.66 schools<br />
were available <strong>for</strong> every thousand persons in the country; district-wise the ratio ranged from 6.85<br />
(Manang) to 0.67 (Mahottari). Fifty-two districts had ratios above national average, and 23 districts<br />
ratios below, the national figure.The map above indicates that Dolpa, Mustang and Manang districts<br />
have a highest school density per 1000 population. These districts have high density because of the low<br />
population. Figure 2.9 shows type of schools in the country.<br />
27


