

Nepal Hazard Risk Assessment - Asia-Pacific Gateway for Disaster ...
Nepal Hazard Risk Assessment - Asia-Pacific Gateway for Disaster ...
Nepal Hazard Risk Assessment - Asia-Pacific Gateway for Disaster ...

Create successful ePaper yourself
Turn your PDF publications into a flip-book with our unique Google optimized e-Paper software.
<strong>Nepal</strong> <strong>Hazard</strong> <strong>Risk</strong> <strong>Assessment</strong><br />
2.3 RETURN PERIOD CALCULATION<br />
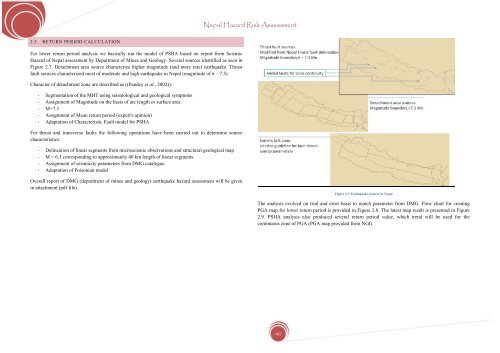
For lower return period analysis we basically run the model of PSHA based on report from Seismic<br />
<strong>Hazard</strong> of <strong>Nepal</strong> assessment by Department of Mines and Geology. Several sources identified as seen in<br />
Figure 2.7. Detachment area source characterize higher magnitude (and more rare) earthquake. Thrust<br />
fault sources characterized most of moderate and high earthquake in <strong>Nepal</strong> (magnitude of 6 – 7.3).<br />
Character of detachment zone are described as ((Pandey et al., 2002)):<br />
- Segmentation of the MHT using seismological and geological symptoms<br />
- Assignment of Magnitude on the basis of arc length or surface area<br />
- M>7.3<br />
- Assignment of Mean return period (expert's opinion)<br />
- Adaptation of Characteristic Fault model <strong>for</strong> PSHA<br />
For thrust and transverse faults the following operations have been carried out to determine source<br />
characteristics:<br />
- Delineation of linear segments from microseismic observations and structural geological map<br />
- M < 6.3 corresponding to approximately 40 km length of linear segments<br />
- Assignment of seismicity parameters from DMG catalogue<br />
- Adaptation of Poisonian model<br />
Overall report of DMG (department of mines and geology) earthquake hazard assessment will be given<br />
in attachment (pdf file).<br />
Figure 2.7. Earthquake sources in <strong>Nepal</strong><br />
The analysis evolved on trial and error basis to match parameter from DMG. Flow chart <strong>for</strong> creating<br />
PGA map <strong>for</strong> lower return period is provided in Figure 2.8. The latest map result is presented in Figure<br />
2.9. PSHA analysis also produced several return period value, which trend will be used <strong>for</strong> the<br />
continuous zone of PGA (PGA map provided from NGI).<br />
102


