

Nepal Hazard Risk Assessment - Asia-Pacific Gateway for Disaster ...
Nepal Hazard Risk Assessment - Asia-Pacific Gateway for Disaster ...
Nepal Hazard Risk Assessment - Asia-Pacific Gateway for Disaster ...

Create successful ePaper yourself
Turn your PDF publications into a flip-book with our unique Google optimized e-Paper software.
<strong>Nepal</strong> <strong>Hazard</strong> <strong>Risk</strong> <strong>Assessment</strong><br />
3.2.5 HOW TO READ THE MAPS<br />
If the return period is higher, the scenario will be more critical. Based on MMI distribution, the hazard<br />
zones are calibrated. Table 3.1 shows the relationship between intensity and severity zones. Very high<br />
seismic risk has been demarcated by red colour, followed by orange, light brown-yellow and yellow<br />
colour representing high, medium and low seismic zone respectively. The map further shows<br />
geographical coverage of low, medium and high seismic zones.<br />
Table 3.1. Earthquake hazard zone scale<br />
Zone MMI range Color<br />
Low < VI Yellow<br />
Medium VI Light brown‐yellow<br />
High VII Orange<br />
Very<br />
high > VII Red<br />
3.2.6 ANALYSIS OF HAZARD ASSESSMENT<br />
Figure 3.7 - Figure 3.10 show seismic hazard zoning maps <strong>for</strong> various return periods of 500 years, 250<br />
Years, 100 years and 50 years respectively. Table 3.2 - Table 3.5 shows corresponding districts coverage<br />
of various zones <strong>for</strong> stated return periods. As the return period increases, the risk zone increases<br />
accordingly. Following paragraph explains the earthquake hazard assessment outcomes.<br />
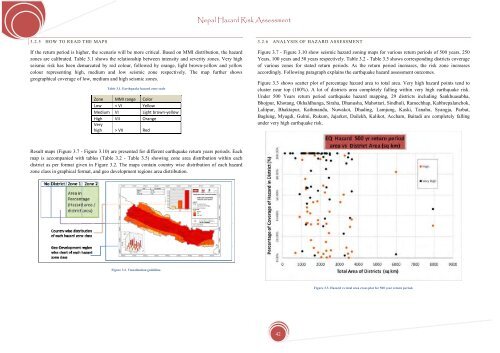
Figure 3.3 shows scatter plot of percentage hazard area to total area. Very high hazard points tend to<br />
cluster near top (100%). A lot of districts area completely falling within very high earthquake risk.<br />
Under 500 Years return period earthquake hazard mapping, 29 districts including Sankhuasabha,<br />
Bhojpur, Khotang, Okhaldhunga, Siraha, Dhanusha, Mahottari, Sindhuli, Ramechhap, Kabhrepalanchok,<br />
Lalitpur, Bhaktapur, Kathmandu, Nuwakot, Dhading, Lamjung, Kaski, Tanahu, Syangja, Parbat,<br />
Baglung, Myagdi, Gulmi, Rukum, Jajarkot, Dailekh, Kalikot, Accham, Baitadi are completely falling<br />
under very high earthquake risk.<br />
Result maps (Figure 3.7 - Figure 3.10) are presented <strong>for</strong> different earthquake return years periods. Each<br />
map is accompanied with tables (Table 3.2 - Table 3.5) showing zone area distribution within each<br />
district as per <strong>for</strong>mat given in Figure 3.2. The maps contain country wise distribution of each hazard<br />
zone class in graphical <strong>for</strong>mat, and geo development regions area distribution.<br />
Figure 3.2. Visualization guideline.<br />
Figure 3.3. <strong>Hazard</strong> vs total area cross plot <strong>for</strong> 500 year return period.<br />
42


