

Nepal Hazard Risk Assessment - Asia-Pacific Gateway for Disaster ...
Nepal Hazard Risk Assessment - Asia-Pacific Gateway for Disaster ...
Nepal Hazard Risk Assessment - Asia-Pacific Gateway for Disaster ...

You also want an ePaper? Increase the reach of your titles
YUMPU automatically turns print PDFs into web optimized ePapers that Google loves.
<strong>Nepal</strong> <strong>Hazard</strong> <strong>Risk</strong> <strong>Assessment</strong><br />
1 ANNEXURE 1<br />
GIS METHODOLOGY FOR ASSESSMENT OF LANDSLIDE HAZARD<br />
1.1 INTRODUCTION<br />
The major triggering factors <strong>for</strong> landslides are extreme precipitation events, strong earthquakes, and<br />
human activity. The strong correlation between landslides and other natural hazard triggers like<br />
hurricanes or earthquakes has resulted in an underestimation of their socio-economic impact. This<br />
underestimation contributes to reduced awareness and concern of both authorities and general public<br />
about landslide risk.<br />
1.2 MODEL FOR LANDSLIDE HAZARD EVALUATION<br />
The term "landslide" in this study refers to events involving gravity-driven rapid mass movement downslope,<br />
like rockslides, debris flows, and rainfall- and earthquake-induced slides; which pose a threat to<br />
human life. Slow moving slides have significant economic consequences <strong>for</strong> constructions and<br />
infrastructure, but rarely cause any fatalities.<br />
to the in<strong>for</strong>mation available in landslide inventories and physical processes. The general approach used<br />
in the present study is a modified and improved version of the approach used by Nadim et al. (2006).<br />
One of the key improvements in the present model is the increased resolution on the DEM and<br />
consequently the slope data. In previous studies a 30 arc second resolution was used, whereas the present<br />
study uses the 3 arc seconds SRTM dataset.<br />
The hazard maps are divided in precipitation induced landslide hazard and earthquake induced landslide<br />
hazard. The landslide hazard indices were estimated using the following equations:<br />
H r = (S r x Six S h x S v )xT p (1)<br />
He = (Sr X Si X Sh X Sv) x T s (2)<br />
where Hr and He are landslide hazard indices <strong>for</strong> rainfall and earthquake induced landslides respectively,<br />
Sr is the slope factor within a selected grid, Sl is lithological (or geological) conditions factor, S h<br />
describes the soil moisture condition, T p is the precipitation factor and T s describes the seismic<br />
conditions. The index Sv described the vegetation cover.<br />
1.2.1 SLOPE FACTOR SR<br />
The slope factor represents the natural landscape ruggedness within a grid unit. In February 2000, NASA<br />
collected elevation data <strong>for</strong> much of the world using a radar instrument aboard the Space Shuttle. The<br />
raw data collected on the mission were processed over three years. NASA has now released a global<br />
elevation dataset called SRTM3, referring to the name of the mission and the resolution of the data,<br />
which is 3 arc-seconds, or approximately 90 by 90 m per data sample near the equator. The SRTM3 data<br />
set covers the globe from 60 degrees south latitude to 60 degrees north latitude. The vertical accuracy is<br />
estimated such that 90% of posts are within 16m tolerance of the actual position.<br />
Table 1.1. Slope angle classification.<br />
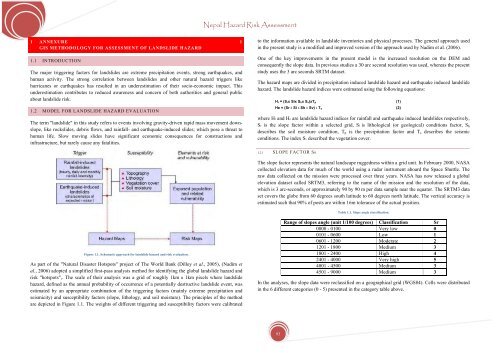
Figure 1.1. Schematic approach <strong>for</strong> landslide hazard and risk evaluation.<br />
As part of the "Natural <strong>Disaster</strong> Hotspots" project of The World Bank (Dilley et al., 2005), (Nadim et<br />
al., 2006) adopted a simplified first-pass analysis method <strong>for</strong> identifying the global landslide hazard and<br />
risk "hotspots",. The scale of their analysis was a grid of roughly 1km x 1km pixels where landslide<br />
hazard, defined as the annual probability of occurrence of a potentially destructive landslide event, was<br />
estimated by an appropriate combination of the triggering factors (mainly extreme precipitation and<br />
seismicity) and susceptibility factors (slope, lithology, and soil moisture). The principles of the method<br />
are depicted in Figure 1.1. The weights of different triggering and susceptibility factors were calibrated<br />
Range of slopes angle (unit 1/100 degrees) Classification Sr<br />
0000 - 0100 Very low 0<br />
0101 - 0600 Low 1<br />
0601 - 1200 Moderate 2<br />
1201 - 1800 Medium 3<br />
1801 - 2400 High 4<br />
2401 - 4000 Very high 5<br />
4001 - 4500 Medium 3<br />
4501 - 9000 Medium 3<br />
In the analyses, the slope data were reclassified on a geographical grid (WGS84). Cells were distributed<br />
in the 6 different categories (0 - 5) presented in the category table above.<br />
93


