

Nepal Hazard Risk Assessment - Asia-Pacific Gateway for Disaster ...
Nepal Hazard Risk Assessment - Asia-Pacific Gateway for Disaster ...
Nepal Hazard Risk Assessment - Asia-Pacific Gateway for Disaster ...

Create successful ePaper yourself
Turn your PDF publications into a flip-book with our unique Google optimized e-Paper software.
<strong>Nepal</strong> <strong>Hazard</strong> <strong>Risk</strong> <strong>Assessment</strong><br />
2.7 HEALTH INFRASTRUCTURE<br />
2.7.1 CLASSES OF HEALTH INFRASTRUCTURE<br />
The Ministry of Health is the nodal agency <strong>for</strong> maintaining health infrastructure in the country. The<br />
analysis of health infrastructure in this report is exclusive health institutions which are managed and<br />
maintained by Ministry of Health. This covers large spectrum of health services including hospitals,<br />
primary health centres (PHC)/ health centres (HC), health posts (HP), and sub-health posts (SHP).<br />
2.7.2 NUMBER OF HEALTH INFRASTRUCTURE<br />
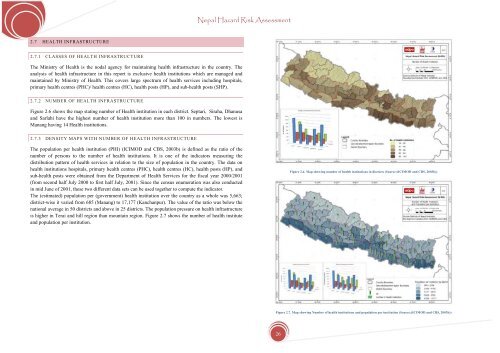
Figure 2.6 shows the map stating number of Health institution in each district. Septari, Siraha, Dhanusa<br />
and Sarlahi have the highest number of health institution more than 100 in numbers. The lowest is<br />
Manang having 14 Health institutions.<br />
2.7.3 DENSITY MAPS WITH NUMBER OF HEALTH INFRASTRUCTURE<br />
The population per health institution (PHI) (ICIMOD and CBS, 2003b) is defined as the ratio of the<br />
number of persons to the number of health institutions. It is one of the indicators measuring the<br />
distribution pattern of health services in relation to the size of population in the country. The data on<br />
health institutions hospitals, primary health centres (PHC), health centres (HC), health posts (HP), and<br />
sub-health posts were obtained from the Department of Health Services <strong>for</strong> the fiscal year 2000/2001<br />
(from second half July 2000 to first half July, 2001). Since the census enumeration was also conducted<br />
in mid June of 2001, these two different data sets can be used together to compute the indicator.<br />
The (estimated) population per (government) health institution over the country as a whole was 5,663;<br />
district-wise it varied from 685 (Manang) to 17,177 (Kanchanpur). The value of the ratio was below the<br />
national average in 50 districts and above in 25 districts. The population pressure on health infrastructure<br />
is higher in Terai and hill region than mountain region. Figure 2.7 shows the number of health institute<br />
and population per institution.<br />
Figure 2.6. Map showing number of health institutions in districts (Source:(ICIMOD and CBS, 2003b))<br />
Figure 2.7. Map showing Number of health institutions and population per institution (Source:(ICIMOD and CBS, 2003b))<br />
26


