

Nepal Hazard Risk Assessment - Asia-Pacific Gateway for Disaster ...
Nepal Hazard Risk Assessment - Asia-Pacific Gateway for Disaster ...
Nepal Hazard Risk Assessment - Asia-Pacific Gateway for Disaster ...

Create successful ePaper yourself
Turn your PDF publications into a flip-book with our unique Google optimized e-Paper software.
<strong>Nepal</strong> <strong>Hazard</strong> <strong>Risk</strong> <strong>Assessment</strong><br />
On the basis of the estimated 100-year extreme monthly rainfall, a precipitation index Tp1 was assigned<br />
as listed in the table below.<br />
Table 1.6. Precipitation index T p1<br />
100‐year extreme<br />
monthly rainfall Susceptibility Tp1<br />
(mm)<br />
0000 – 0330 Low 1<br />
0331 – 0625 Moderate 2<br />
0626 – 1000 Medium 3<br />
1001 – 1500 High 4<br />
> 1500 Very high 5<br />
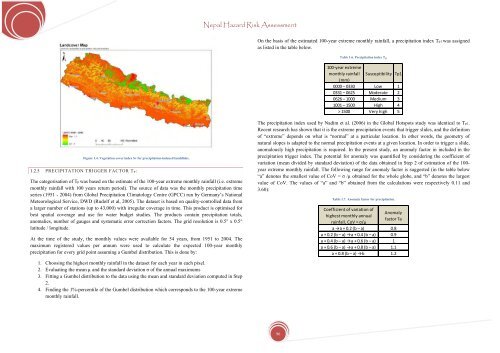
Figure 1.4. Vegetation cover index Sv <strong>for</strong> precipitation-induced landslides.<br />
1.2.5 PRECIPITATION TRIGGER FACTOR T P :<br />
The categorisation of Tp was based on the estimate of the 100-year extreme monthly rainfall (i.e. extreme<br />
monthly rainfall with 100 years return period). The source of data was the monthly precipitation time<br />
series (1951 - 2004) from Global Precipitation Climatology Centre (GPCC) run by Germany’s National<br />
Meteorological Service, DWD (Rudolf et al, 2005). The dataset is based on quality-controlled data from<br />
a larger number of stations (up to 43,000) with irregular coverage in time. This product is optimised <strong>for</strong><br />
best spatial coverage and use <strong>for</strong> water budget studies. The products contain precipitation totals,<br />
anomalies, number of gauges and systematic error correction factors. The grid resolution is 0.5° x 0.5°<br />
latitude / longitude.<br />
At the time of the study, the monthly values were available <strong>for</strong> 54 years, from 1951 to 2004. The<br />
maximum registered values per annum were used to calculate the expected 100-year monthly<br />
precipitation <strong>for</strong> every grid point assuming a Gumbel distribution. This is done by:<br />
The precipitation index used by Nadim et al. (2006) in the Global Hotspots study was identical to Tp1.<br />
Recent research has shown that it is the extreme precipitation events that trigger slides, and the definition<br />
of “extreme” depends on what is “normal” at a particular location. In other words, the geometry of<br />
natural slopes is adapted to the normal precipitation events at a given location. In order to trigger a slide,<br />
anomalously high precipitation is required. In the present study, an anomaly factor in included in the<br />
precipitation trigger index. The potential <strong>for</strong> anomaly was quantified by considering the coefficient of<br />
variation (mean divided by standard deviation) of the data obtained in Step 2 of estimation of the 100-<br />
year extreme monthly rainfall. The following range <strong>for</strong> anomaly factor is suggested (in the table below<br />
“a” denotes the smallest value of CoV = σ /µ obtained <strong>for</strong> the whole globe, and “b” denotes the largest<br />
value of CoV. The values of “a” and “b” obtained from the calculations were respectively 0.11 and<br />
3.60):<br />
Table 1.7. Anomaly factor <strong>for</strong> precipitation.<br />
Coefficient of variation of<br />
highest monthly annual<br />
rainfall, CoV = σ/µ<br />
Anomaly<br />
factor Ta<br />
a →a + 0.2 (b – a) 0.8<br />
a + 0.2 (b – a) →a + 0.4 (b – a) 0.9<br />
a + 0.4 (b – a) →a + 0.6 (b – a) 1<br />
a + 0.6 (b – a) →a + 0.8 (b – a) 1.1<br />
a + 0.8 (b – a) →b 1.2<br />
1. Choosing the highest monthly rainfall in the dataset <strong>for</strong> each year in each pixel.<br />
2. Evaluating the mean µ and the standard deviation σ of the annual maximums<br />
3. Fitting a Gumbel distribution to the data using the mean and standard deviation computed in Step<br />
2.<br />
4. Finding the 1%-percentile of the Gumbel distribution which corresponds to the 100-year extreme<br />
monthly rainfall.<br />
96


