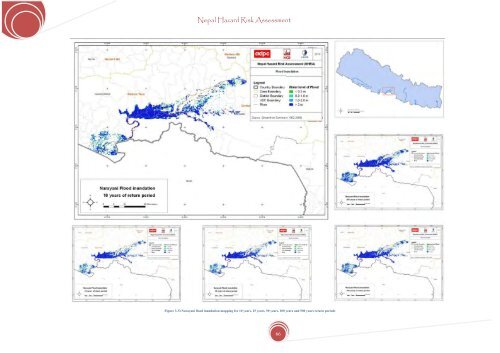
<strong>Nepal</strong> <strong>Hazard</strong> <strong>Risk</strong> <strong>Assessment</strong> Figure 3.33.Narayani flood inundation mapping <strong>for</strong> 10 years, 25 years, 50 years, 100 years and 500 years return periods 66
<strong>Nepal</strong> <strong>Hazard</strong> <strong>Risk</strong> <strong>Assessment</strong> 3.5 DROUGHT HAZARD ASSESSMENT 3.5.1 MAP CONTENT The map shows set of drought susceptibility maps developed based on Standard Precipitation Index (SPI). The SPI has been developed on the data collected from uni<strong>for</strong>mly distributed 40 meteorological stations across the country <strong>for</strong> the time span of more than three decades. The susceptibility maps have been developed based on the probability of occurrence of droughts with class of severity such as moderate, severe, extreme and moderate to extreme. The map shows the variation of drought in various seasons i.e. winter, Pre monsoon, Monsoon and Post Monsoon. 3.5.2 APPLICATION OF MAPS WITH RESPECT TO DISASTER RISK MANAGEMENT The maps will <strong>for</strong>m the basis <strong>for</strong> understanding the drought prone areas and temporal variation of drought in various regions. Various focal sectors like agriculture, water resources, disaster management and Irrigation may use the maps <strong>for</strong> water and food security in the region, development of national and regional plan <strong>for</strong> sustained agricultural development, Assess the climate change impact and develop the strategy <strong>for</strong> redefining the cropping pattern and water conservation. The maps will help central and local government to take proactive measures <strong>for</strong> allocation of resources and relief management. 3.5.3 DATA AVAILABILITY FROM SOURCES Reliable supporting documents, maps, appropriate models and methods <strong>for</strong> drought assessment were collected from different sources. Based on data quality, quantity and their spatial distribution overall 40 stations were selected as representative stations covering the entire country. The necessary climatic data required <strong>for</strong> computing the indices, i.e., monthly total rainfall and monthly mean temperature were collected from Department of Hydrology and Meteorology <strong>for</strong> the period of 1977-2007. Some of the sources <strong>for</strong> data is as below: • Central Bureau Statistics (CBS), 2005. Statistical Year book, <strong>Nepal</strong>. • DHM, 2001. Weekly Dry Spell Atlas of <strong>Nepal</strong>: Final Report. • DHM, 2001-2009. Preliminary monthly weather summary of <strong>Nepal</strong> from 2001 to 2008, Department of Hydrology and Meteorology. • DHM, 2009. Dry and Warm Winter 2009, Climate Section, Internal report of Department of Hydrology and Meteorology. • Gibbs, W. J. and Maher, J. V., 1967. Rainfall deciles as drought indicators. Bureau of Meteorology Bulletin, No. 48, Commonwealth of Australia, Melbourne. • National Climatic Data Center, 2006. Climate of 2006, U.S. Standardized Precipitation Index. • NDMC, 2009. Monitoring Drought. National Drought Mitigation Centre, University of Nebraska–Lincoln • Thornthwaite, C. W., 1948: An approach toward a rational classification of climate. Geographical Review, 38, 55–94. • World Meteorological Organization, 2005. Meteoworld (weather. Climate. Water), WMO , August 2005. • World Meteorological Organization, 1992. International Meteorological Vocabulary, WMO Report NO. 182, 2nd and. WMO: Geneva; 784. 3.5.4 SPECIAL REMARK • The drought assessment has been carried out using two most practiced Indices namely Standard Precipitation Index (SPI) and Soil Moisture Index (SMI). The indices have been developed based on rainfall collected from uni<strong>for</strong>mly distributed meteorological stations and temperature data. • The drought assessment results from both indices are having similar outcomes. It is observed that most of the severe to extreme droughts are occurring in winters. 3.5.5 METHODOLOGY The drought hazard assessment methodology is combined of SPI and SMI. The flowchart in Figure 3.34 shows the process of drought hazard assessment. The SPI has many advantages over other drought indices, such as the Palmer approach, which requires more variables. The details of the methodology and outcomes may be referred at Annexure-3. SPI Monthly Precipitation Data Format Data to run the model (SPI_SL_6.exe) Monthly and seasonal SPI values Economy impact Drought Index: SPI+SMI Monthly Mean Precipitation and Temperature Data SOIL MOISTURE/WATER SURPLUS/DEFICIENCY SOIL MOISTURE/WATER DEFICIENCY Potential Drought? Social impact Compute Heat Index and Potential evapotranpiration SMI (I m )= 100(P ‐ PET)/PET Monthly and seasonal SMI values Environmental impact Figure 3.34. Flow chart of drought index computation and its impact in different sectors. 67