Program and Abstracts - Gulf Coast Section SEPM
Program and Abstracts - Gulf Coast Section SEPM
Program and Abstracts - Gulf Coast Section SEPM

Create successful ePaper yourself
Turn your PDF publications into a flip-book with our unique Google optimized e-Paper software.
Attributes: New Views on Seismic Imaging—<br />
Their Use in Exploration <strong>and</strong> Production<br />
31st Annual <strong>Gulf</strong> <strong>Coast</strong> <strong>Section</strong> <strong>SEPM</strong> Foundation<br />
Bob F. Perkins Research Conference<br />
2011<br />
<strong>Program</strong> <strong>and</strong> <strong>Abstracts</strong><br />
Hilton Houston North<br />
Houston, Texas<br />
December 4–7, 2011<br />
Edited by<br />
Kurt J. Marfurt, Dengliang Gao, Art Barnes,<br />
Satinder Chopra, Antonio Corrao,<br />
Bruce Hart, Huw James, Jory Pacht,<br />
<strong>and</strong> Norman C. Rosen<br />
Attributes: New Views on Seismic Imaging—Their Use in Exploration <strong>and</strong> Production<br />
i
Copyright © 2011 by the<br />
<strong>Gulf</strong> <strong>Coast</strong> <strong>Section</strong> <strong>SEPM</strong> Foundation<br />
www.gcssepm.org<br />
Published December 2011<br />
The cost of this conference has been subsidized by generous grants from<br />
Statoil <strong>and</strong> Hess Corporation.<br />
ii<br />
<strong>Program</strong> <strong>and</strong> <strong>Abstracts</strong>
Foreword<br />
Seismic data have often played a significant, <strong>and</strong><br />
sometimes dominant role in previous Bob F. Perkins<br />
conferences, such as in last year’s conference on seismic<br />
geomorphology. Nevertheless, the last conference<br />
to address the role of seismic attributes was held in<br />
1996. The advancement in algorithm development, 3D<br />
multiattribute visualization, interpretation workflows,<br />
<strong>and</strong> more quantitative reservoir characterization during<br />
this 15-year interval has been astounding. This year’s<br />
conference, “Attributes: New Views on Seismic Imaging—Their<br />
Use in Exploration <strong>and</strong> Production,” gathers<br />
some of the world’s foremost attribute software developers,<br />
service providers, <strong>and</strong> oil-company practitioners<br />
under one roof at the same time.<br />
The Perkins conference provides a unique<br />
opportunity for such an attribute forum. It is small<br />
enough, with only one session at a time, to provide a<br />
great deal of interaction, particularly at meals <strong>and</strong><br />
breaks. Yet it is large enough to allow the participation<br />
<strong>and</strong> input of the greater seismic interpretation community.<br />
You will find the quality <strong>and</strong> technical content of<br />
the papers provide the feel of a “technical workshop,”<br />
whereby experts can compare <strong>and</strong> contrast state-ofthe-art<br />
innovations with their expert peer group. However,<br />
we have instructed the authors that the intended<br />
GCS<strong>SEPM</strong> audience will be primarily practicing geologists<br />
<strong>and</strong> geophysicists, <strong>and</strong> to pitch their papers <strong>and</strong><br />
presentations appropriately. Thus, the tone of the conference<br />
will be more tutorial, with the expected<br />
outcome much like a short-course for the conference<br />
participants at large, with the associated “take-aways”<br />
<strong>and</strong> “best practices” that go with such venues.<br />
The organization of the 34 papers mimics the<br />
E&P progression of attribute use from early qualitative<br />
scoping activities to later quantitative reserve<br />
assessment <strong>and</strong> infill-drilling decisions. The<br />
conference begins on Monday morning with (1) data<br />
conditioning/case studies, continues through (2)<br />
visualization <strong>and</strong> feature extraction, (3) interpretation<br />
workflows, (4) clustering <strong>and</strong> classification, (5) fault<br />
<strong>and</strong> fracture analysis, (6) seismic inversion <strong>and</strong> AVO,<br />
<strong>and</strong> ends on Wednesday with (7) reservoir<br />
characterization. As attribute practitioner, we the<br />
conference co-convenors are truly impressed with the<br />
innovation, breath, <strong>and</strong> quality of the authors’<br />
contributions.<br />
We thank our editorial team of Art Barnes, Satinder<br />
Chopra, Antonio Corrao, Bruce Hart, Huw James,<br />
<strong>and</strong> Jory Pacht, for providing two careful peer reviews<br />
<strong>and</strong> timely feedback for each of the contributed papers.<br />
Most of all we thank Norm Rosen, who to us is the face<br />
of the GCS<strong>SEPM</strong> Perkins conference for his tireless<br />
encouragement, prodding, <strong>and</strong> yes, worrying, to see<br />
this product come to fruition.<br />
Kurt Marfurt <strong>and</strong> Dengliang Gao,<br />
<strong>Program</strong> Co-convenors<br />
Attributes: New Views on Seismic Imaging—Their Use in Exploration <strong>and</strong> Production<br />
iii
Attributes: New Views on Seismic Imaging—<br />
Their Use in Exploration <strong>and</strong> Production<br />
31st Annual <strong>Gulf</strong> <strong>Coast</strong> <strong>Section</strong> <strong>SEPM</strong> Foundation<br />
Bob F. Perkins Research Conference<br />
<strong>Program</strong><br />
Sunday, December 4<br />
4:00–6:00 p.m. Registration <strong>and</strong> Refreshments (Donatello Foyer/Ballroom)<br />
Monday, December 5<br />
7:00 a.m. Continuous Registration <strong>and</strong> hot Continental Breakfast (Donatello Foyer)<br />
7:45 a.m. Welcome Remarks, Tony D’Agostino (Chair of the Board of Trustees, GCS<strong>SEPM</strong> <br />
Foundation) (Donatello Foyer)<br />
7:55 a.m. Introduction to the Conference, Kurt Marfurt <strong>and</strong> Dengliang Gao (Conference <br />
Co-Convenors)<br />
Session 1<br />
8:00 a.m. Introduction—Bruce Hart, Huw James<br />
8:05 a.m. Footprint Suppression Applied to Legacy Seismic Data Volumes ................................................1<br />
Davogustto, Oswaldo <strong>and</strong> Marfurt, Kurt<br />
8:35 a.m. The Effects of Seismic Data Conditioning on Prestack Simultaneous Impedance Inversion ........2<br />
Singleton, Scott<br />
9:05 a.m. Hewett Plattendolomite: Reservoir Characterization by Resolution- Enhanced Seismic Data ....3<br />
Corrao, Antonio; Fervari, Massimo; <strong>and</strong> Galbiati, Mauro<br />
9:35 a.m. Displaying Seismic Data to Look Like Geology ............................................................................4<br />
Barnes, Arthur E.<br />
10:05 a.m. Coffee Break (Donatello Foyer)<br />
10:30 a.m. Visualizing Geological Structure with Subtractive Color Blending ..............................................5<br />
Purves, Steve <strong>and</strong> Basford, Helen<br />
11:00 a.m. Multiattribute Visualization Using Multivariate Volume Rendering <strong>and</strong> Glyphs .........................6<br />
Marbach, Jonathan; Kadlec, Benjamin; <strong>and</strong> Carlson, James<br />
iv<br />
<strong>Program</strong> <strong>and</strong> <strong>Abstracts</strong>
11:30 a.m. Domain Transform of Seismic Data Volumes to Optimize Visualization of the Geomorph-<br />
ology of Depositional Systems .......................................................................................................7<br />
Dorn, Geoffrey A.<br />
12–1:30 p.m. Full hot lunch served in the Alfresco (included with registration)<br />
Session 2<br />
1:30 p.m. Introduction—Jory Pacht <strong>and</strong> Geoff Dorn<br />
1:35 p.m. New Method of Volume Rendering Applied to Seismic Dataset of the Barnett Shale ...................8<br />
James, Huw; Ragoza, Evgeny; <strong>and</strong> Kostrova, Tatyana<br />
2:00 p.m. Advanced Multiattribute Imaging <strong>and</strong> Geobody Delineation of Jurassic <strong>and</strong> Triassic <br />
Stratigraphic Targets ....................................................................................................................9<br />
McArdle, Nicholas; Purves, Steve; Lowell, James; Norton, Dale; Basford, Helen; <br />
<strong>and</strong> Kristensen, Trond<br />
2:30 p.m. Phase Analysis: A Complementary Tool to Spectral Decomposition? .........................................10<br />
Van der Baan, Mirko; Fomel, Sergey; <strong>and</strong> Perz, Mike<br />
3:00 p.m. Coffee Break (Donatello Foyer)<br />
3:30 p.m. Integrating Seismic Attributes for Geo-Modeling Purposes: Nigeria Deep-Water Turbidite <br />
Environment Case Study ...............................................................................................................11<br />
Braccini, E. <strong>and</strong> Adeyemi, A.<br />
4:00 p.m. Frequency-Dependent Seismic Attributes Applied to Stratigraphic Interpretation ......................12<br />
Zeng, Hongliu<br />
4:30 p.m. Utilization of Instantaneous Amplitude Attribute as a Tool for Prospecting <strong>and</strong> Risk <br />
Reduction: An Example from Ada Field, North Louisiana ...........................................................13<br />
Shrestha, Rajendra K. <strong>and</strong> Greene, D. Lawrence<br />
5:10–8:00 p.m. Hot buffet, open bar, <strong>and</strong> round table (DaVinci Room) (Event sponsored by Statoil)<br />
Tuesday, December 6<br />
7:15 a.m. Continuous Registration <strong>and</strong> hot Continental Breakfast (Donatello Foyer)<br />
Session 3<br />
8:00 a.m. Introduction—Satinder Chopra <strong>and</strong> Dave Paddock<br />
8:05 a.m. Underst<strong>and</strong>ing Thin Beds Using 3D Seismic Analysis Workflows ................................................14<br />
Henning, Alison <strong>and</strong> Paton, Gaynor<br />
8:35 a.m. Making Seismic Data Relevant in Unconventional Plays .............................................................15<br />
Roth, Murray<br />
9:05 a.m. Multivariate Supervised Classification, Application to a New Zeal<strong>and</strong> Offshore Field ...............16<br />
Hami-Eddine, Kamal; Klein, Pascal; Richard, Loic; Elabed, Dorra; Chatila, Eric; <br />
<strong>and</strong> Furniss, Andrew<br />
Attributes: New Views on Seismic Imaging—Their Use in Exploration <strong>and</strong> Production<br />
v
9:35 a.m. Interpreter-Driven Multiattribute Classification ...........................................................................17<br />
Sutton, Katy; Paton, Gaynor; Lowell, James; <strong>and</strong> Purves, Stephen<br />
10:05 a.m. Coffee Break (Donatello Foyer)<br />
10:30 a.m. Application of 3D Clustering Analysis for Deep Marine Seismic Facies Classification—<br />
An Example from Deep-Water Northern <strong>Gulf</strong> of Mexico ..............................................................18<br />
Roy, Atish; Matos, Marcilio M. Castro de; <strong>and</strong> Marfurt, Kurt J.<br />
11:00 a.m. A Guide to the Practical Use of Neural Networks .........................................................................19<br />
Brouwer, Friso C. G.; Tingahl, Kristofer; <strong>and</strong> Connolly, David<br />
11:30 a.m. Interactive Seismic Attribute Analysis for Reservoir Characterization .......................................20<br />
Wen, Renjun<br />
12–1:30 p.m. Full hot lunch, included with registration. Location TBA.<br />
Session 4<br />
1:30 p.m. Introduction—Art Barnes <strong>and</strong> James Schuelke<br />
1:35 p.m. An Integrated Workflow to Optimize Discontinuity Attributes for the Imaging of Faults ............21<br />
Brouwer, Friso <strong>and</strong> Huck, Arnaud<br />
2:00 p.m. Analysis <strong>and</strong> Interpretation of Fracture Direction <strong>and</strong> Intensity from Full Azimuth Seismic <br />
Data ...............................................................................................................................................22<br />
Wang, Joanne <strong>and</strong> Dopkin, Duane<br />
2:30 p.m. A Robust <strong>and</strong> Compute-Efficient Variant of the Radon Transform ...............................................23<br />
Aarre, Victor <strong>and</strong> Wallet, Bradley<br />
3:00 p.m. Coffee Break (Donatello Foyer)<br />
3:30 p.m. Automatic Fault Extraction in Hard <strong>and</strong> Soft Rock Environments ...............................................24<br />
Dorn, Geoffrey A. <strong>and</strong> Kadlec, Benjamin<br />
4:00 p.m. Characterization of Vuggy Porosity <strong>and</strong> Fractures Using Poststack Seismic Attributes: <br />
Application to a Carbonate Reservoir ...........................................................................................25<br />
Ouenes, Ahmed; Aoues, Amares; <strong>and</strong> Kirkham, Anthony<br />
4:30 p.m. Which Curvature is Right for You? ..............................................................................................26<br />
Chopra, Satinder <strong>and</strong> Marfurt, Kurt J.<br />
5:00–8:00 p.m. Beer, margaritas, snacks, <strong>and</strong> round table (DaVinci Room) (Event sponsored by Hess<br />
Corporation)<br />
vi<br />
<strong>Program</strong> <strong>and</strong> <strong>Abstracts</strong>
Wednesday, December 7<br />
7:15 a.m. Continuous Registration <strong>and</strong> hot Continental Breakfast (Donatello Foyer)<br />
Session 5<br />
8:00 a.m. Introduction—Paul Weimer <strong>and</strong> Antonio Corrao<br />
8:05 a.m. Developing an Exploration Tool in a Mature Trend: A 3D AVO Case Study in South Texas ......27<br />
Gregg, Mark E. <strong>and</strong> Bukowski, Charles T., Jr.<br />
8:35 a.m. Seismic Acoustic Impedance: An Indicator for Deep-Water Depositional Processes .................28<br />
Chen, Jiajie (Jeff)<br />
9:05 a.m. A Seismic Reservoir Characterization Work Flow for Reducing Risk Utilizing AVO, <br />
Simultaneous Prestack Inversion, <strong>and</strong> Rock Physics ...................................................................29<br />
Leiceaga, Gorka Garcia; Berhanu, Solomon Assefa; Vargas, Africa Jimenez; <br />
Silva, Josimar; Zhang, Lei; Ng, David; <strong>and</strong> Sanz, Carlos<br />
9:35 a.m. 3D Seismic Curvature <strong>and</strong> Curvature Gradient for Fractured Reservoir Characterization <br />
at Teapot Dome (Wyoming) ..........................................................................................................30<br />
Gao, Dengliang; Wilson, Tom; Zhu, Lierong; <strong>and</strong> Marfurt, Kurt<br />
10:05 a.m. Coffee Break (Donatello Foyer)<br />
10:30 a.m. Facies Probabilities from Multidimensional Crossplots of Seismic Attributes: Applications <br />
to Jonah <strong>and</strong> Mamm Creek Tight Gas Fields ................................................................................31<br />
Michelena, Reinaldo J.; Godbey, Kevin S.; <strong>and</strong> Rodrigues, Patricia E.<br />
11:00 a.m. Overview of Seismic Attribute Analysis in Shale Plays .................................................................32<br />
Schuelke, James S.<br />
11:30 a.m. Stratigraphic Analysis in Carbonate Zones: An Investigation Using 3D Seismic Analysis <br />
Techniques on an Offshore UAE Field ..........................................................................................33<br />
Avu, Anthony; Paton, Gaynor; <strong>and</strong> Van Kleef, Frank<br />
12:00 p.m. Eagle Ford Exploration <strong>and</strong> Development—The Application of Regional Geology <strong>and</strong> <br />
Geophysical Technologies .............................................................................................................34<br />
Treadgold, Galen; McLain, Bill; Royer, Ted; Peebles, Ross; Sinclair, Steven; <br />
<strong>and</strong> Nicklin, David<br />
12:30 p.m. Concluding Remarks—Kurt Marfurt <strong>and</strong> Dengliang Gao<br />
Conference Adjournment<br />
Author Index ......................................................................................................................... A-1<br />
Attributes: New Views on Seismic Imaging—Their Use in Exploration <strong>and</strong> Production<br />
vii
GCS<strong>SEPM</strong> Foundation<br />
Anthony D’Agostino (Chairman)<br />
Hess Corporation<br />
Houston, Texas<br />
Richard H. Fillon<br />
Earth Studies Associates<br />
New Orleans, Louisiana<br />
Patricia Santogrossi<br />
Statoil<br />
Houston, Texas<br />
Trustees <strong>and</strong> Executive Director<br />
Jory Pacht<br />
Altair Resources<br />
Sugar L<strong>and</strong>, Texas<br />
Norman C. Rosen, Executive Director<br />
NCR & Associates<br />
Houston, Texas<br />
President<br />
Bruce S. Hart<br />
ConocoPhillips<br />
Houston, Texas<br />
President Elect<br />
Ursula Hammes<br />
Bureau of Economic Geology<br />
Austin, Texas<br />
Vice President<br />
Don Van Nieuwenhuise<br />
University of Houston<br />
Houston, Texas<br />
Michael J. Nault (Chairman)<br />
Applied Biostratigraphix<br />
Executive Council<br />
Secretary<br />
Charlotte Jolley<br />
Shell International<br />
Houston, Texas<br />
Treasurer<br />
Br<strong>and</strong>i Pool Sellepack<br />
ConocoPhillips<br />
Houston, Texas<br />
Past-President<br />
John Holbrook<br />
University of Texas at Arlington<br />
Arlington, Texas<br />
Audio-Visual <strong>and</strong> Poster Committee<br />
Arden Callender<br />
Applied Biostratigraphix<br />
Kurt Marfurt<br />
University of Oklahoma<br />
Art Barnes<br />
L<strong>and</strong>mark Graphics<br />
Satinder Chopra<br />
Arcis Corporation<br />
Antonio Corrao<br />
eni e&p division<br />
<strong>Program</strong> Advisory Committee Co-Chairmen<br />
Bruce Hart<br />
ConocoPhillips<br />
Huw James<br />
Integral Geo Services<br />
Jory Pacht<br />
Altair Resources<br />
viii<br />
<strong>Program</strong> <strong>and</strong> <strong>Abstracts</strong>
Contributors to the GCS<strong>SEPM</strong> Foundation<br />
Sponsorship Categories<br />
Please accept an invitation from the GCS<strong>SEPM</strong> <strong>Section</strong> <strong>and</strong> Foundation to support Geological <strong>and</strong> Geophysical<br />
Staff <strong>and</strong> Graduate Student Education in Advanced Applications of Geological Research to Practical Problems of<br />
Exploration, Production, <strong>and</strong> Development Geology.<br />
The GCS<strong>SEPM</strong> Foundation is not part of the <strong>SEPM</strong> Foundation. In order to keep our conferences priced at a low<br />
level <strong>and</strong> to provide funding for university staff projects <strong>and</strong> graduate scholarships, we must have industry support.<br />
The GCS<strong>SEPM</strong> Foundation provides several categories of sponsorship. In addition, you may specify, if you wish,<br />
that your donation be applied to Staff support, Graduate support, or support of our Conferences. Please take a<br />
moment <strong>and</strong> review our sponsor categories for 2011, as well as our current <strong>and</strong> past sponsors. In addition, we ask<br />
that you visit our sponsors’ Web sites by clicking on their logo or name. Thank you for your support.<br />
Corporate Sponsorships<br />
Diamond<br />
($15,000 or more)<br />
Platinum<br />
($10,000 to $14,999)<br />
Gold<br />
($6,000 to $9,999)<br />
Silver<br />
($4,000 to $5,999)<br />
Bronze<br />
($2,000 to $3,999)<br />
Patron<br />
($1000 to $1,999)<br />
Individuals & Sole Proprietorships<br />
Diamond<br />
($3,000 or more)<br />
Platinum<br />
($2,000 to $2,999)<br />
Gold<br />
($1,000 to $1,999)<br />
Silver<br />
($500 to $999)<br />
Bronze<br />
($300 to $499)<br />
Patron<br />
($100 to $299)<br />
Sponsor Acknowledgment<br />
For 2011, all sponsors will be pr ominently acknowledged on a special page inserted in t he 2011 <strong>and</strong> 2012<br />
Conference <strong>Abstracts</strong> volume <strong>and</strong> CDs, <strong>and</strong> with large placards strategically placed throughout the meeting areas<br />
during these conferences.<br />
Corporate-level Diamond sponsors will be acknowledged by having their logo displayed on the back cover of the<br />
jewel case for the Conference CD. Corporate level Platinum sponsors will be acknowledged by having their logo<br />
placed in the front matter of the <strong>Program</strong> & <strong>Abstracts</strong> volume. All contributions used for scholarships <strong>and</strong>/or grants<br />
will be given with acknowledgment of source.<br />
In addition to the recognition provided to our sponsors in GCS<strong>SEPM</strong> publications, we proudly provide a link to<br />
our sponsors’ Web sites. Just click on their logo or name to visit respective GCS<strong>SEPM</strong> sponsors.<br />
The GCS<strong>SEPM</strong> Foundation is a 501(c)(3) exempt organization. Contributions to the organization are tax<br />
deductible as charitable gifts <strong>and</strong> contributions.<br />
For additional information about making a donation as a sponsor or patron, please contact Dr. Norman C. Rosen,<br />
Executive Director, GCS<strong>SEPM</strong> Foundation, 2719 S. Southern Oaks Drive, Houston, TX 77068-2610. Telephone<br />
(voice or fax) 281-586-0833 or e-mail at gcssepm@comcast.net.<br />
Attributes: New Views on Seismic Imaging—Their Use in Exploration <strong>and</strong> Production<br />
ix
2011 Sponsors<br />
Corporations<br />
Platinum<br />
Silver<br />
Patron<br />
Individuals <strong>and</strong> Sole Proprietorships<br />
Gold<br />
Silver<br />
Michael Styzen<br />
Bonnie Weiss<br />
Michael J. Nault<br />
(Applied Biostratigraphix)<br />
Patricia Santogrossi<br />
Ed Picou<br />
x<br />
<strong>Program</strong> <strong>and</strong> <strong>Abstracts</strong>
2010 Sponsors<br />
Corporations<br />
Platinum<br />
Gold<br />
Silver<br />
Individuals <strong>and</strong> Sole Proprietorships<br />
Gold<br />
Silver<br />
Michael Styzen<br />
Ed Picou<br />
Michael J. Nault<br />
(Applied Biostratigraphix)<br />
Patricia Santogrossi<br />
Attributes: New Views on Seismic Imaging—Their Use in Exploration <strong>and</strong> Production<br />
xi
Credits<br />
CD ROM Design <strong>and</strong> Publishing by<br />
Rockport, Texas<br />
www.bergan.com<br />
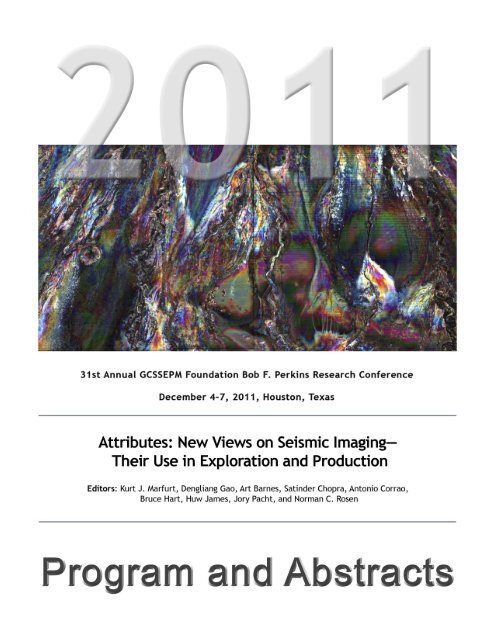
Cover Image<br />
The cover image chosen for this year’s conference is Figure 3A from Braccini <strong>and</strong> Adeyemi: “Integrating Seismic<br />
Attributes for Geo-Modeling Purposes: Nigeria Deep-Water Turbidite Environment Case Study”<br />
xii<br />
<strong>Program</strong> <strong>and</strong> <strong>Abstracts</strong>
Footprint Suppression Applied to Legacy Seismic Data Volumes<br />
Davogustto, Oswaldo<br />
University of Oklahoma<br />
100 E. Boyd St., Suite 710<br />
Norman, Oklahoma 73019<br />
email: dellpi@ou.edu<br />
Marfurt, Kurt<br />
University of Oklahoma<br />
100 E. Boyd St., Suite 710<br />
Norman, Oklahoma 73019<br />
Acquisition footprint often poses a major problem<br />
for 3D seismic data interpretation. Ideally,<br />
footprint from acquisition is h<strong>and</strong>led at the processing<br />
shop through more careful attention to trace balancing<br />
statics, noise reduction, <strong>and</strong> velocity analysis (Hill et<br />
al., 1999; Gülünay, 2000). Such reprocessing is not<br />
feasible on many legacy data volumes where the<br />
prestack data cannot be found or no longer exists. Seismic<br />
attributes often provide an effective means of<br />
delineating subtle geological features of interest such<br />
as channels, small faults, <strong>and</strong> f ractures but can also<br />
enhance acquisition footprint. For this reason attributes<br />
can be used to both design <strong>and</strong> evaluate the effectiveness<br />
of alternative footprint suppression workflows.<br />
Abstract<br />
In this work we review, apply, <strong>and</strong> evaluate the<br />
three most popular footprint suppression workflows:<br />
structure-oriented filtering, k x -k y filtering, <strong>and</strong> limited<br />
data reconstruction using singular value decomposition.<br />
We both characterize acquisition footprint <strong>and</strong><br />
evaluate its suppression by its attribute response<br />
through application to legacy data volumes acquired<br />
over the shelf of the <strong>Gulf</strong> of Mexico, the Central Basin<br />
Platform of Texas, the Delaware Basin of New Mexico,<br />
<strong>and</strong> the Anadarko Basin of Oklahoma. There is no silver<br />
bullet; in most cases it is useful to combine<br />
structure-oriented filtering <strong>and</strong> k x -k y filtering workflows<br />
as an attempt to r emove acquisition footprint<br />
from legacy data volumes.<br />
Attributes: New Views on Seismic Imaging—Their Use in Exploration <strong>and</strong> Production 1
The Effects of Seismic Data Conditioning on Prestack Simultaneous<br />
Impedance Inversion<br />
Singleton, Scott<br />
OHM Rock Solid Images<br />
2600 S. Gessner, Suite 650<br />
Houston, Texas 77063<br />
Abstract<br />
The dem<strong>and</strong>s that reservoir characterization<br />
places on seismic data far outweigh those of traditional<br />
structural interpretation. Because of this, gather conditioning<br />
is seen by many as a prerequisite to prestack<br />
inversion. This paper discusses three conditioning processes—signal/noise<br />
(S/N) improvement, stretch<br />
removal, <strong>and</strong> reflector alignment. It then seeks to document<br />
the improvements that these processes achieve in<br />
the gathers <strong>and</strong> in prestack inversion.<br />
Specifically, the gathers were measured for AVO<br />
fit using a 2- term Shuey equation <strong>and</strong> found to be<br />
improved by 20%. A comparison of wavelets extracted<br />
from each angle stack found the high frequency limit of<br />
stable phase to have increased from 30 Hz to 50 Hz.<br />
The far angle stack seismic/synthetic inversion residuals<br />
showed a 43% dr op in ampl itude <strong>and</strong> co mpletely<br />
different frequency <strong>and</strong> reflector character following<br />
gather conditioning. Finally, the acoustic impedance<br />
(AI) vs. s hear impedance (SI) cross-plot showed a<br />
much more compact signature that allowed more definitive<br />
lithology <strong>and</strong> pay discrimination. Conversely, the<br />
raw data cross-plot contained noisy data that erroneously<br />
entered into the area of the cross-plot where the<br />
pay signature lay. Geobodies captured from improperly<br />
conditioned data are thus (1) inflated in size by 62%,<br />
<strong>and</strong> (2) have lower impedances than is justified from<br />
well control. These errors, in turn, would lead to incorrect<br />
rock property (hydrocarbon saturation <strong>and</strong> porosity<br />
estimation) <strong>and</strong> reserve estimations.<br />
2 <strong>Program</strong> <strong>and</strong> <strong>Abstracts</strong>
Hewett Plattendolomite: Reservoir Characterization by Resolution-<br />
Enhanced Seismic Data<br />
Corrao, Antonio<br />
Fervari, Massimo<br />
Galbiati, Mauro<br />
eni e&p division<br />
Via Emilia, 1<br />
San Donato Milanese (Milan), Italy 20097<br />
email: antonio.corrao@eni.com<br />
We present a work flow for poststack seismic<br />
signal preconditioning that comprises noise attenuation<br />
<strong>and</strong> resolution enhancement steps; multiple algorithms<br />
have been adopted <strong>and</strong> their relative advantages <strong>and</strong><br />
limitations are discussed. Specifically, we evaluate the<br />
benefit of two noise reduction approaches (LUM <strong>and</strong><br />
SVD filters) <strong>and</strong> two r esolution enhancement techniques<br />
(adaptive whitening <strong>and</strong> implicit sparse<br />
deconvolution). Such preconditioning work flows are<br />
typically used to prepare seismic data prior to detailed<br />
reservoir interpretation <strong>and</strong> characterization studies: as<br />
an example the Hewett Plattendolomite case is<br />
presented.<br />
Given the complex reflectivity of the Zechstein<br />
group (a cyclic sequence of limestones, dolostones, salt<br />
Abstract<br />
<strong>and</strong> anhydrites) <strong>and</strong> the limited thickness of the reservoir<br />
(close to seismic resolution), seismic<br />
characterization is notoriously problematic.<br />
The adoption of a resolution-enhanced seismic<br />
volume, supported by forward synthetic modeling <strong>and</strong><br />
well data, allowed for a semi-quantitative seismic interpretation<br />
of the Plattendolomite reservoir <strong>and</strong> the<br />
delineation of its geometry <strong>and</strong> internal structure that<br />
had not been possible to recognize on the original seismic.<br />
B<strong>and</strong>width-enhanced data also permitted a<br />
quantitative calibration of several seismic indicators<br />
(amplitude dimming, apparent thickness variations,<br />
<strong>and</strong> wave form), to produce porosity <strong>and</strong> net thickness<br />
maps of the new reservoir.<br />
Attributes: New Views on Seismic Imaging—Their Use in Exploration <strong>and</strong> Production 3
Displaying Seismic Data to Look Like Geology<br />
Barnes, Arthur E.*<br />
L<strong>and</strong>mark Graphics<br />
1805 Shea Center Drive<br />
Highl<strong>and</strong>s Ranch, Colorado 80129<br />
*Now at Petronas Research<br />
Kajang, Malaysia<br />
email: arthur.barnes@yahoo.com<br />
Seismic reflection data can be displayed to<br />
resemble illuminated apparent topography colored by<br />
amplitude or other data. In this way, seismic data can<br />
be made to look like geology. This fosters geologic<br />
intuition <strong>and</strong> aids interpretation by readily relating geophysical<br />
or stratigraphic information to the geological<br />
structure. With modern coherency filters, structural <strong>and</strong><br />
stratigraphic seismic attributes, 3D vi sualization, <strong>and</strong><br />
Abstract<br />
volume blending, it is straightforward to make such<br />
displays. Illumination is a key component of the work<br />
flow <strong>and</strong> is introduced through bump mapping or directional<br />
attributes. Two important directional attributes<br />
are relative amplitude change <strong>and</strong> sei smic shaded<br />
relief. Shaded relief is especially powerful <strong>and</strong> reveals<br />
a wider variety of structural elements than other structural<br />
attributes.<br />
4 <strong>Program</strong> <strong>and</strong> <strong>Abstracts</strong>
Visualizing Geological Structure with Subtractive Color Blending<br />
Purves, Steve<br />
Newcastle Technopole<br />
Kings Manor<br />
Newcastle upon Tyne<br />
United Kingdom<br />
Basford, Helen<br />
Northpoint<br />
Suite e3<br />
Aberdeen Science <strong>and</strong> Energy Park<br />
Exploration Drive<br />
Aberdeen<br />
United Kingdom<br />
3D seismic attributes enable seismic interpreters<br />
to gain a more complete underst<strong>and</strong>ing of subsurface<br />
geology resulting in more complete <strong>and</strong> detailed interpretations.<br />
Building a th orough underst<strong>and</strong>ing of 3D<br />
structural variations <strong>and</strong> fault networks often requires<br />
working with multiple seismic attributes due to the fact<br />
that different attributes convey different information<br />
<strong>and</strong> that the seismic signature of faults changes through<br />
the data set.<br />
Color blending techniques have proven effective<br />
in intuitively allowing interpretation of information in<br />
multiple seismic attributes simultaneously. One of the<br />
most successful techniques uses an RGB (Red, Green,<br />
<strong>and</strong> Blue) color model to present data in a m anner<br />
which is in tune with the way p eople perceive color.<br />
These types of blend are highly effective at visualizing<br />
Abstract<br />
data such as results of poststack frequency decomposition<br />
or offset-stack volumes.<br />
We present an al ternate color-blending model<br />
based on combining attributes using the subtractive primary<br />
colors cyan, magenta, <strong>and</strong> yellow (CMY). When<br />
used with structural attributes, the subtractive model<br />
produces displays that are predominately light, <strong>and</strong><br />
structural variations <strong>and</strong> f aults are associated with<br />
darker shades of varying hues <strong>and</strong> black, <strong>and</strong> the model<br />
is aligned with the way we are accustomed to visualize<br />
fault <strong>and</strong> structural attributes, making these displays<br />
very intuitive.<br />
In this paper we provide a number of examples<br />
of how the se blends can be us ed to show how fa ult<br />
character changes laterally through a fault network <strong>and</strong><br />
relate individual faults to surrounding damage, drag<br />
zones, <strong>and</strong> areas of high fault density.<br />
Attributes: New Views on Seismic Imaging—Their Use in Exploration <strong>and</strong> Production 5
Multiattribute Visualization Using Multivariate Volume Rendering <strong>and</strong><br />
Glyphs<br />
Marbach, Jonathan<br />
Kadlec, Benjamin<br />
Carlson, James<br />
TerraSpark Geosciences, L.L.C.<br />
2525 Arapahoe Ave<br />
Unit E4 PMB 544<br />
Boulder, Colorado 80302-6746<br />
Software developed for the interpretation <strong>and</strong><br />
analysis of geoscientific data produces no shortage of<br />
attributes designed to measure one salient factor; but as<br />
the number of attributes that can be calculated grows,<br />
the tools for visualizing these attributes must grow as<br />
well. This paper explores some early applications of<br />
multivariate visualization tools to interpreting faults,<br />
stratigraphy, <strong>and</strong> mic roseismic events. The spe cific<br />
tools we e xamine here are multidimensional transfer<br />
functions for volume rendering <strong>and</strong> glyph displays for<br />
multivariate visualization. We present two applications<br />
of multidimensional transfer functions: one example<br />
combines information from a fault probability volume<br />
Abstract<br />
with a fault azimuth volume to display fault trends very<br />
early in the fault interpretation work flow; the second<br />
example shows improvements to the definition of a<br />
channel boundary by combining an eigenvalue volume<br />
with raw amplitudes. Multivariate visualization is presented<br />
in the context of visualizing eigenstructure<br />
around an interpreted channel <strong>and</strong> the simultaneous<br />
display of several attributes of microseismic events.<br />
Although the tools <strong>and</strong> techniques discussed here are<br />
not entirely new, their application in the geosciences is<br />
rare, <strong>and</strong> has the potential to reveal more information to<br />
interpreters about their data.<br />
6 <strong>Program</strong> <strong>and</strong> <strong>Abstracts</strong>
Domain Transform of Seismic Data Volumes to Optimize Visualization of the<br />
Geomorphology of Depositional Systems<br />
Dorn, Geoffrey A., Ph.D.<br />
TerraSpark Geosciences, L.L.C.<br />
2525 Arapahoe Ave<br />
Unit E4 PMB 544<br />
Boulder, Colorado 80302-6746<br />
The interpretation of depositional systems is<br />
challenging because the effects of ge ologic structure<br />
obscure the depositional systems in 3D s eismic volumes.<br />
Even if a combination of attributes can be shown<br />
to highlight particular stratigraphy in a volume, it<br />
remains difficult to interpret due to the effects of structure<br />
(such as faulting, folding, <strong>and</strong> rotation) obscuring<br />
the stratigraphic features of interest.<br />
Domain Transformation removes arbitrarily<br />
complicated structure from a seismic volume, It is an<br />
interpretation-guided 3D transform that creates a v olume<br />
consisting entirely of stratal-slices. The structural<br />
effects removed by the Domain Transform include differential<br />
sedimentation/compaction, folds, faults (3D<br />
displacement), unconformities (including angular<br />
unconformities), canyons, salt bodies, <strong>and</strong> ca rbonate<br />
buildups.<br />
Abstract<br />
The transformed volume is ideal for imaging <strong>and</strong><br />
interpreting depositional systems because every horizontal<br />
slice more closely represents a paleodepositional<br />
surface. Depositional systems are more readily recognized<br />
from their morphology on these slices. Other<br />
stratigraphic details are restored to the approximate<br />
position <strong>and</strong> relationships that they had at the time of<br />
deposition.<br />
The use of combinations of attributes facilitates<br />
the interpretation of depositional systems <strong>and</strong> depositional<br />
stratigraphy in domain-transformed seismic<br />
volumes. “Structural attributes (e.g., coherence-related<br />
attributes, curvature, <strong>and</strong> horizon orientation) may be<br />
combined with other attributes derived from structure<br />
tensor analysis <strong>and</strong> with waveform related attributes<br />
(e.g., amplitude <strong>and</strong> frequency). Corendering these<br />
attributes provides key insights regarding the depositional<br />
systems <strong>and</strong> their internal characteristics.<br />
Attributes: New Views on Seismic Imaging—Their Use in Exploration <strong>and</strong> Production 7
New Method of Volume Rendering Applied to Seismic Dataset of the Barnett<br />
Shale<br />
James, Huw<br />
Integral Geo Services<br />
4321 Kingwood Drive, #151<br />
Houston, Texas 77339<br />
Ragoza, Evgeny<br />
Kostrova, Tatyana<br />
Paradigm<br />
820 Gessner Rd., Suite 400<br />
Houston, Texas 77339<br />
Recent increases in the memory <strong>and</strong> power of<br />
graphics processing units now allow the rapid interactive<br />
computation <strong>and</strong> visualization use of 3D<br />
volumetric attributes. We show how interactive lighting<br />
<strong>and</strong> opacity using this new technology applied to<br />
traditional seismic attributes aids in the underst<strong>and</strong>ing<br />
of the faulting <strong>and</strong> slumping of the Barnett Shale over<br />
sink holes.<br />
Abstract<br />
The exploitation of unconventional shale reservoirs<br />
has heightened interest in the location of natural<br />
fractures <strong>and</strong> faults. The public is concerned about the<br />
leakage of reservoir <strong>and</strong> the liquids used for hydrofracturing<br />
into aquifers. In addition to aquifers, the<br />
operators are concerned about the loss of hydrofracturing<br />
fluids to anywhere outside of the reservoir. The<br />
example shows collapse features <strong>and</strong> faults may be<br />
seen with greater clarity for improved interpretation.<br />
8 <strong>Program</strong> <strong>and</strong> <strong>Abstracts</strong>
Advanced Multiattribute Imaging <strong>and</strong> Geobody Delineation of Jurassic <strong>and</strong><br />
Triassic Stratigraphic Targets<br />
McArdle, Nicholas<br />
Purves, Steve<br />
Lowell, James<br />
Norton, Dale<br />
Basford, Helen<br />
ffA<br />
Northpoint, Suite E3<br />
Aberdeen Science <strong>and</strong> Energy Park<br />
Exploration Drive<br />
Aberdeen, AB25 8HZ, UK<br />
Kristensen, Trond<br />
Lundin Petroleum<br />
Str<strong>and</strong>veien 50D<br />
NO-1366 Lysaker<br />
Norway<br />
Abstract<br />
We present the results of multiattribute imaging<br />
<strong>and</strong> geobody delineation applied to stratigraphic targets<br />
such as Jurassic channels <strong>and</strong> Triassic beaches <strong>and</strong><br />
spits, imaged in data from the Norwegian sector of the<br />
North Sea. Interpretation based on the examination of<br />
seismic amplitude alone is challenging due to the complexity<br />
<strong>and</strong> subtleness of these features.<br />
To improve the definition of these Mesozoic targets,<br />
we ha ve applied a mul tiattribute approach,<br />
combining frequency decomposition, seismic attribute<br />
analysis techniques, advanced visualization, <strong>and</strong> a new<br />
method of multiattribute geobody delineation. Attributes<br />
have been selected that are sensitive to the edge<br />
<strong>and</strong> magnitude response of sedimentary structures,<br />
while the use of narrow b<strong>and</strong> spectral magnitude volumes<br />
allows small scale frequency variations to be<br />
analyzed. These different sources are corendered using<br />
advanced color <strong>and</strong> opacity blending, providing multiattribute<br />
composite image volumes for subsequent<br />
interpretation <strong>and</strong> as input to further geobody delineation.<br />
The use of such advanced visualization has<br />
resulted in a collection of 3D volumes that successfully<br />
distinguish the internal <strong>and</strong> overbank geometry of<br />
channels as well as the structure <strong>and</strong> extent of Triassic<br />
s<strong>and</strong>bars.<br />
A new geobody delineation system has been<br />
designed to track visible structures in color blended<br />
images. The method is semi-automatic, allowing the<br />
interpreter to interactively guide the delineation process.<br />
Application of this technique has allowed the user<br />
to isolate <strong>and</strong> extract individual Jurassic channels, the<br />
seismic response of which varies considerably, as independent<br />
3D geobodies.<br />
We believe that the use of such advanced multiattribute<br />
visualization <strong>and</strong> de lineation techniques is<br />
applicable to similar provinces globally.<br />
Attributes: New Views on Seismic Imaging—Their Use in Exploration <strong>and</strong> Production 9
Phase Analysis: A Complementary Tool to Spectral Decomposition?<br />
Van der Baan, Mirko<br />
University of Alberta, Dept. of Physics<br />
13322 – 89 Avenue<br />
Edmonton, Alberta T6G 2G7, Canada<br />
email: Mirko.v<strong>and</strong>erBaan@ualberta.ca<br />
Fomel, Sergey<br />
University of Texas at Austin<br />
John A. <strong>and</strong> Katherine G. Jackson School of <br />
Geosciences<br />
Bureau of Economic Geology<br />
University Station<br />
Austin, Texas, USA<br />
email: Sergey.Fomel@beg.utexas.edu<br />
Perz, Mike<br />
Arcis Corporation<br />
2600, 111 – 5 th Ave SW<br />
Calgary, Alberta T2P 3Y6, Canada<br />
email: mperz@arcis.com<br />
Spectral decomposition is a st<strong>and</strong>ard tool to<br />
facilitate <strong>and</strong> accelerate seismic interpretation. Applications<br />
include highlighting changes in layer<br />
thicknesses (for example, in me<strong>and</strong>ering channels <strong>and</strong><br />
turbidite layers) as well as exploring for low-frequency<br />
gas shadows. We argue that local phase analysis serves<br />
Abstract<br />
as a complementary aid in seismic interpretation<br />
because the layer thickness, type of impe dance contrast,<br />
<strong>and</strong> boundary shape determine the amplitude,<br />
peak frequency, <strong>and</strong> phase of th e locally observed<br />
wavelet.<br />
10 <strong>Program</strong> <strong>and</strong> <strong>Abstracts</strong>
Integrating Seismic Attributes for Geo-Modeling Purposes: Nigeria Deep-<br />
Water Turbidite Environment Case Study<br />
Braccini, E.<br />
TOTAL Exploration<br />
Av. Larribau<br />
64018 PAU, FRANCE<br />
Adeyemi, A.<br />
TOTAL Upstream Nigeria<br />
Afribank St.<br />
V.I., LAGOS, NIGERIA<br />
Dense reflection seismic data have become an<br />
indispensable source of spatially continuous subsurface<br />
information when supported by a c orrectly calibrated<br />
earth model. This has been made possible thanks to the<br />
use of mul tiple attributes computed from 3D seismic<br />
data combined with visualization tools enhancing both<br />
structural <strong>and</strong> stratigraphic delineation. In t his study,<br />
we show the use of conventional <strong>and</strong> derived seismic<br />
attributes for a particular interval in Aderic Field,<br />
located in a deep-water offshore turbidite environment.<br />
The upper Miocene-lower Pliocene interval in<br />
Aderic Field corresponds to turbidite channel complexes<br />
(both erosive-constructive channels <strong>and</strong><br />
depositional channels), avulsion lobes, ponded lobes<br />
structures <strong>and</strong> regional mass transport complexes<br />
(MTC).<br />
Using an a priori sedimentological concept combined<br />
with basic knowledge of rock physics, one can<br />
infer detailed architectural elements from different<br />
Abstract<br />
seismic attributes where borehole information is not<br />
available.<br />
We found that combinations of amplitude maps<br />
at different angle stacks, autocorrelation <strong>and</strong> coherency<br />
of seismic traces, <strong>and</strong> spectral decomposition of the<br />
seismic data were valuable in analyzing the interval.<br />
Such analysis provides significant information<br />
on architectural element delineation for different channel<br />
complexes <strong>and</strong> sequences in terms of morphology<br />
<strong>and</strong> width. Levee systems, the erosive character of<br />
channels, <strong>and</strong> the morphologies of lobe systems with<br />
avulsion or ponded aspects can also be characterized.<br />
In some cases, an estimation of internal heterogeneities<br />
can also be proposed.<br />
Interpretations derived from these attributes<br />
compare favorably with possible analogues in similar<br />
depositional environment, as well as with field outcrop<br />
analogues <strong>and</strong> with images from very shallow Holocene-age<br />
seismic volumes.<br />
Attributes: New Views on Seismic Imaging—Their Use in Exploration <strong>and</strong> Production 11
Frequency-Dependent Seismic Attributes Applied to Stratigraphic<br />
Interpretation<br />
Zeng, Hongliu<br />
Bureau of Economic Geology<br />
Jackson School of Geosciences<br />
The University of Texas at Austin<br />
Seismic amplitude <strong>and</strong> instantaneous attributes<br />
as well as stratigraphic interpretation of these attributes<br />
are frequency <strong>and</strong> scale dependent. Frequency dependence<br />
offers a new dimension of seismic data that has<br />
not been fully utilized in the study of seismic picking<br />
of geologic surfaces, seismic facies, seismic geomorphology,<br />
<strong>and</strong> sequence stratigraphy. Seismic-tuning<br />
effects include thickness tuning <strong>and</strong> frequency tuning.<br />
Seismic modeling shows that, whereas thickness tuning<br />
determines seismic interference patterns <strong>and</strong>, therefore,<br />
occurrence of seismic events <strong>and</strong> seismic facies in<br />
stacked data, frequency tuning may further influence<br />
Abstract<br />
the nature of seismic-geologic time correlation <strong>and</strong><br />
modify seismic facies. Frequency-dependent data processing<br />
<strong>and</strong> interpretation are practical ways to study<br />
the frequency-tuning effect for improved seismic interpretation<br />
<strong>and</strong> well-seismic integration. Field data<br />
examples demonstrate that by using a local geologic<br />
model <strong>and</strong> well data, we can op timize the frequency<br />
components of seismic data to a certain degree <strong>and</strong><br />
intentionally modify seismic interference patterns <strong>and</strong><br />
seismic facies for better seismic interpretation of geologic<br />
surfaces, facies, geomorphology, <strong>and</strong> sequence<br />
stratigraphy.<br />
12 <strong>Program</strong> <strong>and</strong> <strong>Abstracts</strong>
Utilization of Instantaneous Amplitude Attribute as a Tool for Prospecting<br />
<strong>and</strong> Risk Reduction: An Example from Ada Field, North Louisiana<br />
Shrestha, Rajendra K.<br />
ConocoPhillips Company<br />
17030 Three Westlake Park<br />
600 North Dairy Ashford<br />
Houston, Texas 77079-1175<br />
Greene, D. Lawrence<br />
ConocoPhillips Company<br />
6046 Three Westlake Park<br />
600 North Dairy Ashford<br />
Houston, Texas 77079-1175<br />
This paper presents a case study illustrating the<br />
successful utilization of the instantaneous amplitude<br />
attribute generated from the 3D se ismic data in Ada<br />
Field, North Louisiana, in d elineating channel-body<br />
geometry, inferring the depositional environment, <strong>and</strong><br />
Abstract<br />
in prospecting, risk reduction, <strong>and</strong> optimization of infill<br />
well location in the Lower Cretaceous Hosston (Travis<br />
Peak in Texas) Formation, a pr olific, tight-gas<br />
s<strong>and</strong>stone.<br />
Attributes: New Views on Seismic Imaging—Their Use in Exploration <strong>and</strong> Production 13
Underst<strong>and</strong>ing Thin Beds Using 3D Seismic Analysis Workflows<br />
Henning, Alison*<br />
ffA<br />
800 West Sam Houston Parkway<br />
Building 12, 3rd Floor<br />
Houston, Texas 77024 USA<br />
*now at Rice University<br />
Department of Earth Science<br />
6100 Main Street, MS-126<br />
Houston, Texas 77005 USA<br />
Paton, Gaynor<br />
ffA<br />
The Excel Centre, Suite e3<br />
Aberdeen Science & Energy Park<br />
Exploration Drive, Bridge of Don<br />
Aberdeen, UK<br />
Abstract<br />
Seismic analysis workflows can hel p improve<br />
vertical resolution <strong>and</strong> identify thin beds on seismic<br />
reflection data. Thin beds are events that fall below the<br />
level of se ismic resolution <strong>and</strong> occur in all geologic<br />
settings. Thin bed analysis can help define pinch outs,<br />
internal bedding geometries, <strong>and</strong> other subtle stratigraphic<br />
features that are not initially visible on seismic<br />
data. We present workflows that include noise cancellation<br />
<strong>and</strong> spectral enhancement, as wel l as t errace,<br />
doublet, bed form, <strong>and</strong> in stantaneous frequency attributes<br />
to enhance the vertical resolution of 3D seismic<br />
data. Geobodies are then extracted from these attributes<br />
to produce a three-dimensional view of data zones having<br />
shared characteristics. Examples from several 3D<br />
data sets from different geologic settings illustrate the<br />
wide applicability of these workflows.<br />
14 <strong>Program</strong> <strong>and</strong> <strong>Abstracts</strong>
Making Seismic Data Relevant in Unconventional Plays<br />
Roth, Murray<br />
Transform Software <strong>and</strong> Services, Inc.<br />
Suite 205, 801 W. Mineral Ave.<br />
Littleton, Colorado 80120<br />
email: murray@transformsw.com<br />
From the dawn of the “digital E&P era” in the<br />
1960s, multi-channel seismic data redefined processes<br />
for optimizing well placement <strong>and</strong> reducing exploration<br />
risk. Two-dimensional seismic grids were later<br />
augmented with targeted 3D seismic surveys, driving<br />
the creation of “Computer Aided Exploration” (CAEX)<br />
workstations <strong>and</strong> automated map work flows. Seismic<br />
data emerged as the essential tool for mapping oil <strong>and</strong><br />
gas prospects in the 1980s <strong>and</strong> 1990s.<br />
As E&P targets became more geologically complex,<br />
seismic data were extended to become a practical<br />
for fault interpretation <strong>and</strong> fluid detection. As plays<br />
Abstract<br />
matured, seismic data again were adapted to provide<br />
time-lapse (4D) monitoring capabilities for mapping<br />
fluid <strong>and</strong> gas migration mapping for primary <strong>and</strong><br />
enhanced oil <strong>and</strong> gas r ecovery. Enhanced resolution<br />
<strong>and</strong> accurate acoustic <strong>and</strong> elastic inversion (e.g.,<br />
lambda-rho, mu-rho) techniques further propelled the<br />
value of seismic data for lithologic <strong>and</strong> facies mapping,<br />
detailed well planning, <strong>and</strong> geosteering support.<br />
However, in this new era of “unconventional”<br />
plays <strong>and</strong> engineering-driven “factory” field development,<br />
the question emerges: are seismic data still<br />
relevant?<br />
Attributes: New Views on Seismic Imaging—Their Use in Exploration <strong>and</strong> Production 15
Multivariate Supervised Classification, Application to a New Zeal<strong>and</strong><br />
Offshore Field<br />
Hami-Eddine, Kamal<br />
Paradigm<br />
1 rue de Gramont<br />
75002 Paris, France<br />
email: kamal.hami-eddine@pdgm.com<br />
Klein, Pascal<br />
Richard, Loic<br />
Elabed, Dorra<br />
Chatila, Eric<br />
Paradigm<br />
2 avenue Pierre Angot<br />
64053 Pau, France<br />
Furniss, Andrew<br />
AWE limited<br />
Level 16<br />
40 Mount Street North<br />
Sydney NSW 2060<br />
Australia<br />
This paper presents a new lithofacies prediction<br />
method using seismic prestack data <strong>and</strong> well lithofacies.<br />
The Democratic Neural Networks Association<br />
(DNNA) is used to perform the prediction. The association<br />
of neural networks with a Bayes approach helps<br />
to increase the robustness of the prediction <strong>and</strong> t o<br />
quantify the uncertainty. The primary aim of this process<br />
is not only to qualify reservoir heterogeneity <strong>and</strong><br />
Abstract<br />
lateral extension but also predict lithology where no<br />
well has yet been drilled.<br />
Lithofacies prediction from surface seismic data<br />
has been applied to the technically challenging Cretaceous<br />
rift of the Taranaki Basin where exploration<br />
objectives are focused primarily on th e Miocene <strong>and</strong><br />
the Pliocene turbidite s<strong>and</strong>stones. The prediction using<br />
DNNA is compared with two methods commonly used<br />
in the oil <strong>and</strong> gas industry.<br />
16 <strong>Program</strong> <strong>and</strong> <strong>Abstracts</strong>
Interpreter-Driven Multiattribute Classification<br />
Sutton, Katy<br />
Paton, Gaynor<br />
ffA<br />
The Northpoint Suite e3<br />
Aberdeen Science & Energy Park<br />
Exploration Drive<br />
Aberdeen<br />
AB23 8HZ, UK<br />
Lowell, James<br />
Purves, Stephen<br />
ffA<br />
Generator Studios<br />
Trafalgar Street<br />
Newcastle Upon Tyne<br />
NE1 2LA, UK<br />
Facies classification by means of multiattribute<br />
clustering is becoming a more widely used method of<br />
identifying <strong>and</strong> extracting multiple facies within a dataset.<br />
Typically these methods are entirely data driven,<br />
have minimal input, <strong>and</strong> therefore do not take into<br />
account any a priori knowledge from the interpreter.<br />
We present a new interpreter-driven technique that provides<br />
simple, real time interaction with<br />
multidimensional attribute space.<br />
Volumetric attribute analysis is an effective way<br />
of isolating individual properties of the seismic<br />
response. These properties can be drawn from models<br />
of the wavelet, from local geometry <strong>and</strong> shape, or from<br />
statistical behavior. Typically, more than one attribute<br />
is required to fully characterize an are a of interest.<br />
Abstract<br />
Simultaneous interpretation of multiple attributes has<br />
been greatly facilitated by modern color blending <strong>and</strong><br />
opacity blending schemes. However, objectively the<br />
simultaneous analysis of multiple attributes is difficult<br />
for the human interpreter. The interpreter-driven technique<br />
presented here is based on diverse context<br />
information stored in the human brain. By de fining<br />
facies within the 3D sub-surface space these contexts<br />
are converted into class, or cluster, centers. These class<br />
centers define seismic facies based on the statistical<br />
distribution of the attributes included in the<br />
classification.<br />
We apply our methodology to diverse hydrocarbon<br />
provinces at both regional <strong>and</strong> reservoir scale<br />
classification.<br />
Attributes: New Views on Seismic Imaging—Their Use in Exploration <strong>and</strong> Production 17
Application of 3D Clustering Analysis for Deep Marine Seismic Facies<br />
Classification—An Example from Deep-Water Northern <strong>Gulf</strong> of Mexico<br />
Roy, Atish<br />
The University of Oklahoma, Norman<br />
100 E Boyd Street, Suite 710<br />
Norman, Oklahoma 73019<br />
Matos, Marcilio M. Castro de<br />
Independent Consultant<br />
Rio de Janiero<br />
Brasil<br />
email: marcilio@matos.eng.br<br />
Marfurt, Kurt J.<br />
The University of Oklahoma, Norman<br />
100 E Boyd Street, Suite 710<br />
Norman, Oklahoma 73019<br />
The most popular seismic attributes fall into<br />
three broad categories: those that are sensitive to lateral<br />
changes in waveform <strong>and</strong> structure such as coherence<br />
<strong>and</strong> curvature; those sensitive to thin bed t uning <strong>and</strong><br />
stratigraphy, such as spectral components; <strong>and</strong> those<br />
sensitive to lithology <strong>and</strong> fluid properties, such as AVO<br />
<strong>and</strong> impedance inversion. We present a work flow that<br />
mimics multiattribute clustering routinely done by<br />
human interpreters that can differentiate depositional<br />
packages characterized by subtle changes in the stratigraphic<br />
column as well as lateral changes in texture.<br />
The best input attributes are those that are mathematically<br />
independent <strong>and</strong> rotationally invariant sensitive to<br />
the seismic facies of interest.<br />
The two most popular clustering algorithms in<br />
the seismic industry are neural networks <strong>and</strong> self-organizing<br />
maps. Each of these algorithms can be<br />
implemented in a supervised or unsupervised fashion.<br />
The clusters in unsupervised data analysis are defined<br />
by the data themselves, without any a priori information.<br />
In supervised training, a subset of clusters is<br />
predefined by the interpreter. The input data volumes<br />
are compared to these clusters; some are assigned to<br />
Abstract<br />
the predefined clusters, while others form clusters outside<br />
the area of supervision. The self-organizing map<br />
(SOM) is one of the most effective unsupervised pattern<br />
recognition techniques, <strong>and</strong> is commonly used for<br />
the automatic identification of seismic facies.<br />
To avoid guessing at the number of clusters necessary<br />
to represent the data, we have over-defined the<br />
number of initial clusters through the use of a l arge<br />
number of “prototype vectors” (prototype vectors),<br />
which after subsequent iterations tends to converge to<br />
the lesser number of actual clusters using a Kohonen<br />
self-organizing map neighborhood training rule. After<br />
the training is complete the modified prototype vectors<br />
are then color coded by using a 2D gr adational color<br />
scale. Those traces of a si milar seismic nature are<br />
assigned the same colors, resulting in a 3D seismic<br />
facies volume. Calibration is done a posteriori by<br />
corendering the colored prototype vectors with the<br />
original seismic amplitude data, input attributes, <strong>and</strong><br />
well control. We apply this clustering work flow to a<br />
deep-water 3D seismic survey in the northern <strong>Gulf</strong> of<br />
Mexico <strong>and</strong> calibrate it to a previously interpretation<br />
made using traditional methods.<br />
18 <strong>Program</strong> <strong>and</strong> <strong>Abstracts</strong>
A Guide to the Practical Use of Neural Networks<br />
Brouwer, Friso C. G.<br />
dGB Earth Sciences<br />
1 Sugar Creek Center BLVD STE 935<br />
Sugar L<strong>and</strong>, Texas 77478<br />
USA<br />
email: friso.brouwer@dgbes.com<br />
Connolly, David<br />
dGB Earth Sciences<br />
1 Sugar Creek Center BLVD STE 935<br />
Sugar L<strong>and</strong>, Texas 77478<br />
USA<br />
email: david.connolly@dgbes.com<br />
Tingahl, Kristofer<br />
dGB Earth Sciences<br />
1 Sugar Creek Center BLVD STE 935<br />
Sugar L<strong>and</strong>, Texas 77478<br />
USA<br />
email: kristofer.tingdahl@dgbes.com<br />
Abstract<br />
Seismic attribute analysis is a g reat tool to<br />
enhance <strong>and</strong> isolate features related to seismic acquisition,<br />
processing, <strong>and</strong> geology. However, single or<br />
primary attributes have two drawbacks that can be<br />
addressed by more intelligent work flows. First, seismic<br />
attributes may not uniquely identify the seismic<br />
feature that is the target of the analysis. For example,<br />
assuming that faults are the target of our attribute analysis,<br />
a discontinuity attribute highlights any lateral<br />
change in the signal, including both incised sedimentary<br />
features, <strong>and</strong> faulting. Second, seismic attributes<br />
may reveal some of the target features, but not all. For<br />
example, discontinuity attributes will not highlight<br />
faults that have small fault offset compared with the<br />
seismic resolution. Methods that recombine two or<br />
more primary attributes can be used to improve a complete<br />
<strong>and</strong> unique isolation of a t arget feature in t he<br />
seismic data. For example, fault detection can be performed<br />
by r ecombining discontinuity <strong>and</strong> curvature<br />
attributes, such that discontinuities attributed to sedimentary<br />
structures are suppressed, while low offset<br />
faults, represented by seismic flexures are highlighted.<br />
Among other methods, neural networks are one<br />
of the most efficient methods to r ecombine multiple<br />
input attributes <strong>and</strong> achieve a high quality extraction of<br />
a target feature or rock property from seismic data. The<br />
method is complex <strong>and</strong> difficult to analyze, <strong>and</strong> often,<br />
the black-box character is cited as a reason to stay clear<br />
of this method. However, in specific cases the benefits<br />
of using neural networks compared to baseline methods<br />
is so l arge that by far they outweigh any<br />
(perceived) negatives, <strong>and</strong> the neural network work<br />
flow is the correct tool to enhance a geological interpretation<br />
of seismic data.<br />
The aim of this paper is to “translate” the neural<br />
network method from a specialized tool that can only<br />
be used in the h<strong>and</strong> of an expert user, to a general interpretation<br />
work flow that can be used by informed (but<br />
not specialized) general interpreters. To achieve that,<br />
this paper will address the following issues:<br />
• When to choose a neural network work flow (<strong>and</strong><br />
when not).<br />
• Basic theory of neural networks<br />
• General, but practical, guidelines for designing<br />
<strong>and</strong> training a neural network.<br />
• Methods for quality control <strong>and</strong> validation of<br />
neural network results.<br />
• How to use the neural network results as part of<br />
the larger interpretation work flow.<br />
These talking points will be il lustrated with<br />
actual data examples.<br />
Attributes: New Views on Seismic Imaging—Their Use in Exploration <strong>and</strong> Production 19
Interactive Seismic Attribute Analysis for Reservoir Characterization<br />
Wen, Renjun<br />
Geomodeling Technology Corp.<br />
1100 665-8 Street NW<br />
Calgary, AB, T2P 3K7<br />
Canada<br />
email: Renjun@geomodeling.com<br />
Being “interactive” is not only important for traditional<br />
seismic interpretation, which maps subsurface<br />
structural <strong>and</strong> stratigraphic features; it should also be<br />
an essential feature in the seismic attribute analysis for<br />
reservoir characterization <strong>and</strong> prediction. In this paper<br />
we present interactive workflows that integrate major<br />
steps in seismic attribute analysis, namely attribute calculation,<br />
visualization, calibration, classification, <strong>and</strong><br />
prediction. Interactive analysis workflows are demonstrated<br />
as more effective <strong>and</strong> powerful than traditional<br />
linear workflows.<br />
We introduce the “strata-grid” as the major<br />
object for analyzing attributes in the interactive attribute<br />
workflow. A strata-grid defines a t arget<br />
stratigraphic volume, based on stratigraphic relationships,<br />
that is proportional, top-conformable, or bottomconformable.<br />
Seismic attribute features are better<br />
delineated on s tratigraphic slices within a s trata-grid,<br />
rather than through traditional time slices or simple<br />
horizon slices. The strata-grid makes the interaction<br />
with the data possible, not only for visualizing the data<br />
but also for quantitatively analyzing attributes for large<br />
Abstract<br />
3D seismic surveys - without h<strong>and</strong>ling the whole data<br />
volume.<br />
Interactive analysis of attributes not only<br />
improves the interpreter’s efficiency, it allows users to<br />
identify reservoir features that w ould otherwise be<br />
missed in a non-interactive approach. For example, the<br />
real-time link between attribute generation <strong>and</strong> visualization<br />
makes it poss ible to qui ckly fine-tune<br />
calculation parameters to generate quality attributes <strong>and</strong><br />
to find better attributes to characterize reservoir properties.<br />
The power <strong>and</strong> usability of facies classification<br />
<strong>and</strong> prediction methods are greatly enhanced in an<br />
interactive workflow, since results based on different<br />
assumptions can be v erified <strong>and</strong> calibrated with well<br />
data quickly. In addition to the real-time link between<br />
analysis methods <strong>and</strong> visualization; a co-rendering of<br />
multiple attributes in 2D or 3D ca n generate seismic<br />
facies maps or f acies volumes interactively, which<br />
complements the algorithm-based classification methods.<br />
Through real-world examples, we illustrate that<br />
the full potential of seismic attributes are better realized<br />
through interactive workflows.<br />
20 <strong>Program</strong> <strong>and</strong> <strong>Abstracts</strong>
An Integrated Workflow to Optimize Discontinuity Attributes for the Imaging<br />
of Faults<br />
Brouwer, Friso<br />
dGB Earth Sciences USA<br />
1 Sugar Creek Center Blvd, Suite 935<br />
Sugar L<strong>and</strong>, Texas 77478, USA<br />
email: friso.brouwer@dgbes.com<br />
Huck, Arnaud<br />
dGB Earth Sciences<br />
Nijverheidstraat 11-2<br />
7511 JM Enschede - The Netherl<strong>and</strong>s<br />
email: arnaud.huck@dgbes.com<br />
In the first part of this paper, we give an introduction<br />
in seismic attributes for fault detection to set<br />
the context to underst<strong>and</strong> imaging of faults with seismic<br />
attributes as an integrated workflow. Several wellknown<br />
attributes for discontinuity analysis are discussed:<br />
coherency, similarity, variance, <strong>and</strong> semblance.<br />
After discussing these attributes <strong>and</strong> their different representation<br />
of the seismic <strong>and</strong> geological<br />
characteristics of a dataset, we focus on the dip-steered<br />
similarity attribute.<br />
Abstract<br />
In the second part of the paper, we describe an<br />
integrated workflow to produce optimized discontinuity<br />
volumes for fault detection First we discuss several<br />
preprocessing options to op timize the data for the<br />
application of the discontinuity attribute. Second we<br />
show the effects of several parameter settings of the<br />
similarity attribute. Finally, we discuss the application<br />
of postattribute filters (filters applied to the discontinuity<br />
attribute) to demonstrate how the attribute image<br />
can be enhanced by improving the completeness, resolution,<br />
<strong>and</strong> contrast of the similarity attribute.<br />
Attributes: New Views on Seismic Imaging—Their Use in Exploration <strong>and</strong> Production 21
Analysis <strong>and</strong> Interpretation of Fracture Direction <strong>and</strong> Intensity from Full<br />
Azimuth Seismic Data<br />
Wang, Joanne<br />
email: joanne.wang@PDGM.com<br />
Dopkin, Duane<br />
Two Memorial Plaza<br />
820 Gessner, Suite 400<br />
Houston, Texas 77024<br />
Unconventional plays represent sources of<br />
opportunity for oil <strong>and</strong> gas companies <strong>and</strong> the global<br />
oil <strong>and</strong> ga s economy. Successful wells in s uch plays<br />
depend upon effective hydraulic fracture treatment<br />
design which requires the knowledge of in-situ stress,<br />
reservoir property, fracture presence, <strong>and</strong> reservoir<br />
pressure. Seismic data carry such information. A determining<br />
factor for in-situ stress <strong>and</strong> fracture<br />
determination is the azimuthal behavior of the seismic<br />
data <strong>and</strong> associated measurements made from these<br />
data. Properly processed, imaged, <strong>and</strong> inverted seismic<br />
Abstract<br />
data can be used to estimate stress intensity, stress orientation,<br />
<strong>and</strong> rock properties. In this paper, we discuss<br />
how technologies such as full-azimuth seismic decomposition<br />
<strong>and</strong> imaging, full-azimuth anisotropic velocity<br />
inversion, <strong>and</strong> full-azimuthal AVO inversion can be<br />
applied to characterize a Barnett Shale dataset. Th e<br />
results show areas of l ow <strong>and</strong> high stress intensity.<br />
These results, with other data, can be used to choose<br />
areas to drill, areas to a void, <strong>and</strong> preferred drilling<br />
directions based on mi nimum horizontal stress determinations.<br />
22 <strong>Program</strong> <strong>and</strong> <strong>Abstracts</strong>
A Robust <strong>and</strong> Compute-Efficient Variant of the Radon Transform<br />
Aarre, Victor<br />
Wallet, Bradley<br />
Schlumberger Information Solutions<br />
P.O. Box 8013<br />
N-4068 Stavanger<br />
Norway<br />
In 2003 AlBinHassan <strong>and</strong> Marfurt explained that<br />
the Hough transform can be used to detect fault lines in<br />
2D seismic data. Their conclusion was t hat “The<br />
Hough Transforms method is a good c<strong>and</strong>idate for<br />
enhancing lineaments associated with fractures <strong>and</strong><br />
faults.” But, they also observe that “the problem with<br />
the running window code is that the new code will be<br />
more sensitive to noise such that the image may not be<br />
as clear as we wish.” Another problematic issue with<br />
the windowed Hough transform, though not discussed<br />
in the AlBinHassan’s paper, is that the run-time is not<br />
very favorable for long operators (i.e., long line segments).<br />
In general, if an image contain m*n pixels, <strong>and</strong><br />
we search for line segments of length k, the runtime<br />
complexity will be in the order of m*n*k*k computational<br />
units. In practice, this means that if we double<br />
the scan line length, the run-time will be four times as<br />
long. Clearly, if we look for very long fault lines for<br />
every 2D section in a 3D seismic attribute volume, runtime<br />
will be an issue. The Hough transform is generally<br />
Abstract<br />
known to be very similar to the Radon transform (it can<br />
be convincingly argued they are equivalent), which in<br />
turn is closely related to the Fourier transform, so any<br />
issues observed with the Hough transform will have the<br />
same issues in a Radon- or Fourier-based approach,<br />
although Fourier can sometimes be more computationally<br />
efficient through the use of the FFT. We have over<br />
the last year tried to overcome these two problems for<br />
the windowed Hough tr ansform. Specifically, by<br />
improving the transform slightly <strong>and</strong> by calculating<br />
varying properties along the scanned line segments, we<br />
manage to make the approach more robust in the presence<br />
of r<strong>and</strong>om noise. We have also found a twist to the<br />
algorithm which makes the run-time linearly rather<br />
than fourth-power dependent on the line segment<br />
length, giving rise to an algorithm that can be applied<br />
to large seismic 3D volumes. In this paper, we present<br />
some of the theoretical details of how these two issues<br />
are solved, <strong>and</strong> also demonstrate the results on a 3D<br />
seismic dataset.<br />
Attributes: New Views on Seismic Imaging—Their Use in Exploration <strong>and</strong> Production 23
Automatic Fault Extraction in Hard <strong>and</strong> Soft Rock Environments<br />
Dorn, Geoffrey A., Ph.D.<br />
Kadlec, Benjamin, Ph.D.<br />
TerraSpark Geosciences L.L.C.<br />
2525 Arapahoe Ave.<br />
Unit E4, PMB 544<br />
Boulder, Colorado 80302<br />
Advanced fault imaging <strong>and</strong> automatic interpretation<br />
of faults was initially developed in the late<br />
1990s. Using a structural attribute such as coherence as<br />
input, the two most common approaches to automatic<br />
fault interpretation (AFE from TerraSpark Geosciences<br />
<strong>and</strong> Paradigm; Ant T racking from<br />
Schlumberger) use very different technologies to highlight<br />
faults imaged as discontinuities in the seismic<br />
data.<br />
The quality of fault imaging has improved substantially<br />
over the last ten years as algorithms have<br />
been refined <strong>and</strong> workflows have improved. Use of<br />
horizon orientation volumes (also called 3D dip volumes)<br />
has improved measures of discontinuity in a<br />
Abstract<br />
seismic volume. These discontinuity measures have<br />
been improved further by applying volumetric estimates<br />
of fault orientation. Fault probability volumes<br />
(for example as in AFE) have also been improved by<br />
the elimination of troublesome artifacts <strong>and</strong> by extending<br />
the algorithm’s ability to image lower angle,<br />
intersecting, <strong>and</strong> antithetic faults.<br />
Experience with fault imaging processes <strong>and</strong><br />
workflows in 3D seismic surveys from a variety of<br />
geologic environments has shown how input <strong>and</strong> control<br />
parameters can be adjusted to optimize the imaging<br />
<strong>and</strong> interpretation of faults with varying styles in both<br />
hard <strong>and</strong> soft rock environments.<br />
24 <strong>Program</strong> <strong>and</strong> <strong>Abstracts</strong>
Characterization of Vuggy Porosity <strong>and</strong> Fractures Using Poststack Seismic<br />
Attributes: Application to a Carbonate Reservoir<br />
Ouenes, Ahmed<br />
email: ouenes@prismseismic.com<br />
Aoues, Amares<br />
email: amares@prismseismic.com<br />
Prism Seismic<br />
6595 S Dayton St #2600<br />
Greenwood Village, Colorado 80111, USA<br />
Kirkham, Anthony<br />
Sedimentology & Reservoir Development<br />
Pen-yr-Allt, Village Road<br />
Nannerch, Mold<br />
Flintshire, Wales CH7 5RD, UK<br />
email: kirkhama@compuserve.com<br />
This paper describes a workflow that fully utilizes<br />
the poststack seismic attributes to derive reliable<br />
geologic <strong>and</strong> fracture models that are validated during<br />
the study with blind wells <strong>and</strong> actual wells drilled after<br />
the study. The first step in the workflow is to run poststack<br />
seismic processes, which includes volumetric<br />
curvature, high resolution poststack inversion, <strong>and</strong><br />
spectral imaging. The second step consists of using the<br />
various poststack seismic volumes to derive 3D geologic<br />
models constrained by multiple seismic<br />
attributes. The third step consists of using the various<br />
poststack seismic volumes <strong>and</strong> the derived geologic<br />
Abstract<br />
models to build predictive fracture models validated<br />
with wells not used during the modeling effort.<br />
This workflow was applied to a complex Paleocene<br />
fractured carbonate field in North Africa. A large<br />
number of poststack seismic attributes were generated<br />
in time <strong>and</strong> then depth converted within a 3D geocellular<br />
grid. These seismic attributes were used<br />
simultaneously to create geologic <strong>and</strong> fracture models.<br />
The resulting porosity <strong>and</strong> fracture density models<br />
were validated during the study with a blind well <strong>and</strong><br />
after the study with a newly drilled well.<br />
Attributes: New Views on Seismic Imaging—Their Use in Exploration <strong>and</strong> Production 25
Which Curvature is Right for You?<br />
Chopra, Satinder<br />
Arcis Corporation<br />
Calgary, AB Canada<br />
Marfurt, Kurt J.<br />
ConocoPhillips School of Geology <strong>and</strong> Geophysics<br />
The University of Oklahoma<br />
Norman, Oklahoma USA<br />
Since they are second-order derivatives, structural<br />
curvature attributes can enhance subtle<br />
information that may be difficult to see using firstorder<br />
structure derivative attributes, such as t he dip<br />
magnitude <strong>and</strong> the dip-azimuth. Structural curvature<br />
provides quantitative measures of quadratic shapes–<br />
domes, ridges, saddles, valleys, bowls, <strong>and</strong> if no deformation<br />
exists, planes. As a result, these attributes form<br />
an integral part of most seismic interpretation projects.<br />
In the 1760s, Leonhard Euler evaluated the apparent<br />
curvature of arbitrary slices through a cylinder. Since<br />
the finite strain associated with folds <strong>and</strong> flexures can<br />
give rise to fractures, one can compute the apparent (or<br />
what mathematicians now call “Euler”) curvature parallel<br />
to the axis of minimum horizontal stress for<br />
subsequent correlation with production data.<br />
Not all seismic surfaces are quadratic. Nonquadratic<br />
“shapes” of interest include angular unconformities,<br />
asymmetric syntectonic associated with salt<br />
Abstract<br />
withdrawal <strong>and</strong> faulting, channel-levee deposits, <strong>and</strong><br />
rotation of otherwise parallel reflectors about a fa ult.<br />
Such features of interest can be measured by secondderivative<br />
measurements based on t he mathematical<br />
rotation of reflector dip about or perpendicular to the<br />
locally averaged reflector normal.<br />
Finally, the formalism of volumetr ic structural<br />
curvature (<strong>and</strong> second-derivative attributes in general)<br />
can be extended to measurements more-directly sensitive<br />
to lithology: RMS amplitude, energy computed<br />
within a small analysis window, acoustic impedance,<br />
<strong>and</strong> other prestack inversion products. Such “amplitude<br />
curvature” volumes can enhance lateral changes in<br />
reflectivity associated with fault gauge zones <strong>and</strong><br />
infilled joints <strong>and</strong> cleats.<br />
We illustrate the value of these attributes through<br />
examples from Alberta, Canada, <strong>and</strong> the Midcontinent,<br />
U.S.A.<br />
26 <strong>Program</strong> <strong>and</strong> <strong>Abstracts</strong>
Developing an Exploration Tool in a Mature Trend: A 3D AVO Case Study in<br />
South Texas 1<br />
Gregg, Mark E. 2<br />
Bukowski, Charles T., Jr. 3<br />
Edge Petroleum Corporation<br />
Houston, Texas<br />
2 Currently with Kiwi Energy, Houston, Texas<br />
email: markg@kiwienergy.com<br />
3 Currently with Beachcomber O&G, Cypress, Texas<br />
email: cbukowskijr@yahoo.com<br />
Abstract<br />
If at first you don’t succeed, try something<br />
unconventional. Successful exploration for new reservoirs<br />
in mature trends often requires trying techniques<br />
unproved in the area. In a mature play onshore <strong>Gulf</strong> of<br />
Mexico, our initial exploration campaign with conventional<br />
3D seismic was disappointing. However,<br />
attention to rock properties, coupled with application of<br />
a novel processing technique, allowed us to develop a<br />
solution to our dilemma.<br />
1. First published in the November 2000 issue of<br />
The Leading Edge. Reprinted with permission<br />
by the Society of Exploration Geophysicists.<br />
Attributes: New Views on Seismic Imaging—Their Use in Exploration <strong>and</strong> Production 27
Seismic Acoustic Impedance: An Indicator for Deep-Water Depositional<br />
Processes<br />
Chen, Jiajie (Jeff)<br />
Marathon Oil Corporation<br />
P.O. Box 3128<br />
Houston, Texas 77253<br />
email: jchen@marathonoil.com<br />
Deep-water siliciclastic s<strong>and</strong>s have been deposited<br />
in p elagic basins by ac cumulations of epigenic<br />
clastic materials carried by turbidite flows from shelf<br />
or slope margins. The classic sequence stratigraphy<br />
model calls for the existence of basin-floor fans deposited<br />
during the lowst<strong>and</strong> systems tract (LST) within the<br />
depositional profile; however, alternative models suggest<br />
that turbidite sedimentation is limited to the slope<br />
area. The question that needs to be answered is that if<br />
there are indeed basin-floor fans, what is the depositional<br />
process controlling the formation of these fans,<br />
<strong>and</strong> where can one find reservoir s<strong>and</strong>s within these<br />
fans. This paper discusses processes controlling the<br />
deposition of deep-water turbidite s<strong>and</strong>s, <strong>and</strong> presents a<br />
case study in which seismic acoustic impedance data<br />
are used to reveal the deep-water depositional processes.<br />
These data suggest that the deposition of<br />
reservoir s<strong>and</strong>s is accomplished by two ma jor processes—downlapping<br />
<strong>and</strong> backstepping, as revealed by<br />
Abstract<br />
the analysis of seismic acoustic impedance volumes,<br />
<strong>and</strong> the subsequent integration of additional geosciences<br />
<strong>and</strong> engineering analysis. Backstepping s<strong>and</strong><br />
bodies are associated with sea-level rising stages (corresponding<br />
to the LST), while downlapping processes<br />
are associated with sea-level retreat stages (corresponding<br />
to the highst<strong>and</strong> systems tract, or HST). The<br />
resultant depositional model allows one to successfully<br />
predict the occurrence of reservoir s<strong>and</strong>s during development<br />
drilling. The m odel also provides useful<br />
guidance for deep-water exploration <strong>and</strong> expl oitation<br />
that can be tested. These classic sequence stratigraphic<br />
concepts can be used to construct a chronostratigraphic<br />
framework. By applying advanced seismic technology,<br />
detailed lithostratigraphic correlation within each thirdor<br />
fourth-order sequence can be performed to characterize<br />
the patterns of flow unit distribution, effectively<br />
enhancing the results of deep-water exploration <strong>and</strong><br />
exploitation, especially in the frontier areas.<br />
28 <strong>Program</strong> <strong>and</strong> <strong>Abstracts</strong>
A Seismic Reservoir Characterization Work Flow for Reducing Risk Utilizing<br />
AVO, Simultaneous Prestack Inversion, <strong>and</strong> Rock Physics<br />
Leiceaga, Gorka Garcia<br />
Schlumberger<br />
T2P 0G4 Calgary<br />
Canada<br />
email: ggarcia23@slb.com<br />
Berhanu, Solomon Assefa<br />
Schlumberger<br />
50450 Kuala Lumpur<br />
Malaysia<br />
Vargas, Africa Jimenez<br />
Schlumberger<br />
86035 Villahermosa<br />
Mexico<br />
Silva, Josimar<br />
Schlumberger<br />
20030-021 Rio de Janeiro<br />
Brazil<br />
Zhang, Lei<br />
Ng, David<br />
Schlumberger<br />
Houston, Texas 77042<br />
United States<br />
Sanz, Carlos<br />
Schlumberger<br />
86035 Villahermosa<br />
Mexico<br />
In this paper, an integrated seismic-based reservoir<br />
characterization work f low is presented which<br />
includes fluid substitution, AVO modeling, prestack<br />
simultaneous inversion, <strong>and</strong> lithology <strong>and</strong> petrophysical<br />
property prediction. Forward modeling is normally<br />
the most effective way to commence an AVO analysis,<br />
which begins with determining the fluid response by<br />
calculating seismic velocity <strong>and</strong> offset-dependant<br />
reflectivity changes due to different fluid saturations.<br />
The investigation of amplitude variations with offset<br />
seeks to extract information about the reservoir rock by<br />
measuring changes in amplitude with varying incident<br />
angle. Next, the seismic data are analyzed in order to<br />
determine whether a conditioning process must be<br />
implemented to extract the most out of the seismic<br />
Abstract<br />
data. The aim is to preserve the AVO response while<br />
flattening events as much as possible as well as adequately<br />
attenuating noise without generating artifacts.<br />
Prestack simultaneous AVO inversion follows seismic<br />
conditioning, where the data are converted from interface<br />
properties to layer properties by the use of a global<br />
optimization algorithm with a nonlinear cost function<br />
to simultaneously invert a number of input stacks to an<br />
earth model. The final process in the characterization<br />
work flow is de termining a spatial distribution of<br />
lithology <strong>and</strong> petrophysical properties based on rock<br />
physics <strong>and</strong> Bayesian statistics using the acoustic <strong>and</strong><br />
elastic output volumes from the simultaneous inversion.<br />
Attributes: New Views on Seismic Imaging—Their Use in Exploration <strong>and</strong> Production 29
3D Seismic Curvature <strong>and</strong> Curvature Gradient for Fractured Reservoir<br />
Characterization at Teapot Dome (Wyoming)<br />
Gao, Dengliang 1,2<br />
Wilson, Tom 1,2<br />
Zhu, Lierong 1,2<br />
1 US Department of Energy/National Energy <br />
Technology Laboratory<br />
Morgantown, West Virginia 26507<br />
2 Department of Geology <strong>and</strong> Geography<br />
West Virginia University<br />
Morgantown, West Virginia 26506<br />
Marfurt, Kurt<br />
ConocoPhillips School of Geology <strong>and</strong> Geophysics<br />
Mewbourne College of Earth <strong>and</strong> Energy<br />
The University of Oklahoma<br />
Norman, Oklahoma 73019<br />
Curvature is a p opular attribute that has been<br />
widely used to de lineate faults <strong>and</strong> f racture zones in<br />
seismic structural interpretation; however, our observations<br />
from 3D prestack, depth-migrated seismic data at<br />
Teapot Dome (Wyoming) indicate that many faults do<br />
not correlate with any curvature anomalies, while many<br />
curvature anomalies do not correlate to any f aults.<br />
Instead, the major faults are typically located at the<br />
maximum absolute gradient of curvature. Inspired by<br />
these observations, we extend the curvature algorithm<br />
<strong>and</strong> construct a new curvature gradient algorithm by<br />
calculating the maximum change in curvature along the<br />
bedding. We then extract both maximum curvature <strong>and</strong><br />
maximum curvature gradient attributes to describe the<br />
Teapot Dome fractured reservoirs. Our results indicate<br />
that the maximum absolute curvature gradient is more<br />
descriptive of the northeast-trending transfer faults <strong>and</strong><br />
the northwest-trending thrust faults that are seismically<br />
Abstract<br />
visible; whereas the maximum curvature is more<br />
descriptive of the folded but unfaulted crestal portion<br />
of anticlines. These observations from seismic data,<br />
along with image logs, cores, <strong>and</strong> outcrops reported<br />
from previous studies, lead to our interpretation that<br />
curvature may be more indicative of tensile fractures<br />
whereas curvature gradient may be more indicative of<br />
shear fractures. Although tensile fractures can be<br />
directly observed on image logs, cores, <strong>and</strong> outcrops,<br />
they usually fall below the limit of seismic resolution.<br />
In contrast, shear faults give rise to significant offset of<br />
reflectors such that they are easily recognizable on<br />
seismic images. We propose using a combination of<br />
curvature <strong>and</strong> curvature gradient attributes for discriminating<br />
reservoir fracture facies (tensile versus shear<br />
fractures), evaluating reservoir storage capacity <strong>and</strong><br />
caprock integrity, <strong>and</strong> modeling reservoir fracture networks<br />
at Teapot Dome.<br />
30 <strong>Program</strong> <strong>and</strong> <strong>Abstracts</strong>
Facies Probabilities from Multidimensional Crossplots of Seismic<br />
Attributes: Applications to Jonah <strong>and</strong> Mamm Creek Tight Gas Fields<br />
Michelena, Reinaldo J.<br />
Godbey, Kevin S.<br />
Rodrigues, Patricia E.<br />
iReservoir.com, Inc<br />
1490 W Canal Court, #2000<br />
Littleton, Colorado 80129<br />
We propose a simple method to estimate facies<br />
probabilities based on st atistical analysis of multidimensional<br />
crossplots of seismic attributes. Log scale<br />
facies flags related to thick s<strong>and</strong> bodies are created<br />
using petrophysics <strong>and</strong> rock physics analyses. These<br />
flags are then used to color crossplots of seismic scale<br />
attributes derived from AVO inversion of PP data (V P ,<br />
V S , <strong>and</strong> density) <strong>and</strong> i nversion of poststack fast <strong>and</strong><br />
slow PS components of a 3C-3D survey. We show that<br />
Abstract<br />
by using these five seismic attributes <strong>and</strong> facies flags<br />
(like a colored five-dimensional crossplot), we can estimate<br />
the probability of thick s<strong>and</strong> bodies much better<br />
than when we crossplot two attributes at a time. Unlike<br />
commonly used approaches to map facies or lithologies<br />
from seismic data based on selecting regions in seismic<br />
attribute crossplots, our approach accounts properly for<br />
overlap among different facies <strong>and</strong> quantifies the probability<br />
of their occurrence.<br />
Attributes: New Views on Seismic Imaging—Their Use in Exploration <strong>and</strong> Production 31
Overview of Seismic Attribute Analysis in Shale Plays<br />
Schuelke, James S.<br />
Devon Energy Corporation<br />
1200 Smith Street<br />
Houston, Texas 77002<br />
Unconventional shale gas <strong>and</strong> shale oil plays<br />
have jumped into the spotlight over the last several<br />
years <strong>and</strong> appear to be t he future of o ur business, at<br />
least in the U.S. (James Baker Institute for Public Policy,<br />
Rice University, 2011). These new plays are the<br />
catalyst for much of the new developments in geophysics<br />
<strong>and</strong> especially for the use of new seismic attributes.<br />
In the past, geophysical methods in sha le plays have<br />
been used primarily to underst<strong>and</strong> the depth <strong>and</strong> thickness<br />
of the reservoir <strong>and</strong> to avoid possible completion<br />
hazards caused by karsting <strong>and</strong> faulting. More recently,<br />
3D seismic data <strong>and</strong> attribute technologies have supplied<br />
information on localized stress, fault/fracture<br />
Abstract<br />
orientation <strong>and</strong> density, reservoir sweet spots, possible<br />
hydraulic fracture barriers, pore pressure, rock <strong>and</strong><br />
mechanical properties, <strong>and</strong> stimulation effectiveness<br />
<strong>and</strong> optimization. I wi ll present the information that<br />
can be obtained from 3D surface seismic data <strong>and</strong> how<br />
it can impact the development of these unconventional<br />
plays. I will limit the scope of the paper to the conventional<br />
surface seismic methods. My investigation will<br />
include the use of azimuthal velocity <strong>and</strong> amplitude<br />
attributes, geometric attributes, simultaneous inversion<br />
for rock <strong>and</strong> mechanical properties, <strong>and</strong> calibration of<br />
the seismic attributes to log <strong>and</strong> production data.<br />
32 <strong>Program</strong> <strong>and</strong> <strong>Abstracts</strong>
Stratigraphic Analysis in Carbonate Zones: An Investigation Using 3D<br />
Seismic Analysis Techniques on an Offshore UAE Field<br />
Avu, Anthony<br />
Paton, Gaynor<br />
ffA<br />
The Excel Centre, Suite e3<br />
Aberdeen Science <strong>and</strong> Energy Park<br />
Exploration Drive, Bridge of Don<br />
Aberdeen, AB23 8HZ, UK<br />
Van Kleef, Frank<br />
Dubai Petroleum<br />
Al Safa Street 334/309<br />
PO Box 2222<br />
Dubai<br />
UAE<br />
Carbonate reservoirs in the Arabian <strong>Gulf</strong> are<br />
complex integrated systems which are often hard to<br />
interpret. The identification of pi nch-outs <strong>and</strong> buildups<br />
is further complicated by poo r data quality. We<br />
present the results of applying 3D seismic analysis<br />
techniques to create attribute <strong>and</strong> geobody volumes<br />
which provide insight into the stratigraphy at the reservoir<br />
level of a producing field, offshore UAE.<br />
This investigation focuses on the middle Cretaceous<br />
Mishrif reef build-ups which form major<br />
reservoirs <strong>and</strong> were controlled by localized salt diapirism<br />
<strong>and</strong> a ssociated bathymetric variations. A good<br />
underst<strong>and</strong>ing of the geomorphological evolution as<br />
well as t he structural <strong>and</strong> s tratigraphic properties of<br />
these formations is crucial in de fining reservoir<br />
properties.<br />
The work flow applied to the data was split into<br />
two sections: data conditioning <strong>and</strong> stratigraphic analysis.<br />
The post stack depth-migrated seismic data were<br />
Abstract<br />
dominated by steeply dipping coherent noise. Application<br />
of structurally oriented edge preserving filters as<br />
well as spectral enhancement successfully attenuated<br />
the noise <strong>and</strong> provided a high resolution input dataset<br />
for the remaining work flows. Identification of a prograding<br />
rudist reef with associated clinoform features<br />
as well as pinch-outs formed from the truncation of the<br />
reef by the Mishrif erosional surface was achieved by<br />
use of a bed-form attribute which identified individual<br />
reflectivity events by isolating constant phase events. A<br />
combination of the bed-form attribute with the instantaneous<br />
frequency was used to create an attribute for<br />
the analysis <strong>and</strong> extraction of stratigraphic clinoforms,<br />
pinchouts formed from truncations, <strong>and</strong> onlapping <strong>and</strong><br />
downlapping events. Extraction of potential pinchout<br />
features as geobodies enabled their lateral extent <strong>and</strong><br />
shape to be easily visualized <strong>and</strong> analyzed throughout<br />
the area.<br />
Attributes: New Views on Seismic Imaging—Their Use in Exploration <strong>and</strong> Production 33
Eagle Ford Exploration <strong>and</strong> Development—The Application of Regional<br />
Geology <strong>and</strong> Geophysical Technologies<br />
Treadgold, Galen<br />
McLain, Bill<br />
Royer, Ted<br />
Peebles, Ross<br />
Global Geophysical Services<br />
13927 S. Gessner Rd.<br />
Missouri City, Texas 77489<br />
email: Ross.Peebles@GlobalGeophysical.com<br />
Sinclair, Steven<br />
Nicklin, David<br />
Matador Resources Company<br />
Abstract<br />
The Eagle Ford Shale in South Texas is one of<br />
the more exciting shale plays in the United States at the<br />
current time. Recently published reports of well tests<br />
describe initial gas well rates exceeding 17 MMcf/d<br />
<strong>and</strong> initial oil well rates in excess of 2000 BOPD. Acreage<br />
lease rates continue to climb as additional positive<br />
results come from drilling within the trend. A key issue<br />
for the exploration companies is finding where to focus<br />
acreage acquisition <strong>and</strong> optimize drilling plans for optimal<br />
gas <strong>and</strong> oil recovery. This review first considers<br />
the geologic context of the Eagle Ford <strong>and</strong> then examines<br />
at the geologic drivers for locating economic<br />
producing wells. With improved underst<strong>and</strong>ing of local<br />
rock properties, our focus shifts to geophysical techniques,<br />
in particular, comparing <strong>and</strong> contrasting the<br />
value of seismic attributes in building a s uccessful<br />
exploration <strong>and</strong> development plan.<br />
34 <strong>Program</strong> <strong>and</strong> <strong>Abstracts</strong>
Author Index<br />
A<br />
Aarre, Victor, 23<br />
Adeyemi, A., 11<br />
Aoues, Amares, 25<br />
Avu, Anthony, 33<br />
B<br />
Barnes, Arthur E., 4<br />
Basford, Helen, 5, 9<br />
Berhanu, Solomon Assefa, 29<br />
Braccini, E., 11<br />
Brouwer, Friso C. G., 19, 21<br />
Bukowski, Charles T., Jr., 27<br />
C<br />
Carlson, James, 6<br />
Chatila, Eric, 16<br />
Chen, Jiajie (Jeff), 28<br />
Chopra, Satinder, 26<br />
Connolly, David, 19<br />
Corrao, Antonio, 3<br />
D<br />
Davogustto, Oswaldo, 1<br />
Dopkin, Duane, 22<br />
Dorn, Geoffrey A., 7, 24<br />
E<br />
Elabed, Dorra, 16<br />
F<br />
Fervari, Massimo, 3<br />
Fomel, Sergey, 10<br />
Furniss, Andrew, 16<br />
G<br />
Galbiati, Mauro, 3<br />
Gao, Dengliang, 30<br />
Godbey, Kevin S., 31<br />
Greene, D. Lawrence, 13<br />
Gregg, Mark E., 27<br />
H<br />
Hami-Eddine, Kamal, 16<br />
Henning, Alison, 14<br />
Huck, Arnaud, 21<br />
J<br />
James, Huw, 8<br />
K<br />
Kadlec, Benjamin, 6, 24<br />
Kirkham, Anthony, 25<br />
Klein, Pascal, 16<br />
Kostrova, Tatyana, 8<br />
Kristensen, Trond, 9<br />
L<br />
Leiceaga, Gorka Garcia, 29<br />
Lowell, James, 9, 17<br />
M<br />
Marbach, Jonathan, 6<br />
Marfurt, Kurt J., 1, 18, 26, 30<br />
Matos, Marcilio M. Castro de, 18<br />
McArdle, Nicholas, 9<br />
McLain, Bill, 34<br />
Michelena, Reinaldo J., 31<br />
N<br />
Ng, David, 29<br />
Nicklin, David, 34<br />
Norton, Dale, 9<br />
O<br />
Ouenes, Ahmed, 25<br />
P<br />
Paton, Gaynor, 14, 17, 33<br />
Peebles, Ross, 34<br />
Perz, Mike, 10<br />
Purves, Steve, 5, 9, 17<br />
Attributes: New Views on Seismic Imaging—Their Use in Exploration <strong>and</strong> Production A-1
R<br />
Ragoza, Evgeny, 8<br />
Richard, Loic, 16<br />
Rodrigues, Patricia E., 31<br />
Roy, Atish, 18<br />
Royer, Ted, 34<br />
S<br />
Sanz, Carlos, 29<br />
Schuelke, James S., 32<br />
Shrestha, Rajendra K., 13<br />
Silva, Josimar, 29<br />
Sinclair, Steven, 34<br />
Singleton, Scott, 2<br />
Sutton, Katy, 17<br />
T<br />
Tingahl, Kristofer, 19<br />
Treadgold, Galen, 34<br />
V<br />
Van der Baan, Mirko, 10<br />
Van Kleef, Frank, 33<br />
Vargas, Africa Jimenez, 29<br />
W<br />
Wallet, Bradley, 23<br />
Wang, Joanne, 22<br />
Wen, Renjun, 20<br />
Wilson, Tom, 30<br />
Z<br />
Zeng, Hongliu, 12<br />
Zhang, Lei, 29<br />
Zhu, Lierong, 30<br />
A-2 <strong>Program</strong> <strong>and</strong> <strong>Abstracts</strong>