Farm households and land use in a core conservation zone of the ...
Farm households and land use in a core conservation zone of the ...
Farm households and land use in a core conservation zone of the ...

Create successful ePaper yourself
Turn your PDF publications into a flip-book with our unique Google optimized e-Paper software.
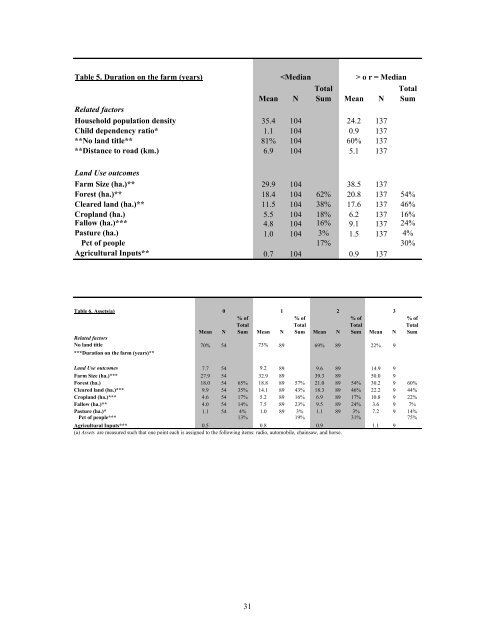
Table 5. Duration on <strong>the</strong> farm (years) o r = Median % <strong>of</strong><br />
Total<br />
Total<br />
Mean N Sum Mean N Sum<br />
Related factors<br />
Ho<strong>use</strong>hold population density 35.4 104 24.2 137<br />
Child dependency ratio* 1.1 104 0.9 137<br />
**No l<strong>and</strong> title** 81% 104 60% 137<br />
**Distance to road (km.) 6.9 104 5.1 137<br />
L<strong>and</strong> Use outcomes<br />
<strong>Farm</strong> Size (ha.)** 29.9 104 38.5 137<br />
Forest (ha.)** 18.4 104 62% 20.8 137 54%<br />
Cleared l<strong>and</strong> (ha.)** 11.5 104 38% 17.6 137 46%<br />
Cropl<strong>and</strong> (ha.) 5.5 104 18% 6.2 137 16%<br />
Fallow (ha.)*** 4.8 104 16% 9.1 137 24%<br />
Pasture (ha.) 1.0 104 3% 1.5 137 4%<br />
Pct <strong>of</strong> people 17% 30%<br />
Agricultural Inputs** 0.7 104 0.9 137<br />
Table 6. Assets(a) 0 1 2 3<br />
Mean N<br />
% <strong>of</strong><br />
Total<br />
Sum Mean N<br />
% <strong>of</strong><br />
Total<br />
Sum Mean N<br />
% <strong>of</strong><br />
Total<br />
Sum Mean N<br />
Related factors<br />
No l<strong>and</strong> title 70% 54 73% 89 69% 89 22% 9<br />
***Duration on <strong>the</strong> farm (years)**<br />
% <strong>of</strong><br />
Total<br />
Sum<br />
L<strong>and</strong> Use outcomes 7.7 54 9.2 89 9.6 89 14.9 9<br />
<strong>Farm</strong> Size (ha.)*** 27.9 54 32.9 89 39.3 89 50.0 9<br />
Forest (ha.) 18.0 54 65% 18.8 89 57% 21.0 89 54% 30.2 9 60%<br />
Cleared l<strong>and</strong> (ha.)*** 9.9 54 35% 14.1 89 43% 18.3 89 46% 22.2 9 44%<br />
Cropl<strong>and</strong> (ha.)*** 4.6 54 17% 5.2 89 16% 6.9 89 17% 10.8 9 22%<br />
Fallow (ha.)** 4.0 54 14% 7.5 89 23% 9.5 89 24% 3.6 9 7%<br />
Pasture (ha.)* 1.1 54 4% 1.0 89 3% 1.1 89 3% 7.2 9 14%<br />
Pct <strong>of</strong> people*** 13% 19% 31% 75%<br />
Agricultural Inputs*** 0.5 0.8 0.9 1.1 9<br />
(a) Assets are measured such that one po<strong>in</strong>t each is assigned to <strong>the</strong> follow<strong>in</strong>g items: radio, automobile, cha<strong>in</strong>saw, <strong>and</strong> horse.<br />
31