

Disaster Risk Management in Central America: GFDRR Country Notes
Disaster Risk Management in Central America: GFDRR Country Notes
Disaster Risk Management in Central America: GFDRR Country Notes

Create successful ePaper yourself
Turn your PDF publications into a flip-book with our unique Google optimized e-Paper software.
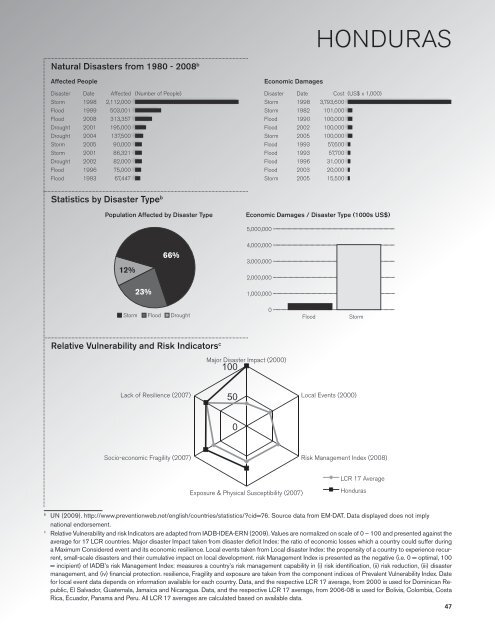
Natural <strong>Disaster</strong>s from 1980 - 2008 b<br />
Affected People<br />
Economic Damages<br />
honduras<br />
Colombia<br />
<strong>Disaster</strong> Date Affected (Number of People)<br />
Storm 1998 2,112,000<br />
Flood 1999 503,001<br />
Flood 2008 313,357<br />
Drought 2001 195,000<br />
Drought 2004 137,500<br />
Storm 2005 90,000<br />
Storm 2001 86,321<br />
Drought 2002 82,000<br />
Flood 1996 75,000<br />
Flood 1993 67,447<br />
<strong>Disaster</strong> Date Cost (US$ x 1,000)<br />
Storm 1998 3,793,600<br />
Storm 1982 101,000<br />
Flood 1990 100,000<br />
Flood 2002 100,000<br />
Storm 2005 100,000<br />
Flood 1993 57,600<br />
Flood 1993 57,700<br />
Flood 1996 31,000<br />
Flood 2003 20,000<br />
Storm 2005 15,500<br />
Statistics by <strong>Disaster</strong> Type b<br />
Population Affected by <strong>Disaster</strong> Type<br />
Economic Damages / <strong>Disaster</strong> Type (1000s US$)<br />
5,000,000<br />
12%<br />
23%<br />
66%<br />
4,000,000<br />
3,000,000<br />
2,000,000<br />
1,000,000<br />
0<br />
Storm Flood Drought Flood Storm<br />
Relative Vulnerability and <strong>Risk</strong> Indicators c<br />
Major <strong>Disaster</strong> Impact (2000)<br />
100<br />
Lack of Resilience (2007)<br />
50<br />
Local Events (2000)<br />
0<br />
Socio-economic Fragility (2007)<br />
<strong>Risk</strong> <strong>Management</strong> Index (2008)<br />
LCR 17 Average<br />
Exposure & Physical Susceptibility (2007)<br />
Honduras<br />
b<br />
UN (2009). http://www.preventionweb.net/english/countries/statistics/?cid=76. Source data from EM-DAT. Data displayed does not imply<br />
national endorsement.<br />
c<br />
Relative Vulnerability and risk Indicators are adapted from IADB-IdeA-ern (2009). Values are normalized on scale of 0 – 100 and presented aga<strong>in</strong>st the<br />
average for 17 LCR countries. Major disaster Impact taken from disaster deficit Index: the ratio of economic losses which a country could suffer dur<strong>in</strong>g<br />
a Maximum Considered event and its economic resilience. Local events taken from Local disaster Index: the propensity of a country to experience recurrent,<br />
small-scale disasters and their cumulative impact on local development. risk <strong>Management</strong> Index is presented as the negative (i.e. 0 = optimal, 100<br />
= <strong>in</strong>cipient) of IADB’s risk <strong>Management</strong> Index: measures a country’s risk management capability <strong>in</strong> (i) risk identification, (ii) risk reduction, (iii) disaster<br />
management, and (iv) f<strong>in</strong>ancial protection. resilience, Fragility and exposure are taken from the component <strong>in</strong>dices of Prevalent Vulnerability Index. Date<br />
for local event data depends on <strong>in</strong>formation available for each country. Data, and the respective LCR 17 average, from 2000 is used for Dom<strong>in</strong>ican Republic,<br />
El Salvador, Guatemala, Jamaica and Nicaragua. Data, and the respective LCR 17 average, from 2006-08 is used for Bolivia, Colombia, Costa<br />
Rica, Ecuador, Panama and Peru. All LCR 17 averages are calculated based on available data.<br />
47


