PRISM_DescriptionOfTools.pdf - GHDonline
PRISM_DescriptionOfTools.pdf - GHDonline
PRISM_DescriptionOfTools.pdf - GHDonline

You also want an ePaper? Increase the reach of your titles
YUMPU automatically turns print PDFs into web optimized ePapers that Google loves.
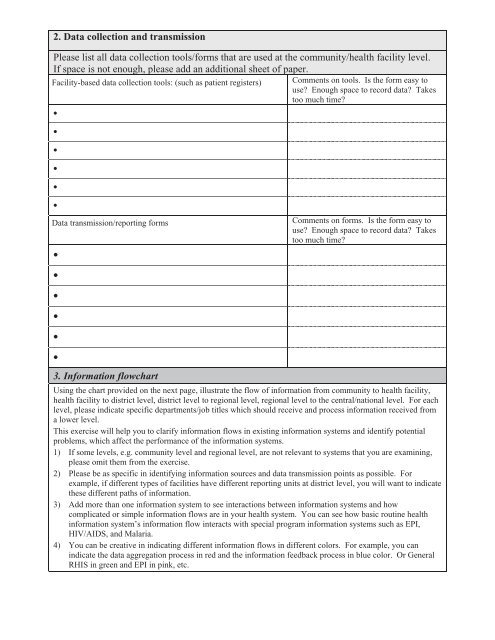
2. Data collection and transmission<br />
Please list all data collection tools/forms that are used at the community/health facility level.<br />
If space is not enough, please add an additional sheet of paper.<br />
Facility-based data collection tools: (such as patient registers)<br />
•<br />
•<br />
•<br />
•<br />
•<br />
Comments on tools. Is the form easy to<br />
use? Enough space to record data? Takes<br />
too much time?<br />
•<br />
Data transmission/reporting forms<br />
•<br />
Comments on forms. Is the form easy to<br />
use? Enough space to record data? Takes<br />
too much time?<br />
•<br />
•<br />
•<br />
•<br />
•<br />
3. Information flowchart<br />
Using the chart provided on the next page, illustrate the flow of information from community to health facility,<br />
health facility to district level, district level to regional level, regional level to the central/national level. For each<br />
level, please indicate specific departments/job titles which should receive and process information received from<br />
a lower level.<br />
This exercise will help you to clarify information flows in existing information systems and identify potential<br />
problems, which affect the performance of the information systems.<br />
1) If some levels, e.g. community level and regional level, are not relevant to systems that you are examining,<br />
please omit them from the exercise.<br />
2) Please be as specific in identifying information sources and data transmission points as possible. For<br />
example, if different types of facilities have different reporting units at district level, you will want to indicate<br />
these different paths of information.<br />
3) Add more than one information system to see interactions between information systems and how<br />
complicated or simple information flows are in your health system. You can see how basic routine health<br />
information system’s information flow interacts with special program information systems such as EPI,<br />
HIV/AIDS, and Malaria.<br />
4) You can be creative in indicating different information flows in different colors. For example, you can<br />
indicate the data aggregation process in red and the information feedback process in blue color. Or General<br />
RHIS in green and EPI in pink, etc.<br />
4-19<br />
<strong>PRISM</strong> Tools Version 3.1.<br />
June 2008