Comprehensive Annual Financial Report - Harford County Public ...
Comprehensive Annual Financial Report - Harford County Public ...
Comprehensive Annual Financial Report - Harford County Public ...

You also want an ePaper? Increase the reach of your titles
YUMPU automatically turns print PDFs into web optimized ePapers that Google loves.
<strong>Harford</strong> <strong>County</strong> <strong>Public</strong> Schools<br />
Management's Discussion and Analysis (MD&A)<br />
June 30, 2012<br />
District-wide <strong>Financial</strong> Analysis<br />
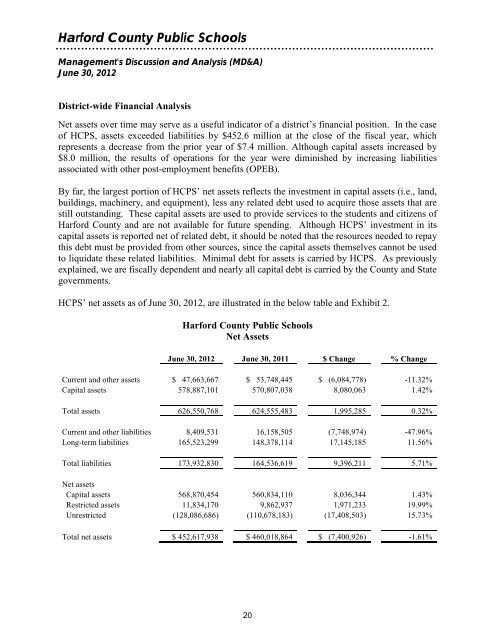
Net assets over time may serve as a useful indicator of a district’s financial position. In the case<br />
of HCPS, assets exceeded liabilities by $452.6 million at the close of the fiscal year, which<br />
represents a decrease from the prior year of $7.4 million. Although capital assets increased by<br />
$8.0 million, the results of operations for the year were diminished by increasing liabilities<br />
associated with other post-employment benefits (OPEB).<br />
By far, the largest portion of HCPS’ net assets reflects the investment in capital assets (i.e., land,<br />
buildings, machinery, and equipment), less any related debt used to acquire those assets that are<br />
still outstanding. These capital assets are used to provide services to the students and citizens of<br />
<strong>Harford</strong> <strong>County</strong> and are not available for future spending. Although HCPS’ investment in its<br />
capital assets is reported net of related debt, it should be noted that the resources needed to repay<br />
this debt must be provided from other sources, since the capital assets themselves cannot be used<br />
to liquidate these related liabilities. Minimal debt for assets is carried by HCPS. As previously<br />
explained, we are fiscally dependent and nearly all capital debt is carried by the <strong>County</strong> and State<br />
governments.<br />
HCPS’ net assets as of June 30, 2012, are illustrated in the below table and Exhibit 2.<br />
<strong>Harford</strong> <strong>County</strong> <strong>Public</strong> Schools<br />
Net Assets<br />
June 30, 2012 June 30, 2011 $ Change % Change<br />
Current and other assets $ 47,663,667 $ 53,748,445 $ (6,084,778) -11.32%<br />
Capital assets 578,887,101 570,807,038 8,080,063 1.42%<br />
Total assets 626,550,768 624,555,483 1,995,285 0.32%<br />
Current and other liabilities 8,409,531 16,158,505 (7,748,974) -47.96%<br />
Long-term liabilities 165,523,299 148,378,114 17,145,185 11.56%<br />
Total liabilities 173,932,830 164,536,619 9,396,211 5.71%<br />
Net assets<br />
Capital assets 568,870,454 560,834,110 8,036,344 1.43%<br />
Restricted assets 11,834,170 9,862,937 1,971,233 19.99%<br />
Unrestricted (128,086,686) (110,678,183) (17,408,503) 15.73%<br />
Total net assets $ 452,617,938 $ 460,018,864 $ (7,400,926) -1.61%<br />
20