Development of Assist Strain Ratio for the Strain Ratio Measurement ...
Development of Assist Strain Ratio for the Strain Ratio Measurement ...
Development of Assist Strain Ratio for the Strain Ratio Measurement ...

You also want an ePaper? Increase the reach of your titles
YUMPU automatically turns print PDFs into web optimized ePapers that Google loves.
Authorized translation from:<br />
Baba H, et al. : <strong>Development</strong> <strong>of</strong> <strong>the</strong> FLR <strong>Assist</strong>ance <strong>for</strong> <strong>the</strong> <strong>Strain</strong> <strong>Ratio</strong> <strong>Measurement</strong> in Breast Elastography. MEDIX 58, 42-45, 2013 (in Japanese) .<br />
Technical Report<br />
<strong>Development</strong> <strong>of</strong> <strong>Assist</strong> <strong>Strain</strong> <strong>Ratio</strong> <strong>for</strong><br />
<strong>the</strong> <strong>Strain</strong> <strong>Ratio</strong> <strong>Measurement</strong> in Breast Elastography<br />
Hirotaka Baba<br />
Kouji Waki<br />
Naoyuki Murayama<br />
Takashi Iimura<br />
Yusuke Miyauchi<br />
Hitachi Aloka Medical, Ltd. Medical Systems Engineering Division<br />
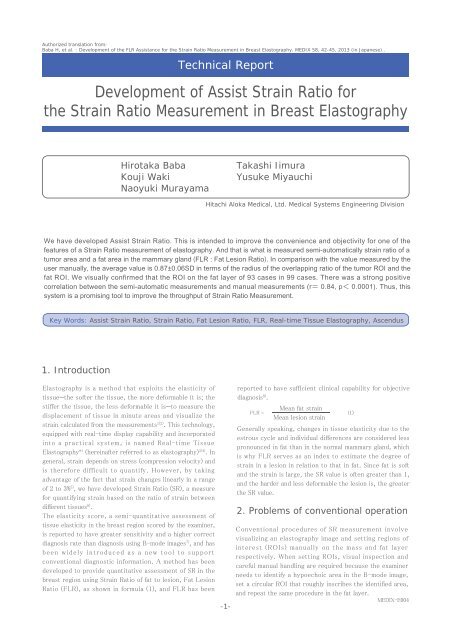
We have developed <strong>Assist</strong> <strong>Strain</strong> <strong>Ratio</strong>. This is intended to improve <strong>the</strong> convenience and objectivity <strong>for</strong> one <strong>of</strong> <strong>the</strong><br />
features <strong>of</strong> a <strong>Strain</strong> <strong>Ratio</strong> measurement <strong>of</strong> elastography. And that is what is measured semi-automatically strain ratio <strong>of</strong> a<br />
tumor area and a fat area in <strong>the</strong> mammary glandFLR : Fat Lesion <strong>Ratio</strong>. In comparison with <strong>the</strong> value measured by <strong>the</strong><br />
user manually, <strong>the</strong> average value is 0.87±0.06SD in terms <strong>of</strong> <strong>the</strong> radius <strong>of</strong> <strong>the</strong> overlapping ratio <strong>of</strong> <strong>the</strong> tumor ROI and <strong>the</strong><br />
fat ROI. We visually confirmed that <strong>the</strong> ROI on <strong>the</strong> fat layer <strong>of</strong> 93 cases in 99 cases. There was a strong positive<br />
correlation between <strong>the</strong> semi-automatic measurements and manual measurements (r 0.84, p 0.0001). Thus, this<br />
system is a promising tool to improve <strong>the</strong> throughput <strong>of</strong> <strong>Strain</strong> <strong>Ratio</strong> <strong>Measurement</strong>.<br />
Key Words: <strong>Assist</strong> <strong>Strain</strong> <strong>Ratio</strong>, <strong>Strain</strong> <strong>Ratio</strong>, Fat Lesion <strong>Ratio</strong>, FLR, Real-time Tissue Elastography, Ascendus<br />
1. Introduction<br />
Elastography is a method that exploits <strong>the</strong> elasticity <strong>of</strong><br />
tissue—<strong>the</strong> s<strong>of</strong>ter <strong>the</strong> tissue, <strong>the</strong> more de<strong>for</strong>mable it is; <strong>the</strong><br />
stiffer <strong>the</strong> tissue, <strong>the</strong> less de<strong>for</strong>mable it is—to measure <strong>the</strong><br />
displacement <strong>of</strong> tissue in minute areas and visualize <strong>the</strong><br />
strain calculated from <strong>the</strong> measurements 1)2) . This technology,<br />
equipped with real-time display capability and incorporated<br />
into a practical system, is named Real-time Tissue<br />
Elastography *1 (hereinafter referred to as elastography) 3)4) . In<br />
general, strain depends on stress (compression velocity) and<br />
is <strong>the</strong>re<strong>for</strong>e difficult to quantify. However, by taking<br />
advantage <strong>of</strong> <strong>the</strong> fact that strain changes linearly in a range<br />
<strong>of</strong> 2 to 3% 5) , we have developed <strong>Strain</strong> <strong>Ratio</strong> (SR), a measure<br />
<strong>for</strong> quantifying strain based on <strong>the</strong> ratio <strong>of</strong> strain between<br />
different tissues 6) .<br />
The elasticity score, a semi-quantitative assessment <strong>of</strong><br />
tissue elasticity in <strong>the</strong> breast region scored by <strong>the</strong> examiner,<br />
is reported to have greater sensitivity and a higher correct<br />
diagnosis rate than diagnosis using B-mode images 7) , and has<br />
been widely introduced as a new tool to support<br />
conventional diagnostic in<strong>for</strong>mation. A method has been<br />
developed to provide quantitative assessment <strong>of</strong> SR in <strong>the</strong><br />
breast region using <strong>Strain</strong> <strong>Ratio</strong> <strong>of</strong> fat to lesion, Fat Lesion<br />
<strong>Ratio</strong> (FLR), as shown in <strong>for</strong>mula (1), and FLR has been<br />
-1-<br />
reported to have sufficient clinical capability <strong>for</strong> objective<br />
diagnosis 8) .<br />
Mean fat strain<br />
FLR = (1)<br />
Mean lesion strain<br />
Generally speaking, changes in tissue elasticity due to <strong>the</strong><br />
estrous cycle and individual differences are considered less<br />
pronounced in fat than in <strong>the</strong> normal mammary gland, which<br />
is why FLR serves as an index to estimate <strong>the</strong> degree <strong>of</strong><br />
strain in a lesion in relation to that in fat. Since fat is s<strong>of</strong>t<br />
and <strong>the</strong> strain is large, <strong>the</strong> SR value is <strong>of</strong>ten greater than 1,<br />
and <strong>the</strong> harder and less de<strong>for</strong>mable <strong>the</strong> lesion is, <strong>the</strong> greater<br />
<strong>the</strong> SR value.<br />
2. Problems <strong>of</strong> conventional operation<br />
Conventional procedures <strong>of</strong> SR measurement involve<br />
visualizing an elastography image and setting regions <strong>of</strong><br />
interest (ROIs) manually on <strong>the</strong> mass and fat layer<br />
respectively. When setting ROIs, visual inspection and<br />
careful manual handling are required because <strong>the</strong> examiner<br />
needs to identify a hypoechoic area in <strong>the</strong> B-mode image,<br />
set a circular ROI that roughly inscribes <strong>the</strong> identified area,<br />
and repeat <strong>the</strong> same procedure in <strong>the</strong> fat layer.<br />
MEDIX-E004
3. Operating procedure and automated<br />
algorithm <strong>of</strong> <strong>Assist</strong> <strong>Strain</strong> <strong>Ratio</strong><br />
To solve <strong>the</strong> problems <strong>of</strong> operation, we have automated<br />
almost <strong>the</strong> entire process <strong>of</strong> operation involved in <strong>the</strong><br />
setting <strong>of</strong> ROIs and named this capability <strong>Assist</strong> <strong>Strain</strong><br />
<strong>Ratio</strong>. The operating procedure and algorithm are described<br />
below.<br />
3.1 Operating procedure<br />
After <strong>the</strong> elastography image is visualized, when <strong>the</strong> user<br />
roughly specifies <strong>the</strong> center <strong>of</strong> <strong>the</strong> area on which to set a<br />
mass ROI, <strong>the</strong> algorithm automatically sets <strong>the</strong> mass and fat<br />
layer ROIs, calculates <strong>the</strong> SR value, and displays it on <strong>the</strong><br />
screen.<br />
3.2 Algorighm <strong>for</strong> <strong>the</strong> automated setting <strong>of</strong> mass ROIs<br />
First, <strong>the</strong> algorithm calculates <strong>the</strong> margin <strong>of</strong> a tumor mass<br />
visualized on a B-mode image. Then it places an ROI circle<br />
that roughly inscribes <strong>the</strong> mass margin with its center set in<br />
<strong>the</strong> neighborhood <strong>of</strong> <strong>the</strong> point specified by <strong>the</strong> user. We say<br />
<strong>the</strong> ROI circle inscribes <strong>the</strong> mass margin “roughly” because<br />
sometimes <strong>the</strong> mass margin is invisible under <strong>the</strong> shadow <strong>of</strong><br />
<strong>the</strong> nipple or <strong>the</strong> mass. Also, <strong>the</strong> algorithm searches <strong>for</strong> <strong>the</strong><br />
center <strong>of</strong> <strong>the</strong> ROI circle in <strong>the</strong> "neighborhood" <strong>of</strong> <strong>the</strong> point<br />
specified by <strong>the</strong> user—ra<strong>the</strong>r than setting it exactly at that<br />
point—to maximize <strong>the</strong> area <strong>of</strong> <strong>the</strong> ROI. We wanted to make<br />
this process easier, thus we have <strong>the</strong> algorithm search this<br />
way because it is difficult <strong>for</strong> <strong>the</strong> user to visually specify on<br />
<strong>the</strong> image <strong>the</strong> optimal center that maximizes <strong>the</strong> radius <strong>of</strong><br />
<strong>the</strong> ROI. The user only has to roughly indicate <strong>the</strong> center <strong>of</strong><br />
<strong>the</strong> mass; <strong>the</strong> exact location <strong>of</strong> <strong>the</strong> center and setting <strong>of</strong> <strong>the</strong><br />
optimal ROI are automatically processed by <strong>the</strong> algorithm.<br />
Detection <strong>of</strong> <strong>the</strong> mass margin is achieved by function f as<br />
shown in <strong>for</strong>mula (2). Function f takes up <strong>the</strong> points that<br />
have gradient directions (A) going away from <strong>the</strong><br />
user-specified point (U) and returns <strong>the</strong> points that have<br />
sharp and large gradient lengths (L) as <strong>the</strong> legion margin (R).<br />
The gradient direction (A) is <strong>the</strong> direction <strong>of</strong> <strong>the</strong> change in<br />
brightness (<strong>for</strong>mula (3)), and <strong>the</strong> gradient length (L)<br />
represents <strong>the</strong> sharpness <strong>of</strong> <strong>the</strong> change in brightness<br />
(<strong>for</strong>mula (4)). The gradient <strong>of</strong> brightness (G) is a vector<br />
consisting <strong>of</strong> x and y components, which is calculated by<br />
partial differentiation <strong>of</strong> <strong>the</strong> brightness <strong>of</strong> <strong>the</strong> B-mode image<br />
(I) (<strong>for</strong>mula (5)). An example <strong>of</strong> <strong>the</strong> mass margin calculated<br />
from a phantom image is shown in Figure 1.<br />
Figure 1: Example <strong>of</strong> <strong>the</strong> calculated mass margin<br />
B-mode image <strong>of</strong> a phantom (top) and gradient vectors (middle, blue<br />
arrows); Gradient length (middle, monotone image); Mass margin<br />
(bottom, blue dots)<br />
The detection <strong>of</strong> <strong>the</strong> mass margin (R) is followed by <strong>the</strong><br />
determination <strong>of</strong> <strong>the</strong> optimal center <strong>of</strong> <strong>the</strong> ROI (C) from <strong>the</strong><br />
pixels (c) neighboring <strong>the</strong> user-specified point. The<br />
algorithm proceeds as follows. First, it calculates <strong>the</strong><br />
distance from each (c k<br />
) <strong>of</strong> <strong>the</strong> neighboring pixels (c) to all<br />
<strong>the</strong> pixels at <strong>the</strong> mass margin, and determines <strong>the</strong> minimum<br />
distances (J k<br />
) <strong>of</strong> all <strong>the</strong> distances (<strong>for</strong>mula (6)). Then it<br />
selects <strong>the</strong> maximum <strong>of</strong> <strong>the</strong> minimum distances as index K<br />
(<strong>for</strong>mula (7)), and has <strong>the</strong> central location (c K<br />
) serve as <strong>the</strong><br />
center <strong>of</strong> <strong>the</strong> ROI (<strong>for</strong>mula (8)). An example <strong>of</strong> <strong>the</strong> calculated<br />
ROI is shown in Figure 2.<br />
Minimum distance J k = argmin(|Rj – c k |)<br />
Index K, <strong>the</strong> maximum <strong>of</strong> <strong>the</strong> minimum distances = augmax(J k<br />
k<br />
Calculated center <strong>of</strong> <strong>the</strong> ROI = cK<br />
(6)<br />
(7)<br />
(8)<br />
R = f ( U, A, L )<br />
(2)<br />
A = angle ( G )<br />
(3)<br />
L = | G |<br />
(4)<br />
G<br />
=<br />
∂I<br />
∂I<br />
+ i<br />
(5)<br />
∂x<br />
∂y<br />
-2-<br />
Figure 2: Example <strong>of</strong> <strong>the</strong> calculated ROI<br />
User-specified point (U) (red point) and calculated ROI (yellow circle and<br />
yellow point); Pixels neighboring <strong>the</strong> user-specified point (c) (green dots);<br />
Minimum distance (Jk) (red line)<br />
MEDIX-E004
3.3 Algorighm <strong>for</strong> <strong>the</strong> automated setting <strong>of</strong> a fat layer ROI<br />
Since it is difficult with <strong>the</strong> current technology to identify a<br />
fat layer, we took <strong>the</strong> approach <strong>of</strong> not setting an ROI in an<br />
area that is obviously not a fat layer. The procedure consists<br />
<strong>of</strong> <strong>the</strong> following 3 steps:<br />
1) Calculate distributions in which areas that are<br />
obviously not a fat layer are given low values<br />
(hereinafter referred to as “possibility distribution” ).<br />
2) Have <strong>the</strong> area with <strong>the</strong> highest value <strong>of</strong> possibility<br />
distribution serve as <strong>the</strong> tentative center <strong>of</strong> a fat layer ROI.<br />
Draw an ROI circle that has a radius extending from <strong>the</strong><br />
area neighboring <strong>the</strong> tentative center to <strong>the</strong> margin <strong>of</strong><br />
3) <strong>the</strong> fat layer in <strong>the</strong> same manner used <strong>for</strong> drawing a<br />
mass ROI.<br />
An explanation <strong>of</strong> this important concept <strong>of</strong> possibility<br />
distribution follows. Possibility distribution has <strong>the</strong> same<br />
field as <strong>the</strong> elastography image. Each pixel in this field is<br />
given a value <strong>of</strong> 0 if it is “obviously not a fat layer,” and a<br />
value greater than 0 but not greater than 1 if it is not<br />
“obviously not a fat layer.” In o<strong>the</strong>r words, an area likely to<br />
be a fat layer has a value closer to 1, and an area that is<br />
unlikely to be a fat layer has a value closer to 0. Since <strong>the</strong>se<br />
values are difficult to determine based on a single condition,<br />
<strong>the</strong>y are determined based on multiple conditions.<br />
Possibility distribution (P) is calculated as <strong>the</strong> product <strong>of</strong><br />
distributions P1, P2 and P3 as shown in <strong>for</strong>mula (9).<br />
Examples <strong>of</strong> <strong>the</strong>se distributions are shown in Figure 3, and<br />
each type <strong>of</strong> distribution is explained as follows:<br />
-<br />
-<br />
-<br />
P1: distribution in which areas with low brightness <strong>of</strong> a<br />
B-mode image (I) are given a possibility value <strong>of</strong> 0, and<br />
<strong>the</strong> o<strong>the</strong>rs are given 1 (<strong>for</strong>mula (10))<br />
P2: distribution in which <strong>the</strong> higher <strong>the</strong> gradient length<br />
(L), <strong>the</strong> lower <strong>the</strong> possibility (<strong>for</strong>mula (11))<br />
P3: distribution in which areas with low strain<br />
distribution (E) are given a possibility value <strong>of</strong> 0, and<br />
<strong>the</strong> o<strong>the</strong>rs are given 1 (<strong>for</strong>mula (12))<br />
Possibility distribution P = P 1 ∙ P 2 ∙ P3<br />
Non-low-intensity distribution P 1 =<br />
B-image intensity (I) ><br />
Low-intensity decision threshold<br />
Non-structure distribution P 2 = 1 -<br />
Non-de<strong>for</strong>mation distribution P3 =<br />
Gradient length (L)<br />
Max (gradient length (L))<br />
<strong>Strain</strong> distribution (E) ><br />
<strong>Strain</strong> threshold<br />
(9)<br />
(10)<br />
(11)<br />
(12)<br />
3.4 Assessment method<br />
Among patients who underwent <strong>the</strong> SR measurements by<br />
means <strong>of</strong> <strong>the</strong> HI VISION Ascendus diagnostic ultrasound<br />
scanner *2 in a breast sonography examination at Kawasaki<br />
Hospital and Tsukuba Medical Center Hospital, 99 patients<br />
with a mass image-<strong>for</strong>ming mass were subjected to<br />
assessment. The assessment involved a quantitative<br />
determination <strong>of</strong> how closely <strong>the</strong> user-set ROIs and <strong>the</strong><br />
measured SR values were approximated by those determined<br />
semi-automatically by <strong>the</strong> algorithm with <strong>the</strong> input <strong>of</strong> <strong>the</strong><br />
user-specified centers <strong>of</strong> ROIs. Mass ROIs were evaluated<br />
by radius-converted overlap rate. Fat layer ROIs were<br />
visually examined to determine whe<strong>the</strong>r <strong>the</strong> ROI set by <strong>the</strong><br />
algorithm was located on <strong>the</strong> fat layer. An overall evaluation<br />
was made using <strong>the</strong> correlation coefficients <strong>of</strong> <strong>the</strong> SR values<br />
measured by <strong>the</strong> user and those measured semi-automatically.<br />
The radius-converted overlap rate was calculated by <strong>for</strong>mula<br />
(13), where α is <strong>the</strong> radius <strong>of</strong> an ROI set by <strong>the</strong> user, β is<br />
<strong>the</strong> radius <strong>of</strong> an ROI set semi-automatically, and γ is <strong>the</strong><br />
radius converted from <strong>the</strong> overlapped area. The<br />
radius-converted overlap rate is 1 if both ROIs overlap<br />
completely with each o<strong>the</strong>r, and 0 if <strong>the</strong>re is no overlap.<br />
Radius-converted overlap rate =<br />
2γ<br />
α + β<br />
4. Results and Discussion<br />
The mean radius-converted overlap rate <strong>for</strong> mass ROIs was<br />
0.87 ± 0.06 SD. Figure 4 shows examples <strong>of</strong><br />
radius-converted overlap rates <strong>of</strong> 0.81, 0.87, and 0.93.<br />
Visual inspection <strong>of</strong> <strong>the</strong> fat ROIs revealed that <strong>the</strong> ROI was<br />
located on <strong>the</strong> fat layer in 93 <strong>of</strong> <strong>the</strong> 99 cases. The SR values<br />
measured by <strong>the</strong> user and those measured semi-automatically<br />
were strongly positively correlated (r=0.84, p
These results suggest that <strong>the</strong> probability is comparable to<br />
that <strong>of</strong> <strong>the</strong> SR values determined with <strong>the</strong> conventional<br />
manual method. Since replacing <strong>the</strong> manual measurement<br />
with semi-automatic measurement reduces <strong>the</strong> trouble<br />
involved, <strong>the</strong> introduction <strong>of</strong> this technology will hopefully<br />
improve <strong>the</strong> throughput <strong>of</strong> examination. To attain this<br />
improvement it is necessary to clearly visualize <strong>the</strong> margin <strong>of</strong><br />
a mass on a B-mode image and achieve good reproducibility<br />
when obtaining elastographic images.<br />
5. Limitations<br />
With this technology it is difficult to detect accurate margin<br />
in<strong>for</strong>mation from masses that do not have a distinct tumor<br />
shape, such as masses with ambiguous margins on B-mode<br />
images or non-mass image-<strong>for</strong>ming masses. It is also<br />
necessary to check <strong>the</strong> validity <strong>of</strong> <strong>the</strong> set ROI and correct it<br />
manually if it turns out to be invalid.<br />
6. Future challenges<br />
Fur<strong>the</strong>r reducing <strong>the</strong> difficulty in measurement will require<br />
automated detection <strong>of</strong> <strong>the</strong> center <strong>of</strong> a lesion ROI. If this<br />
becomes possible, <strong>the</strong> user will be able to obtain results with<br />
just one press <strong>of</strong> a button on <strong>the</strong> console, eliminating a<br />
significant amount <strong>of</strong> steps in <strong>the</strong> examination and thus<br />
contributing to improved throughput.<br />
References<br />
1)<br />
2)<br />
3)<br />
4)<br />
5)<br />
6)<br />
7)<br />
8)<br />
Shiina T, et al. : <strong>Strain</strong> Imaging Using Combined RF and<br />
Envelope Autocorrelation Processing. Proc. <strong>of</strong> 1996<br />
IEEE Ultrasonics Symp, 4 : 1331-1336, 1996.<br />
Matsumura T, et al. : <strong>Development</strong> <strong>of</strong> Freehand<br />
Ultrasound<br />
Elasticity Imaging System and in vivo Results. First<br />
International Conference on <strong>the</strong> Ultrasonic <strong>Measurement</strong><br />
and Imaging <strong>of</strong> Tissue Elasticity, 1 : 80, 2002.<br />
Matsumura T, et al. : <strong>Development</strong> <strong>of</strong> Real-time Tissue<br />
Elastography. MEDIX 41, 30-35, 2004.<br />
Matsumura T, et al. : Diagnostic results <strong>for</strong> breast<br />
disease by real-time elasticity imaging system.<br />
Proceedings<br />
<strong>of</strong> 2004 IEEE Ultrasonics Symposium : 1484-1487, 2004.<br />
N.Nitta, T.Shiina : Estimation <strong>of</strong> Nonlinear Parameter<br />
<strong>of</strong> Tissues by Ultrasound. Japanese Journal <strong>of</strong> Applied<br />
Physics, 41, Part 1, 5B, 3572-3578, 2002.<br />
Waki K, et al. : INVESTIGATION OF STRAIN RATIO<br />
USING ULTRASOUND ELASTOGRAPHY<br />
TECHNIQUE. Proc.ISICE 2007 p449-452<br />
Itoh A, et al. : Clinical application <strong>of</strong> US elastography <strong>for</strong><br />
diagnosis. Radiology, 239 (2) , 341-350, 2006.<br />
Ueno E, et al. : New quantitative method in breast<br />
elastography : Fat Lesion <strong>Ratio</strong> (FLR). Abstracts <strong>of</strong><br />
RSNA 2007 ; LL-BR2123-H04, 2007.<br />
7. Acknowledgments<br />
The assessment <strong>of</strong> <strong>the</strong> clinical usability <strong>of</strong> this technology<br />
during <strong>the</strong> development process—from prototype design to<br />
integration into <strong>the</strong> practical system—has been undertaken<br />
as a collaborative research with Dr. Kazutaka Nakashima <strong>of</strong><br />
Kawasaki Hospital and Dr. Ei Ueno <strong>of</strong> Tsukuba Medical<br />
Center Hospital. We would like to thank everyone<br />
concerned in both hospitals <strong>for</strong> <strong>the</strong>ir contribution to this<br />
project.<br />
*1 Real-time Tissue Elastography; *2 HI VISION Ascendus and<br />
Ascendus are registered trademarks <strong>of</strong> Hitachi Medical Corporation<br />
in Japan and o<strong>the</strong>r countries.<br />
-4-<br />
MEDIX-E004