Polar mesosphere summer echoes (PMSE): review of ... - HAL
Polar mesosphere summer echoes (PMSE): review of ... - HAL
Polar mesosphere summer echoes (PMSE): review of ... - HAL

You also want an ePaper? Increase the reach of your titles
YUMPU automatically turns print PDFs into web optimized ePapers that Google loves.
M. Rapp and F. J. Lübken: Review <strong>of</strong> <strong>PMSE</strong> 2607<br />
√<br />
ω B = g<br />
T ( dT<br />
dz + g<br />
c p<br />
) is the Brunt-Väisälä frequency (where T<br />
is temperature, g is the acceleration due to gravity, and c p is<br />
the specific heat <strong>of</strong> air at constant pressure). Using a typical<br />
value <strong>of</strong> ω B =10 −2 1/s we see that w rms =0.5 m/s corresponds<br />
to ɛ=5×10 −3 W/kg. On the other hand, to have the inner<br />
scale <strong>of</strong> turbulence equal to the Bragg scale (which is 67 cm<br />
in the case <strong>of</strong> the EISCAT 224 MHz radar), ɛ=5×10 4 W/kg<br />
would be required. Hence, there is a discrepancy <strong>of</strong> seven orders<br />
<strong>of</strong> magnitude (!) between the required turbulent energy<br />
dissipation rate to explain the scatter as being due to pure<br />
neutral air turbulence and the value derived from the spectral<br />
width <strong>of</strong> the radar signal.<br />
In addition, Röttger and LaHoz (1990) pointed out that<br />
also the spectral shape <strong>of</strong> the <strong>PMSE</strong> is significantly different<br />
from the usually assumed Lorentzian shape <strong>of</strong> incoherent<br />
scatter spectra (e.g., Hoppe and Hansen, 1988). Rather,<br />
the <strong>PMSE</strong> spectra appear as a superposition <strong>of</strong> several narrow<br />
band spectra (Fig. 6, spectra for 2 July 1987) or as a<br />
single high amplitude spike superimposed on a weaker and<br />
wider spectral background (Fig. 6, spectra for 9 July 1987).<br />
Röttger and LaHoz hypothesized that these signatures were<br />
due to fairly small and localized refractive index structures<br />
coexisting within the radar beam (i.e., within a volume <strong>of</strong><br />
1 km in vertical and 2 km in horizontal extent) which move<br />
with different velocities. This would further imply that the<br />
structures causing <strong>PMSE</strong> are unlikely to be filling the scattering<br />
volume homogeneously.<br />
2.3.3 Aspect sensitivity<br />
A further property <strong>of</strong> the radar <strong>echoes</strong> that can potentially<br />
teach us a lot about the physics <strong>of</strong> the scattering process and<br />
the nature <strong>of</strong> the scatterers is the so called aspect sensitivity.<br />
The aspect sensitivity describes the radar signal dependence<br />
when the beam is tilted from the vertical direction. In<br />
general, a strong signal decrease with increasing beam tilting<br />
angle implies that the observed scatterers are specular<br />
(like in the case <strong>of</strong> Fresnel scatter, i.e., scattering on single<br />
pronounced gradients in the electron number density that extent<br />
horizontally over several kilometers), whereas no signal<br />
dependence on the tilting angle is usually identified with<br />
isotropically oriented scattering structures as they would be<br />
expected in the case <strong>of</strong> three-dimensionally isotropic turbulence.<br />
Quantitatively, the aspect sensitivity is usually expressed<br />
as the half width, θ S , <strong>of</strong> the angular polar diagram <strong>of</strong> the<br />
backscatter (Hocking et al., 1986). Hence, large values <strong>of</strong> θ S<br />
imply a small aspect sensitivity and vice versa. Czechowsky<br />
et al. (1988) reported the first measurements <strong>of</strong> the aspect<br />
sensitivity <strong>of</strong> <strong>PMSE</strong> and found indeed a significant aspect<br />
sensitivity with θ s between 2 and 10 ◦ . Interestingly, the results<br />
<strong>of</strong> Czechowsky et al. (1988) show large aspect sensitivities<br />
(small θ s ) in the lower part <strong>of</strong> the <strong>PMSE</strong> layer coincident<br />
with rather small values <strong>of</strong> the observed spectral width and<br />
small aspect sensitivities (large θ s ) in the upper part <strong>of</strong> the<br />
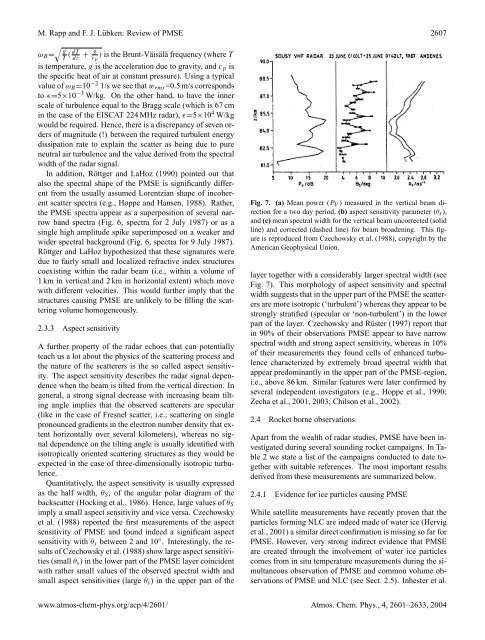
Fig. 7. (a) Mean power (P V ) measured in the vertical beam direction<br />
for a two day period, (b) aspect sensitivity parameter (θ s ),<br />
and (c) mean spectral width for the vertical beam uncorrected (solid<br />
line) and corrected (dashed line) for beam broadening. This figure<br />
is reproduced from Czechowsky et al. (1988), copyright by the<br />
American Geophysical Union.<br />
layer together with a considerably larger spectral width (see<br />
Fig. 7). This morphology <strong>of</strong> aspect sensitivity and spectral<br />
width suggests that in the upper part <strong>of</strong> the <strong>PMSE</strong> the scatterers<br />
are more isotropic (‘turbulent’) whereas they appear to be<br />
strongly stratified (specular or ‘non-turbulent’) in the lower<br />
part <strong>of</strong> the layer. Czechowsky and Rüster (1997) report that<br />
in 90% <strong>of</strong> their observations <strong>PMSE</strong> appear to have narrow<br />
spectral width and strong aspect sensitivity, whereas in 10%<br />
<strong>of</strong> their measurements they found cells <strong>of</strong> enhanced turbulence<br />
characterized by extremely broad spectral width that<br />
appear predominantly in the upper part <strong>of</strong> the <strong>PMSE</strong>-region,<br />
i.e., above 86 km. Similar features were later confirmed by<br />
several independent investigators (e.g., Hoppe et al., 1990;<br />
Zecha et al., 2001, 2003; Chilson et al., 2002).<br />
2.4 Rocket borne observations<br />
Apart from the wealth <strong>of</strong> radar studies, <strong>PMSE</strong> have been investigated<br />
during several sounding rocket campaigns. In Table<br />
2 we state a list <strong>of</strong> the campaigns conducted to date together<br />
with suitable references. The most important results<br />
derived from these measurements are summarized below.<br />
2.4.1 Evidence for ice particles causing <strong>PMSE</strong><br />
While satellite measurements have recently proven that the<br />
particles forming NLC are indeed made <strong>of</strong> water ice (Hervig<br />
et al., 2001) a similar direct confirmation is missing so far for<br />
<strong>PMSE</strong>. However, very strong indirect evidence that <strong>PMSE</strong><br />
are created through the involvement <strong>of</strong> water ice particles<br />
comes from in situ temperature measurements during the simultaneous<br />
observation <strong>of</strong> <strong>PMSE</strong> and common volume observations<br />
<strong>of</strong> <strong>PMSE</strong> and NLC (see Sect. 2.5). Inhester et al.<br />
www.atmos-chem-phys.org/acp/4/2601/ Atmos. Chem. Phys., 4, 2601–2633, 2004