Download - Imperial Oil
Download - Imperial Oil
Download - Imperial Oil

You also want an ePaper? Increase the reach of your titles
YUMPU automatically turns print PDFs into web optimized ePapers that Google loves.
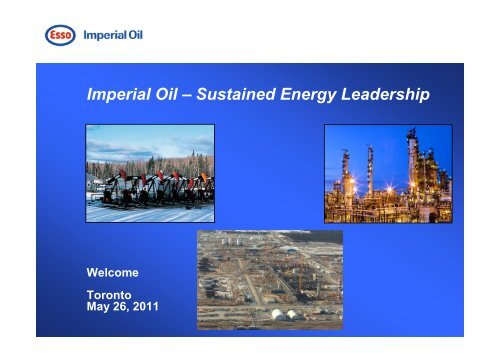
<strong>Imperial</strong> <strong>Oil</strong> – Sustained Energy Leadership<br />
Welcome<br />
Toronto<br />
May 26, 2011
Agenda<br />
9 am Welcome Mark Stumpf<br />
Manager, investor relations/planning & analysis<br />
<strong>Imperial</strong> <strong>Oil</strong> – Sustained Energy Bruce March<br />
Leadership Chairman, president and chief executive officer<br />
Upstream<br />
Downstream and Chemical<br />
Finance<br />
Glenn Scott<br />
Senior vice-president resources<br />
Bruce March<br />
Paul Masschelin<br />
Senior vice-president, finance and<br />
administration, and treasurer<br />
10:45 Summary remarks and Q&A Bruce March<br />
- 11:30
Cautionary Statement<br />
This presentation contains forward-looking information on future production, project start-ups and future<br />
capital spending. Actual results could differ materially due to changes in project schedules, operating<br />
performance, demand for oil and gas, commercial negotiations or other technical and economic factors.<br />
<strong>Oil</strong>-equivalent barrels (OEB) may be misleading, particularly if used in isolation. An OEB conversion<br />
ratio of 6,000 cubic feet to one barrel is based on an energy-equivalency conversion method primarily<br />
applicable at the burner tip and does not represent a value equivalency at the well head.<br />
Proved reserves are calculated under United States Securities and Exchange Commission (SEC)<br />
requirements, as shown in Form 10-K dated December 31, 2010.<br />
Pursuant to National Instrument 51-101 disclosure guidelines, and using Canadian <strong>Oil</strong> and Gas<br />
Evaluation Handbook definitions, <strong>Imperial</strong>’s non-proved resources are classified as a “contingent<br />
resource.” Such resources are a best estimate of the company’s net interest after royalties at year-end<br />
2010, as determined by <strong>Imperial</strong>’s internal qualified reserves evaluator. Contingent resources are<br />
considered to be potentially recoverable from known accumulations, using established technology or<br />
technology under development, but are currently not considered to be commercially recoverable due to<br />
one or more contingencies. There is no certainty that it will be economically viable or technically<br />
feasible to produce any portion of the resource.<br />
Financials in Canadian dollars.
<strong>Imperial</strong> <strong>Oil</strong> – 2011 Investor Meeting<br />
Our Business
2010 results<br />
Industry leading safety<br />
Double digit returns in each business segment<br />
• Long history of excellent safety performance<br />
• Sound environmental results<br />
• Strong bottom-line<br />
– Earnings: $2.2 billion<br />
– Return on capital employed: 21%<br />
– Cash flow from operations: $3.4 billion<br />
– Investing through the cycle on high quality<br />
growth projects : $4.0 billion<br />
• Large resource base:<br />
– Reserves 2.5 billion oil-equivalent barrels*<br />
– Non-proved resource 13 billion oil-equivalent<br />
barrels*<br />
* <strong>Imperial</strong> <strong>Oil</strong> interest after royalties
Safety leadership<br />
Nobody Gets Hurt<br />
Lost time incident rate<br />
incidents per 200k hours<br />
0.50<br />
0.40<br />
0.30<br />
Downstream industry benchmark*<br />
Upstream industry benchmark**<br />
employee<br />
contractor<br />
0.20<br />
0.10<br />
0.00<br />
`05 `06 `07 `08 '09 '10<br />
* Canadian Petroleum Products Institute (2010 data not available)<br />
** Canadian Association of Petroleum Producers (2009/2010 data not available)
Environmental business planning<br />
Protect Tomorrow. Today.<br />
• Rigorous environmental<br />
planning and stewardship<br />
Actions<br />
- Conserve:<br />
√ Energy efficiency<br />
- Reduce:<br />
√ Fresh water use<br />
√ Spills and releases<br />
√ Flaring & emissions<br />
√ Land-use footprint<br />
- Reclaim & reuse:<br />
√ Return to productive use
Environmental performance<br />
Upstream solution gas flaring intensity less than half of the next lowest<br />
operator<br />
Hydrocarbon flaring<br />
mcf/d<br />
5<br />
4<br />
3<br />
2<br />
1<br />
Upstream<br />
Downstream and<br />
Chemical<br />
• Operational excellence<br />
• Industry leading performance<br />
across all business units and<br />
sites<br />
• Rigorous environmental<br />
planning and stewardship<br />
0<br />
2006 2007 2008 2009 2010
Earnings<br />
Continued strong performance across all businesses<br />
Net income per share (diluted basis)<br />
$ / share<br />
5<br />
• Focus on operational excellence<br />
4<br />
3<br />
• Relentless operating expense control<br />
2<br />
1<br />
• Capitalizing on competitively<br />
advantaged asset base<br />
0<br />
2006 2007 2008 2009 2010<br />
Upstream Downstream Chemicals
Superior ROCE<br />
Sustained industry-leading return on capital employed<br />
Return on capital employed<br />
%<br />
• Strength of asset base<br />
50<br />
40<br />
30<br />
20<br />
10<br />
IMO<br />
HSE<br />
CVE<br />
CNQ<br />
• Focus on extracting maximum<br />
value from each asset<br />
• Disciplined investment<br />
• 2010 ROCE > 30% ex Kearl assets<br />
“under construction”<br />
0<br />
SU<br />
2006 2007 2008 2009 2010<br />
source: Bloomberg
ROCE strong in all business lines<br />
ROCE target: double digit returns in all business segments<br />
5 year average ROCE<br />
60%<br />
40%<br />
20%<br />
0%<br />
Chemical<br />
Upstream<br />
Downstream<br />
0 1 2 3 4 5 6 7 8 9 10<br />
5 year average capital employed – billion $
Superior shareholder returns<br />
Providing superior long-term returns to shareholders<br />
Toronto Stock Exchange<br />
%<br />
20<br />
IMO<br />
S&P/TSX Energy Index<br />
S&P/TSX Composite Index<br />
15<br />
10<br />
5<br />
0<br />
5 year 10 year 20 year<br />
source: Bloomberg,TMX - 10 and 20 year annualized returns to December 31, 2010,<br />
5 year to February 28, 2011
<strong>Imperial</strong> <strong>Oil</strong> – energy for 130 years<br />
Leading the development of energy in Canada<br />
• 69.6% owned by ExxonMobil<br />
• Competitive advantages<br />
– Discipline and consistency<br />
– Portfolio quality<br />
– Organizational capability<br />
– Superior technology<br />
– Balance sheet strength
Proven business model<br />
Leading the development of energy in Canada with a business model that<br />
is proven to deliver throughout the business cycle<br />
Disciplined<br />
Investment<br />
• Flawless execution<br />
• Grow profitable sales volumes<br />
High-Impact<br />
Technologies<br />
Growth in<br />
Shareholder<br />
Value<br />
Operational<br />
Excellence<br />
• Best-in-class cost structures<br />
• Improve quality of asset mix<br />
Industry-Leading<br />
Returns
Coast to coast to coast<br />
An integrated company providing energy products and<br />
innovation in North America<br />
Beaufort<br />
Taglu<br />
Norman<br />
Wells<br />
Horn River<br />
Syncrude<br />
Strathcona<br />
Tight oil<br />
Kearl<br />
Athabasca<br />
Cold Lake<br />
Dartmouth<br />
exploration<br />
major upstream production<br />
development<br />
fuels & lubes marketing<br />
integrated refinery with lubricants/Chemicals<br />
Sarnia<br />
Nanticoke<br />
Sable
Leveraging the ExxonMobil relationship<br />
Only publicly traded company in Canada with this level<br />
and depth of global support<br />
• Strategic alignment<br />
• Management systems honed<br />
worldwide<br />
• Superior project management<br />
• Best practices transfer<br />
• Training and development<br />
• World scale operations
Leveraging the ExxonMobil relationship<br />
Access to $1 billion per year in research and development<br />
• Shared leading edge technology<br />
• Fundamental research<br />
• Scale-up to commercial<br />
• Across all business segments
Business fundamentals<br />
<strong>Imperial</strong> <strong>Oil</strong> is positioned to prosper<br />
• Growing world population; strong GDP growth in developed and<br />
developing nations<br />
• Long-term demand forecasts for oil, gas and petrochemicals remain<br />
robust<br />
• Energy demand up with economic activity, strongly mitigated by<br />
efficiency<br />
- Continued strong growth for oil and gas from developing countries<br />
- Demand for petroleum products in OECD countries flat<br />
• Increasing regulation and oversight; climate change policies<br />
uncertain
Global energy demand to 2030<br />
Technical advances in efficiency and renewables critical, yet oil and gas<br />
will continue to supply about 60% of the world’s energy needs<br />
Primary energy<br />
Quadrillion BTUs<br />
700<br />
600<br />
500<br />
400<br />
Renewables<br />
Nuclear<br />
Coal<br />
90<br />
• Economic progress driving<br />
global energy demand<br />
• <strong>Oil</strong> and natural gas are<br />
60<br />
indispensable<br />
300<br />
Gas<br />
200<br />
100<br />
<strong>Oil</strong><br />
0<br />
1980 2005 2030<br />
• Requirements to meet rising<br />
demand: 30<br />
– Expand supply<br />
– Increase efficiency<br />
– Technology mitigate emissions<br />
0<br />
1980 2005<br />
– Huge investment
Global liquids supply / demand<br />
Investing in opportunities to supply Canada and the<br />
world’s energy needs<br />
mb/d<br />
• Significant new<br />
production required to<br />
offset field decline<br />
• Need for supply from<br />
many new sources,<br />
including oil sands<br />
International Energy Agency – World Energy Outlook 2010
North America energy demand & supply<br />
While demand for refined products may have peaked,<br />
the requirements for gas to generate electricity grow<br />
Total by fuel<br />
Quadrillion BTUs<br />
120<br />
Total by sector<br />
Quadrillion BTUs<br />
120<br />
Power generation by fuel<br />
Quadrillion BTUs<br />
50<br />
100<br />
Renewables<br />
Biomass<br />
Nuclear<br />
100<br />
Res/Comm<br />
Industrial<br />
40<br />
Other Renewables<br />
Wind & Solar<br />
Biomass<br />
80<br />
Coal<br />
80<br />
Nuclear<br />
30<br />
60<br />
Gas<br />
60<br />
Power Generation<br />
20<br />
Coal<br />
40<br />
40<br />
20<br />
<strong>Oil</strong><br />
20<br />
Transportation<br />
10<br />
Gas<br />
0<br />
1980 2005 2030<br />
0<br />
1980 2005 2030<br />
<strong>Oil</strong><br />
0<br />
1980 2005 2030
Gas as a transition fuel<br />
With a low carbon intensity, natural gas is an ideal fuel to<br />
replace coal in electricity generation<br />
• Gas is abundant, clean and<br />
affordable<br />
• Gas is excellent opportunity as we<br />
transition from more GHG intensive<br />
power generation to renewable<br />
forms later in the century
U.S. demand for energy<br />
Canada is by far the largest supplier of energy to the U.S.; liquids<br />
exports from Canada to U.S. expected to grow<br />
Top countries - USA energy imports<br />
Quadrillion BTUs<br />
8<br />
6<br />
4<br />
Coal<br />
Electricity<br />
Natural gas<br />
Products<br />
Crude<br />
2<br />
0<br />
Canada<br />
Mexico<br />
Venezuela<br />
Saudi Arabia<br />
Nigeria<br />
Russia<br />
Angola<br />
Algeria<br />
Iraq<br />
Colombia<br />
2009, U.S. Energy Information Agency, net by commodity and country
Canada – attractive investment climate<br />
Canada remains an excellent jurisdiction to do business<br />
Positive attributes<br />
• Stable democracy<br />
• Encourages resource<br />
development<br />
• Welcomes private investment<br />
• Adept regulators<br />
Challenges remain<br />
• Regional inflation<br />
• Labour availability
Industry Risks<br />
The energy industry faces multiple uncertainties and risks. Well developed<br />
processes, procedures and people are required to manage risks
Risk management approach<br />
Common expectations for addressing risk inherent in our business<br />
Capable, committed workforce with clear accountabilities<br />
Well developed and clearly defined policies and procedures<br />
High standards of design to reduce or eliminate risk<br />
Employee and contractor training<br />
Systematic approach to performance metrics and continuous<br />
improvement<br />
Rigorously applied management systems
Risk management approach<br />
<strong>Imperial</strong> <strong>Oil</strong> employs multiple management systems to lower risk across the<br />
businesses, forming a foundation for strong financial and operating results<br />
Operations Integrity Management System<br />
Facilities Integrity Management System<br />
Controls Integrity Management System<br />
ExxonMobil Capital Project Management System
Responsible resource development<br />
<strong>Imperial</strong> <strong>Oil</strong> continues to be at the forefront, working with stakeholders on<br />
public policy, continually improving operations and investing in technology<br />
air emissions<br />
reclamation at Syncrude<br />
cogeneration
<strong>Oil</strong> sands – responsible development<br />
Proven gains in water use efficiency at Cold Lake, committed to a<br />
further 30% improvement<br />
fresh water to<br />
bitumen ratio<br />
5.0<br />
4.0<br />
Cold Lake water use<br />
Water<br />
Volume<br />
(m3/d)<br />
80,000<br />
3.0<br />
60,000<br />
2.0<br />
40,000<br />
1.0<br />
20,000<br />
0.0<br />
1975 1980 1985 1990 1995 2000 2005 2010<br />
-<br />
Total Fresh Water Used<br />
Fresh water to bitumen ratio
<strong>Oil</strong> sands – responsible development<br />
Kearl – the next generation of technology<br />
Technology/approach<br />
Proprietary paraffinic froth<br />
treatment<br />
Compensation lakes<br />
Cogeneration<br />
Impact on environment<br />
Reduce GHGs: process bitumen once instead of<br />
twice in an upgrader and refinery<br />
Double original fish habitat<br />
Reduce GHGs by half a million tonnes per year<br />
Progressive reclamation<br />
Reclamation underway in advance of production<br />
Water storage on site<br />
Mitigate impact on Athabasca River during low<br />
flow periods<br />
Recycling >90%
<strong>Oil</strong> sands – responsible development<br />
Cold Lake Nabiye – building on technology expertise<br />
• Latest well pad design to minimize<br />
footprint<br />
• Adding cogeneration capacity to<br />
reduce GHG emission intensity<br />
• Applying the latest in improved<br />
sulphur removal technology
<strong>Oil</strong> sands – responsible development<br />
Latest technologies - Greenhouse gas emissions on par with the<br />
average of all crudes refined in the U.S.<br />
Wells-to-wheels greenhouse gas emissions<br />
Canadian oil sands: mined dilbit<br />
Average US barrel consumed<br />
California heavy oil<br />
Nigerian light crude<br />
Canadian heavy<br />
Venezuelan partial upgrader<br />
Well to Tank<br />
Tank to Wheels<br />
0 200 400 600 800<br />
Kilograms of CO2 equivalent per barrel of refined products<br />
Source: IHS-CERA
<strong>Oil</strong> sands – research and development<br />
At our Calgary Research Centre, scientists’ work is focused on<br />
extraction efficiency while minimizing environmental impacts<br />
• In-situ processes<br />
• Non-aqueous extraction<br />
• Centre for <strong>Oil</strong> Sands Innovation at<br />
University of Alberta<br />
- Game changing technology focus<br />
• Industry collaboration on tailings<br />
treatment
Non-aqueous extraction<br />
A potential game-changer, non-aqueous extraction would virtually<br />
eliminate the need for water and tailings ponds<br />
Bitumen<br />
<strong>Oil</strong> Sands<br />
Solid Agglomerates
Public advocacy – oil sands development<br />
Balance economic, social and environmental aspects<br />
Ensure all perspectives are heard and science is front and centre<br />
• Leadership position in CAPP<br />
• CAPP pan-continental<br />
communication plan<br />
• Legislators, regulators,<br />
academia, community leaders<br />
• CAPP Roundtables<br />
• Community engagement<br />
• Capability building
<strong>Imperial</strong> strengths<br />
Underpinned by superior technology, financial strength and a long-term<br />
focus<br />
• Discipline and consistency<br />
industry leadership<br />
through the<br />
business cycle<br />
• Portfolio quality<br />
• Integration and capability<br />
• Embarking on a growth strategy
<strong>Imperial</strong> <strong>Oil</strong> – 2011 Investor Meeting<br />
Upstream – Doubling Production
<strong>Imperial</strong> <strong>Oil</strong> Upstream business<br />
Operational excellence and continued growth in oil sands in the<br />
medium term and natural gas in the longer term<br />
2010 Results<br />
• Earnings<br />
$1.7 billion<br />
• ROCE 21%<br />
• Production*<br />
• <strong>Oil</strong> production*<br />
• <strong>Oil</strong> sands production*<br />
• Capex<br />
294 kboed<br />
247 kbd<br />
217 kbd<br />
$3.8 billion<br />
* before royalties
Upstream assets<br />
Premier producing assets, exciting development opportunities and<br />
potentially large exploration plays<br />
Beaufort<br />
Taglu<br />
Norman<br />
Wells<br />
Horn River<br />
Tight oil<br />
Syncrude<br />
Kearl<br />
Athabasca<br />
Cold Lake<br />
Sable<br />
exploration<br />
key production<br />
development
<strong>Imperial</strong> <strong>Oil</strong> Upstream strategy<br />
Apply technology to find and responsibly development and operate<br />
advantaged oil and gas resources in Canada<br />
• Identify and selectively capture<br />
the highest-quality exploration<br />
opportunities<br />
• Invest in projects that deliver<br />
superior returns<br />
• Maximize profitability of existing<br />
oil and gas production<br />
• Capitalize on growing natural<br />
gas and power markets<br />
• Maximize resource value through<br />
high impact technologies and<br />
integrated solutions
Operational excellence<br />
Focus on execution excellence leads to industry leading safety,<br />
environmental performance and reliability<br />
3 year average production % of<br />
capacity<br />
Cold Lake<br />
MacKay River<br />
Foster Creek<br />
Christina Lake<br />
Primrose/Wolf Lake<br />
Peace River<br />
Surmont<br />
Jackfish<br />
Firebag<br />
Orion<br />
Long Lake<br />
Tucker<br />
Source: Can<strong>Oil</strong>s<br />
0% 20% 40% 60% 80% 100%
<strong>Oil</strong> sands – an accessible resource<br />
Canada’s oil sands – an attractive opportunity for investment<br />
World oil resource<br />
billion barrels<br />
300<br />
260<br />
250<br />
211<br />
Canada’s<br />
<strong>Oil</strong> Sands<br />
52%<br />
200<br />
175<br />
150<br />
100<br />
50<br />
137<br />
115<br />
102<br />
92<br />
60<br />
46<br />
37<br />
30<br />
25<br />
20 19<br />
Rest<br />
of World<br />
48%<br />
0<br />
Saudi Arabia<br />
Venezuela<br />
Canada<br />
Iran<br />
Source: <strong>Oil</strong> & Gas Journal<br />
Iraq<br />
Kuwait<br />
Abu Dhabi<br />
Russia<br />
Libya<br />
Nigeria<br />
Kazhakhstan<br />
Qatar<br />
China<br />
United States
<strong>Imperial</strong> <strong>Oil</strong> – over 40 years of oil sands experience<br />
<strong>Imperial</strong> <strong>Oil</strong> continues to pioneer oil sands development<br />
2012<br />
1978<br />
2020+<br />
1985
<strong>Oil</strong> sands – in-situ and mining<br />
<strong>Oil</strong> sands have been a major part of production volumes<br />
<strong>Imperial</strong>’s oil sands production*<br />
kbd<br />
200<br />
Syncrude<br />
Cold Lake<br />
• Patented in-situ recovery<br />
technology in 1960’s<br />
150<br />
100<br />
• In-situ pilots led to commercial<br />
development of Cold Lake<br />
50<br />
• Original owner of Syncrude<br />
0<br />
1980 1990 2000 2010<br />
* <strong>Imperial</strong> <strong>Oil</strong> interest before royalties
Added proved reserves<br />
Organic growth driving proved reserves growth<br />
Equivalent to almost 25 years of current production<br />
Billions oil equivalent barrels<br />
4<br />
• 2010 reserves 33% higher than 2000<br />
3<br />
• Added 1.7 billion boe of proved<br />
reserves<br />
2<br />
1<br />
additions<br />
production<br />
– Improved recovery<br />
– New projects<br />
0<br />
2000 2010<br />
• Produced 1.1 billion boe over the last<br />
decade<br />
* <strong>Imperial</strong> <strong>Oil</strong> interest after royalties
Added non-proved resource<br />
Non-proved resource – over 120 years of production coverage<br />
Billions oil equivalent barrels<br />
14<br />
• 2010 resource over 40% higher<br />
than 2000 through organic growth<br />
12<br />
10<br />
8<br />
6<br />
4<br />
additions<br />
converted to proved<br />
• Added 5.5 billion boe of new<br />
resource<br />
– Exploration<br />
– Delineation<br />
• $0.37 / boe finding cost<br />
2<br />
0<br />
2000 2010<br />
* <strong>Imperial</strong> <strong>Oil</strong> interest after royalties
High quality portfolio<br />
Development opportunities position us well for decades to come<br />
Proven Reserves / Non-proved Resource*<br />
billion<br />
oil equivalent barrels<br />
14<br />
mineable<br />
oil sands<br />
Athabasca<br />
8 GBO<br />
Syncrude<br />
12<br />
Kearl<br />
10<br />
8<br />
6<br />
mineable oil sands<br />
in-situ heavy oil<br />
conventional,<br />
incl. frontier<br />
Athabasca<br />
in-situ heavy oil<br />
3 GBO<br />
Cold Lake<br />
4<br />
2<br />
0<br />
2010 2010<br />
proved<br />
non-proved<br />
conventional,<br />
incl. frontier<br />
other Arctic<br />
East Coast<br />
2 GBO<br />
conventional oil<br />
and gas<br />
* after royalties<br />
Taglu
Adding to the resource base<br />
Employing latest technology to find large, high quality<br />
resource opportunities<br />
Over 500,000 acres added in the<br />
past 4 years at advantaged prices<br />
– Leveraged financial strength<br />
during market down-turn<br />
Includes:<br />
– Over 170,000 acres in the Horn<br />
River<br />
– <strong>Oil</strong> sands land<br />
– Shale gas and oil<br />
– 25% share of 1 million acres in the<br />
Beaufort Sea
<strong>Oil</strong> sands and gas resources drive production growth<br />
With a 40% growth in oil sands production by 2013, <strong>Imperial</strong> is well<br />
positioned to more than double Upstream production by 2020<br />
Production Outlook*<br />
kboed*<br />
600<br />
new gas<br />
400<br />
oil sands<br />
200<br />
oil<br />
sands<br />
0<br />
* <strong>Imperial</strong> <strong>Oil</strong> interest before royalties<br />
conventional<br />
2010 2013 2020<br />
conventional
Highly oil weighted<br />
<strong>Oil</strong> weighting to grow as oil sands developments come on stream<br />
Production*<br />
%<br />
100<br />
75<br />
Gas<br />
50<br />
<strong>Oil</strong><br />
25<br />
0<br />
2000 2005 2010 2015<br />
* <strong>Imperial</strong> <strong>Oil</strong> interest before royalties
Cold Lake – a premier in-situ asset<br />
With over 1 billion barrels already produced, Cold Lake is poised for<br />
another expansion and sustained production for decades to come<br />
Cold Lake production*<br />
kbd<br />
• Long-life, highly profitable,<br />
100% interest<br />
200<br />
160<br />
Mahihkan<br />
Mahkeses<br />
Nabiye<br />
• Technology development<br />
underpins recovery<br />
enhancement<br />
120<br />
80<br />
Pilots<br />
Maskwa<br />
• History of phased<br />
development<br />
Design one, build many<br />
40<br />
0<br />
1980 1990 2000 2010<br />
* before royalties<br />
future<br />
Plant
In-situ recovery enhancement<br />
Technology key to unlocking, sustaining and building in-situ production<br />
Demonstrated recovery<br />
(%) at Cold Lake<br />
60<br />
50<br />
40<br />
30<br />
20<br />
10<br />
• In-situ recovery enhancements<br />
– Late life cycle technologies<br />
– Liquid Addition to Steam for<br />
Enhanced Recovery (LASER)<br />
– Steam flood<br />
• Reserve add technologies<br />
– Solvent Assisted (SA)-SAGD<br />
– Cyclic Solvent Process (CSP)<br />
– Other breakthrough<br />
technologies<br />
0<br />
1977 1987 1997 2007-2012 2020+
LASER<br />
Liquid Addition to Steam for Enhanced Recovery now commercialized<br />
Improved recovery<br />
• Diluent injected with steam<br />
Cumulative <strong>Oil</strong> Produced<br />
LASER<br />
CSS<br />
Gain<br />
• Enhances recovery in later<br />
cycle wells<br />
• 2 cycle improvement:<br />
– About 35% increase in<br />
recovered oil<br />
1 2 3 4 5<br />
Years<br />
– Approximately 25%<br />
GHG reduction
Next generation technologies<br />
Pilot facilities installed and operating in Cold Lake to test three new<br />
recovery techniques<br />
Steam Flood<br />
existing CSS wells become<br />
producers only<br />
new steam<br />
infill injectors<br />
SA-SAGD (Solvent-Assisted SAGD)<br />
CSP (Cyclic Solvent Process)
Nabiye expansion at Cold Lake<br />
Using a proven staged development model, Nabiye is the next phase of<br />
growth at Cold Lake: + 30 kbd<br />
Nabiye<br />
Mineral Lease<br />
Approved Development Area<br />
Developed Pads<br />
Near Term Development
Syncrude – a premier mining asset<br />
Long-life asset with further potential<br />
IOL share production*<br />
kbd<br />
80<br />
60<br />
40<br />
20<br />
0<br />
2000 2002 2004 2006 2008 2010<br />
• Mining / upgrading joint venture<br />
– 25% <strong>Imperial</strong> ownership<br />
• Largest oil sands facility in the world<br />
– 10% of Canada’s oil production<br />
• Leadership and management services<br />
provided by <strong>Imperial</strong> & ExxonMobil<br />
• Current priority to improve reliability<br />
– Activities bearing fruit<br />
• Decades of additional production<br />
– 700 million barrels (IOL share) proved<br />
reserves ~ 25 years<br />
– >2 billion barrels (IOL share) non-proved<br />
* <strong>Imperial</strong> <strong>Oil</strong> interest before royalties
Kearl – a premier oil sands asset<br />
High-quality oil sands resource coupled with proprietary technology and<br />
world-class execution capability provide long-life earnings contribution<br />
ore grade (%)<br />
12.5<br />
12.0<br />
11.5<br />
11.0<br />
10.5<br />
10.0<br />
12<br />
Increasing Ore<br />
Quality<br />
11 10 9 8 7<br />
ratio of total volume to bitumen in-place<br />
industry-proposed projects<br />
Increasing Mining<br />
Efficiency<br />
superior projects<br />
Kearl Initial Development<br />
6<br />
Syncrude<br />
• <strong>Imperial</strong> <strong>Oil</strong>/ExxonMobil joint<br />
development<br />
- <strong>Imperial</strong> <strong>Oil</strong> 71%<br />
• Superior resource<br />
- Large (4.6 billion bbls); high quality<br />
- 345 kbd for about 40 years<br />
• No upgrader; proprietary<br />
technology<br />
• Lower operating cost<br />
source: owner data / regulatory applications<br />
resource and production before royalty adjustment
Kearl Initial Development<br />
The initial development is on schedule for start-up in late 2012<br />
Control<br />
Building<br />
Extraction<br />
Utilities<br />
• Over 65% complete<br />
- Detailed design and<br />
procurement<br />
complete<br />
- Fabrication 85%<br />
- Construction about<br />
50% complete<br />
South Tank Farm<br />
North Tank Farm<br />
Froth Treatment
Kearl 345 kbd – Initial Development + Expansion<br />
Design one, build many development plan<br />
kbd<br />
Kearl Development Plan<br />
400<br />
Regulatory Approval @ 345 kbd<br />
300<br />
200<br />
100<br />
0<br />
Expansion<br />
Initial Development<br />
• Reconfigured from 3 phases to Initial<br />
Development and Expansion<br />
• Incorporates Alberta’s Directive 74<br />
issued in 2009 for tailings reclamation<br />
• With 2 phases plus debottlenecking will<br />
achieved approved regulatory capacity<br />
of 345 kbd*<br />
• Different development plan incorporates<br />
new regulation and optimizes full<br />
resource development<br />
– $10.9 billion sanctioned for reconfigured<br />
initial development plan<br />
Full resource development cost remains at ~$5 / bbl<br />
* gross before royalties
Long-life asset<br />
High quality oil sands project with low unit development cost<br />
kbd<br />
400<br />
300<br />
200<br />
GOM<br />
Deepwater<br />
Kearl Comparison<br />
Expansion<br />
• Long-term plateau production<br />
profile<br />
100<br />
0<br />
40<br />
0<br />
Initial Development<br />
Revenue Components at 2010 <strong>Oil</strong> Price<br />
$ per OEB<br />
80<br />
Earnings /<br />
Government<br />
Take<br />
Bitumen<br />
Discount<br />
Operating<br />
Cost<br />
Development<br />
Kearl<br />
Source: Wood MacKenzie<br />
Earnings /<br />
Government<br />
Take<br />
Operating<br />
Development<br />
Cost<br />
Industry GOM<br />
Deepwater<br />
• Lower combined unit<br />
development and operating<br />
costs<br />
• Competitive with industry Gulf<br />
of Mexico deepwater<br />
developments
Unconventional shale gas<br />
Horn River area, British Columbia<br />
With ExxonMobil, large position at 340,000 net acres<br />
<strong>Imperial</strong> <strong>Oil</strong> / ExxonMobil
Horn River production pilot<br />
Field work underway to optimize productivity and cost structure<br />
HRP-H<br />
Experimental Scheme Outline<br />
HRP-G<br />
HRP-F<br />
HRP-E<br />
HRP-A<br />
HRP-B<br />
HRP-C<br />
HRP-D<br />
• Objective: establish full field<br />
business case<br />
- Demonstrate well productivity<br />
- Provide cost confidence<br />
- Assess well spacing<br />
• Scope<br />
- Central pad with 8 multi-frac wells<br />
- Pipeline to third party infrastructure<br />
• Start-up late 2012<br />
- 30 mcfd
Mackenzie gas project<br />
Objective – a commercially sound project<br />
USA<br />
<strong>Imperial</strong> <strong>Oil</strong>,<br />
Taglu<br />
Norman Wells<br />
Northwest Territories<br />
• National Energy Board approval<br />
a key milestone<br />
• Fiscal discussions with federal<br />
government pending<br />
Alberta<br />
the project:<br />
• 6 TCF natural gas, onshore from three fields<br />
(<strong>Imperial</strong> <strong>Oil</strong> 100% interest in Taglu; 3TCF)<br />
• gathering system, processing plant, and<br />
natural gas liquids pipeline to Norman Wells<br />
• natural gas pipeline to Alberta
Western Canada tight oil potential<br />
Potential for material position<br />
• Large legacy land position in the<br />
Western Canada Basin<br />
– Multiple plays exist over IOL lands<br />
• Industry active<br />
– Particularly Cardium Play<br />
– Horizontal multi-stage frac technology<br />
key to opening tight oil plays in<br />
historically active areas
Beaufort Sea<br />
Large, highly prospective opportunity<br />
• Cross-conveyed<br />
ExxonMobil, <strong>Imperial</strong> and<br />
BP positions<br />
– ExxonMobil operator<br />
• Participating in NEB<br />
Arctic drilling regulations<br />
process<br />
• Technical evaluations<br />
ongoing
Additional Athabasca acreage for 2020+<br />
Exciting mining and in-situ opportunities - next generation of advantaged<br />
production<br />
Kearl<br />
• Almost 250,000 acres<br />
Syncrude<br />
• Various interests<br />
Cold Lake
<strong>Imperial</strong> <strong>Oil</strong> – 2011 Investor Meeting<br />
Downstream and Chemical
2010 highlights<br />
Strong results in a challenging market<br />
• Strong financial performance<br />
– Earnings $0.4 billion<br />
– ROCE 13 %<br />
– Refinery throughput 444 kbd<br />
– Net petroleum product sales 442 kbd<br />
• Focus on operational excellence<br />
• Maintaining capital discipline<br />
• Results underpinned by technology, efficiency, integration and<br />
margin enhancement
Leader in refining, marketing, and chemicals<br />
Strong businesses in every segment<br />
• Refining & conversion capacity - #1<br />
• Fuels marketing – #2<br />
Strathcona<br />
downstream retail / distribution<br />
refinery<br />
lube blending plant<br />
chemicals operations<br />
Sarnia<br />
Dartmouth<br />
Nanticoke<br />
• Finished lube oil - #1<br />
• Solvents - #1<br />
• Asphalt - #1<br />
• Rotational molding polyethylene - #1
Downstream & Chemical industry environment<br />
Global demand steadily rising driven by developing countries;<br />
demand for refined products in North America flat to down<br />
Global<br />
– Product growth averages about 1% per<br />
year through 2030<br />
– Diesel demand growing, gasoline demand<br />
slowing<br />
– Specialty chemicals growth continuing<br />
North America<br />
– Product demand flat to down through 2030<br />
– Improved vehicle mpg and growing biofuel<br />
mandates offsets modest increase in<br />
vehicle fleet and miles driven<br />
– U.S. continues as largest import market
Downstream and Chemical strategies<br />
A culture of continuous improvement through Self-Help drives superior<br />
results<br />
• Relentless focus on best-in-class operations<br />
• Provide valued and high quality products and services to our<br />
customers<br />
• Lead industry in efficiency and effectiveness<br />
• Capitalize on integration across <strong>Imperial</strong> and ExxonMobil<br />
operations<br />
• Disciplined and selective investments for advantaged returns<br />
• Maximize value from technology leadership
North American refining capacity<br />
Business environment continues to be challenging<br />
• Capacity utilization currently the same as the early ’90’s
Leading Canadian refining capacity<br />
Value creation out of every barrel of crude oil<br />
Refining capacity (kbd)<br />
Husky<br />
conversion capacity*<br />
crude capacity<br />
• Largest refining and conversion<br />
capacity in Canada<br />
Suncor<br />
• Conversion capacity grown 17%<br />
since 1998<br />
<strong>Imperial</strong> <strong>Oil</strong><br />
0 100 200 300 400 500<br />
• Advantaged integration with<br />
chemicals and lubes<br />
* includes fluid catalytic cracking, hydrocracking and coking<br />
source: <strong>Oil</strong> & Gas Journal, 2010 Worldwide Refining Survey
Refining Self-Help<br />
Improving up-time is key to sustaining strong performance<br />
Indexed unplanned capacity loss and costs<br />
%<br />
120<br />
100<br />
80<br />
60<br />
40<br />
Total cost<br />
(ex energy price)<br />
Unplanned<br />
downtime<br />
• Continuous improvement<br />
employing global best<br />
practices<br />
• Reliable supplier<br />
• Reduce costs and<br />
improve energy efficiency<br />
20<br />
0<br />
2006 2007 2008 2009 2010
Refining – cost advantaged<br />
Relentless focus on operations<br />
120<br />
Energy intensity index<br />
110<br />
100<br />
90<br />
80<br />
Canada ex. IOL<br />
IOL<br />
120<br />
110<br />
Unit cash operating cost*<br />
Canada ex. IOL<br />
IOL<br />
2002 2004 2006 2008 2009 2010<br />
Personnel index<br />
100<br />
160<br />
140<br />
120<br />
Canada ex. IOL<br />
IOL<br />
90<br />
80<br />
2002 2004 2006 2008 2009 2010<br />
100<br />
80<br />
2002 2004 2006 2008 2009 2010<br />
• constant energy price and forex<br />
source: 2002-2008 Solomon, 2009, 2010 company data
Fuels Marketing structural advantage<br />
Integration with refining to maximize earnings<br />
industrial<br />
and<br />
wholesale<br />
retail<br />
• Strong brand<br />
• Market leader in all segments<br />
fuel sales<br />
• National network<br />
• Efficient supply chain<br />
marine /<br />
aviation<br />
• Low unit cash cost of operations
Fuels Marketing Self-Help<br />
Continually optimizing channels to markets<br />
selective investment<br />
asset restructuring<br />
improve productivity<br />
cost efficiency
Best-in-class retail operations<br />
Leader in productivity and cost<br />
Site productivity<br />
2000=100<br />
150<br />
125<br />
100<br />
best-in-class<br />
Retail cash cost<br />
2000=100<br />
150<br />
125<br />
100<br />
75<br />
50<br />
25<br />
0<br />
2000 2003 2007 2008 2009 2010<br />
75<br />
50<br />
25<br />
0<br />
best-in-class<br />
2000 2003 2007 2008 2009 2010<br />
• 49% increase in site productivity<br />
• Best-in-class costs<br />
• Continuous improvement focus<br />
source: 2000-2009 actual MJ Ervin & Associates Inc. essential indicators benchmarking series, 2010 data estimated
Retail offer<br />
Leading edge non-fuel offer drives revenue growth<br />
Retail fuels volume also growing<br />
Retail growth<br />
%<br />
140<br />
120<br />
Indexed retail non-fuel sales<br />
Indexed retail sales volume<br />
• Strong brand partnerships<br />
– Tim Hortons<br />
– Aeroplan<br />
– Royal Bank<br />
• Proprietary loyalty offers<br />
– Esso Extra<br />
100<br />
2006 2007 2008 2009 2010<br />
– Speedpass<br />
• Touchless car washes<br />
Tim Hortons is a registered trademark of the TDL Marks Corporation<br />
Aeroplan is a registered trademark of Aeroplan Limited Partnership<br />
Royal Bank is a registered trademark of Royal Bank of Canada
Lubricants and Specialties<br />
Growing flagship brands in Canada<br />
• Structurally advantaged with<br />
integrated manufacturing<br />
• Optimized supply chain<br />
• Canadian distributor for Mobil Super<br />
and leading synthetic, Mobil 1<br />
• Network of technical specialists
Lubricants – Synthetic growth rate<br />
Synthetic lubricants penetrating all parts of the lubricants market in Canada<br />
Mobil 1 volume growth since 2005<br />
cumulative growth<br />
%<br />
160<br />
140<br />
• Introduced Mobil Super in<br />
2008<br />
• Mobil Delvac 1 – synthetic<br />
for commercial vehicles<br />
also high growth rate<br />
120<br />
• 30% growth in passenger<br />
engine oil sales in 2010<br />
100<br />
2005 2006 2007 2008 2009 2010
Chemical business<br />
Anchored by a world class polyethylene plant with advantaged natural gas<br />
based feedstock<br />
Chemical profitability<br />
ROCE<br />
%<br />
60<br />
40<br />
20<br />
• Fully integrated with Sarnia<br />
refinery for flexibility to<br />
maximize overall earnings<br />
• Marcellus shale gas liquids<br />
opportunity for additional<br />
advantaged feedstock<br />
0<br />
2006 2007 2008 2009 2010
Chemical business<br />
High return business with growth opportunities<br />
Premium products<br />
% of total volume<br />
24<br />
22<br />
20<br />
• Growth in high margin /<br />
differentiated products<br />
• Fully optimized with<br />
ExxonMobil’s chemical<br />
business<br />
• Sarnia strategically located<br />
near customer base<br />
18<br />
16<br />
2004 2005 2006 2007 2008 2009 2010
Downstream and Chemical – business strategy<br />
Generating cash to fund Upstream growth<br />
Cumulative net cash generation<br />
billion $<br />
3<br />
• Source of cash<br />
2<br />
• Selectively invest for<br />
resilient, advantaged<br />
returns<br />
1<br />
• Technology synergies<br />
with the Upstream<br />
0<br />
2006 2007 2008 2009 2010
<strong>Imperial</strong> <strong>Oil</strong> – 2011 Investor Meeting<br />
Finance - Flexibility
Risk management<br />
Key focus of all levels of management<br />
• Operational excellence<br />
Strategic<br />
Operational<br />
Reputation<br />
Financial,<br />
Environmental,<br />
and Regulatory<br />
Performance<br />
Reporting<br />
Compliance<br />
• Cost focus<br />
• Credit management<br />
• Staged & disciplined development<br />
of projects and new technology<br />
• Long-term planning horizon over a<br />
range of prices<br />
• Carefully managed capital structure<br />
• Internal control systems
Consistent financial approach<br />
Consistent management approach focused on managing risks in a volatile<br />
commodity price environment<br />
• Disciplined identification and design of investment<br />
opportunities<br />
• Cash directed to fund attractive projects<br />
• Excellent project management and control<br />
• No special purpose entities<br />
• No derivatives<br />
• No hedging<br />
• Strong internal control systems - a competitive advantage
Governance and ethics<br />
7 member Board of Directors: five independent directors, 1 from<br />
ExxonMobil and 1 employee director<br />
• Ethics policy and business practices apply to all employees and<br />
directors<br />
• Full disclosure, straightforward and transparent reporting<br />
• Program depth and follow-through - a distinguishing feature
Operational excellence<br />
Continually improving base business, offsetting inflation<br />
Nominal overhead costs flat corporation wide since 2000<br />
Indexed cost above field<br />
%<br />
200<br />
150<br />
Efficiencies<br />
captured<br />
• Long term consistent focus on<br />
operating expense at the business and<br />
corporate level<br />
• Improved staff productivity by 25%<br />
100<br />
50<br />
• Hundreds of continuous improvement<br />
projects in all areas of the business<br />
actual<br />
actual<br />
0<br />
2000 2010
Operational excellence<br />
Total operating costs flat<br />
Total operating* cost<br />
billion $<br />
Upstream Downstream Chemical<br />
6<br />
• Efficiencies pursued in all segments<br />
and all business areas<br />
4<br />
• Adapt to the business environment<br />
• Improved reliability key<br />
2<br />
0<br />
2008 2009 2010<br />
* Production and manufacturing + selling and general
Cash utilization<br />
The first and best use of cash is to fund high quality investment<br />
opportunities<br />
billion $<br />
5<br />
4<br />
3<br />
2<br />
1<br />
Dividends<br />
Capital and Exploration<br />
Share Buy-backs<br />
Priorities<br />
• Dividends<br />
• Fund all quality<br />
opportunities<br />
• Develop advantaged<br />
projects<br />
• Share re-purchases<br />
0<br />
2006 2007 2008 2009 2010
Asset management<br />
Ongoing program to manage low performing assets – no writedowns<br />
Divestment proceeds<br />
million $<br />
300<br />
• Active management<br />
• Non-strategic<br />
200<br />
100<br />
• Near end of life conventional<br />
oil and gas properties<br />
0<br />
2006 2007 2008 2009 2010
Reliable and growing dividends<br />
Steady year over year growth in dividend payment<br />
Annual paid dividends per share<br />
$ / share<br />
0.50<br />
• Paid dividends each year for more<br />
than 110 years<br />
0.40<br />
0.30<br />
• Paid dividends per share increased<br />
each year since 1994<br />
0.20<br />
0.10<br />
• Paid dividends per share increased<br />
34% since 2006<br />
0.00<br />
2006 2007 2008 2009 2010
Solid financial position<br />
Retain balance sheet flexibility to take advantage of opportunities<br />
Debt to capital<br />
%<br />
50<br />
40<br />
30<br />
20<br />
10<br />
Cash flow<br />
billion $<br />
5<br />
4<br />
3<br />
2<br />
1<br />
• Progressed Kearl Initial<br />
Development when others<br />
stopped construction and<br />
delayed investments<br />
• Acquired shale gas and oil<br />
sands leases at attractive<br />
prices<br />
0<br />
0<br />
2006 2007 2008 2009 2010
Capex vs operating cash flow<br />
Cash flow largely providing funds for growth projects<br />
million $<br />
5000<br />
4000<br />
Capex<br />
• Cumulative cash flow well<br />
above capital requirements<br />
3000<br />
Actual cash flow<br />
• Some debt required in the<br />
short-term<br />
2000<br />
1000<br />
0<br />
2006 2007 2008 2009 2010 2011 2012
Financial strength enables growth<br />
<strong>Imperial</strong> <strong>Oil</strong> plans to spend $35 – 40 billion dollars this decade on Upstream<br />
growth projects<br />
Capital and exploration expense<br />
million $<br />
5000<br />
• Disciplined investment strategy<br />
– Resilience through business<br />
cycles<br />
4000<br />
3000<br />
• Supported by ExxonMobil project<br />
execution expertise<br />
2000<br />
• Retain balance sheet flexibility<br />
1000<br />
0<br />
2008 2009 2010 2011 2012+
Retaining balance sheet flexibility<br />
Even with growth in capital spending, retaining flexibility to take advantage<br />
of any opportunities that may arise and debt free by 2020<br />
Debt to capital<br />
%<br />
30<br />
20<br />
10<br />
oil @ $100 / bbl<br />
0<br />
2008<br />
2009<br />
2010<br />
2011<br />
2012<br />
2013<br />
2014<br />
2015<br />
2016<br />
2017<br />
2018<br />
2019<br />
2020
2011 Investor Meeting<br />
Summary<br />
Remarks
<strong>Imperial</strong> <strong>Oil</strong> – long term growth<br />
Relentless focus on maximizing long-term shareholder value<br />
Industry leadership through the business cycle<br />
• Canada’s leading portfolio of energy<br />
businesses, assets and opportunities<br />
• Continuous improvement of base<br />
business<br />
• Commitment to technology leadership<br />
• Superior financial strength and flexibility<br />
• Disciplined business risk management<br />
• Responsible development and operations
For more information<br />
www.imperialoil.ca.<br />
For more detailed investor information, or to<br />
receive annual and interim reports, please<br />
contact:<br />
Mark L. Stumpf<br />
Manager, Investor Relations/Planning & Analysis<br />
<strong>Imperial</strong> <strong>Oil</strong> Limited<br />
237 Fourth Avenue SW<br />
Calgary, Alberta T2P 3M9<br />
Email: mark.l.stumpf@esso.ca<br />
Phone: (403) 237-4537