A dynamically-packed planetary system around GJ 667C with ... - ESO
A dynamically-packed planetary system around GJ 667C with ... - ESO
A dynamically-packed planetary system around GJ 667C with ... - ESO

You also want an ePaper? Increase the reach of your titles
YUMPU automatically turns print PDFs into web optimized ePapers that Google loves.
Astronomy & Astrophysics manuscript no. aanda˙accepted c⃝ <strong>ESO</strong> 2013<br />
June 7, 2013<br />
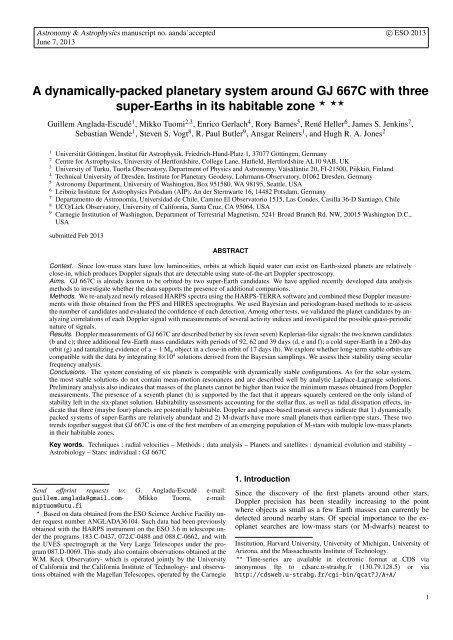
A <strong>dynamically</strong>-<strong>packed</strong> <strong>planetary</strong> <strong>system</strong> <strong>around</strong> <strong>GJ</strong> <strong>667C</strong> <strong>with</strong> three<br />
super-Earths in its habitable zone ⋆ ⋆⋆<br />
Guillem Anglada-Escudé 1 , Mikko Tuomi 2,3 , Enrico Gerlach 4 , Rory Barnes 5 , René Heller 6 , James S. Jenkins 7 ,<br />
Sebastian Wende 1 , Steven S. Vogt 8 , R. Paul Butler 9 , Ansgar Reiners 1 , and Hugh R. A. Jones 2<br />
1 Universität Göttingen, Institut für Astrophysik, Friedrich-Hund-Platz 1, 37077 Göttingen, Germany<br />
2 Centre for Astrophysics, University of Hertfordshire, College Lane, Hatfield, Hertfordshire AL10 9AB, UK<br />
3 University of Turku, Tuorla Observatory, Department of Physics and Astronomy, Väisäläntie 20, FI-21500, Piikkiö, Finland<br />
4 Technical University of Dresden, Institute for Planetary Geodesy, Lohrmann-Observatory, 01062 Dresden, Germany<br />
5 Astronomy Department, University of Washington, Box 951580, WA 98195, Seattle, USA<br />
6 Leibniz Institute for Astrophysics Potsdam (AIP), An der Sternwarte 16, 14482 Potsdam, Germany<br />
7 Departamento de Astronomía, Universidad de Chile, Camino El Observatorio 1515, Las Condes, Casilla 36-D Santiago, Chile<br />
8 UCO/Lick Observatory, University of California, Santa Cruz, CA 95064, USA<br />
9 Carnegie Institution of Washington, Department of Terrestrial Magnetism, 5241 Broad Branch Rd. NW, 20015 Washington D.C.,<br />
USA<br />
submitted Feb 2013<br />
ABSTRACT<br />
Context. Since low-mass stars have low luminosities, orbits at which liquid water can exist on Earth-sized planets are relatively<br />
close-in, which produces Doppler signals that are detectable using state-of-the-art Doppler spectroscopy.<br />
Aims. <strong>GJ</strong> <strong>667C</strong> is already known to be orbited by two super-Earth candidates. We have applied recently developed data analysis<br />
methods to investigate whether the data supports the presence of additional companions.<br />
Methods. We re-analyzed newly released HARPS spectra using the HARPS-TERRA software and combined these Doppler measurements<br />
<strong>with</strong> those obtained from the PFS and HIRES spectrographs. We used Bayesian and periodogram-based methods to re-assess<br />
the number of candidates and evaluated the confidence of each detection. Among other tests, we validated the planet candidates by analyzing<br />
correlations of each Doppler signal <strong>with</strong> measurements of several activity indices and investigated the possible quasi-periodic<br />
nature of signals.<br />
Results. Doppler measurements of <strong>GJ</strong> <strong>667C</strong> are described better by six (even seven) Keplerian-like signals: the two known candidates<br />
(b and c); three additional few-Earth mass candidates <strong>with</strong> periods of 92, 62 and 39 days (d, e and f); a cold super-Earth in a 260-day<br />
orbit (g) and tantalizing evidence of a ∼ 1 M ⊕ object in a close-in orbit of 17 days (h). We explore whether long-term stable orbits are<br />
compatible <strong>with</strong> the data by integrating 8×10 4 solutions derived from the Bayesian samplings. We assess their stability using secular<br />
frequency analysis.<br />
Conclusions. The <strong>system</strong> consisting of six planets is compatible <strong>with</strong> <strong>dynamically</strong> stable configurations. As for the solar <strong>system</strong>,<br />
the most stable solutions do not contain mean-motion resonances and are described well by analytic Laplace-Lagrange solutions.<br />
Preliminary analysis also indicates that masses of the planets cannot be higher than twice the minimum masses obtained from Doppler<br />
measurements. The presence of a seventh planet (h) is supported by the fact that it appears squarely centered on the only island of<br />
stability left in the six-planet solution. Habitability assessments accounting for the stellar flux, as well as tidal dissipation effects, indicate<br />
that three (maybe four) planets are potentially habitable. Doppler and space-based transit surveys indicate that 1) <strong>dynamically</strong><br />
<strong>packed</strong> <strong>system</strong>s of super-Earths are relatively abundant and 2) M-dwarfs have more small planets than earlier-type stars. These two<br />
trends together suggest that <strong>GJ</strong> <strong>667C</strong> is one of the first members of an emerging population of M-stars <strong>with</strong> multiple low-mass planets<br />
in their habitable zones.<br />
Key words. Techniques : radial velocities – Methods : data analysis – Planets and satellites : dynamical evolution and stability –<br />
Astrobiology – Stars: individual : <strong>GJ</strong> <strong>667C</strong><br />
Send offprint requests to: G. Anglada-Escudé e-mail:<br />
guillem.anglada@gmail.com- Mikko Tuomi, e-mail:<br />
miptuom@utu.fi<br />
⋆ Based on data obtained from the <strong>ESO</strong> Science Archive Facility under<br />
request number ANGLADA36104. Such data had been previously<br />
obtained <strong>with</strong> the HARPS instrument on the <strong>ESO</strong> 3.6 m telescope under<br />
the programs 183.C-0437, 072.C-0488 and 088.C-0662, and <strong>with</strong><br />
the UVES spectrograph at the Very Large Telescopes under the program<br />
087.D-0069. This study also contains observations obtained at the<br />
W.M. Keck Observatory- which is operated jointly by the University<br />
of California and the California Institute of Technology- and observations<br />
obtained <strong>with</strong> the Magellan Telescopes, operated by the Carnegie<br />
1. Introduction<br />
Since the discovery of the first planets <strong>around</strong> other stars,<br />
Doppler precision has been steadily increasing to the point<br />
where objects as small as a few Earth masses can currently be<br />
detected <strong>around</strong> nearby stars. Of special importance to the exoplanet<br />
searches are low-mass stars (or M-dwarfs) nearest to<br />
Institution, Harvard University, University of Michigan, University of<br />
Arizona, and the Massachusetts Institute of Technology.<br />
⋆⋆ Time-series are available in electronic format at CDS via<br />
anonymous ftp to cdsarc.u-strasbg.fr (130.79.128.5) or via<br />
http://cdsweb.u-strabg.fr/cgi-bin/qcat?J/A+A/<br />
1
Guillem Anglada-Escudé et al.: Three HZ super-Earths in a seven-planet <strong>system</strong><br />
the Sun. Since low-mass stars are intrinsically faint, the orbits<br />
at which a rocky planet could sustain liquid water on its surface<br />
(the so-called habitable zone, Kasting et al. 1993) are typically<br />
closer to the star, increasing their Doppler signatures even more.<br />
For this reason, the first super-Earth mass candidates in the habitable<br />
zones of nearby stars have been detected <strong>around</strong> M-dwarfs<br />
(e.g. <strong>GJ</strong> 581, Mayor et al. 2009; Vogt et al. 2010)).<br />
Concerning the exoplanet population detected to date, it is<br />
becoming clear that objects between 2 M ⊕ and the mass of<br />
Neptune (also called super-Earths) are very common <strong>around</strong> all<br />
G, K, and M dwarfs. Moreover, such planets tend to appear in<br />
close in/<strong>packed</strong> <strong>system</strong>s <strong>around</strong> G and K dwarfs (historically<br />
preferred targets for Doppler and transit surveys) <strong>with</strong> orbits<br />
closer in than the orbit of Mercury <strong>around</strong> our Sun. These features<br />
combined <strong>with</strong> a habitable zone closer to the star, point to<br />
the existence of a vast population of habitable worlds in multiplanet<br />
<strong>system</strong>s <strong>around</strong> M-dwarfs, especially <strong>around</strong> old/metaldepleted<br />
stars (Jenkins et al. 2013).<br />
<strong>GJ</strong> <strong>667C</strong> has been reported to host two (possibly three)<br />
super-Earths. <strong>GJ</strong> <strong>667C</strong>b is a hot super-Earth mass object in an<br />
orbit of 7.2 days and was first announced by Bonfils (2009). The<br />
second companion has an orbital period of 28 days, a minimum<br />
mass of about 4.5 M ⊕ and, in principle, orbits well <strong>with</strong>in the liquid<br />
water habitable zone of the star (Anglada-Escudé et al. 2012;<br />
Delfosse et al. 2012). The third candidate was considered tentative<br />
at the time owing to a strong periodic signal identified in two<br />
activity indices. This third candidate (<strong>GJ</strong> <strong>667C</strong>d) would have an<br />
orbital period between 74 and 105 days and a minimum mass of<br />
about 7 M ⊕ . Although there was tentative evidence for more periodic<br />
signals in the data, the data analysis methods used by both<br />
Anglada-Escudé et al. (2012) and Delfosse et al. (2012) studies<br />
were not adequate to properly deal <strong>with</strong> such high multiplicity<br />
planet detection. Recently, Gregory (2012) presented a Bayesian<br />
analysis of the data in Delfosse et al. (2012) and concluded that<br />
several additional periodic signals were likely present. The proposed<br />
solution, however, contained candidates <strong>with</strong> overlapping<br />
orbits and no check against activity or dynamics was done, casting<br />
serious doubts on the interpretation of the signals as planet<br />
candidates.<br />
Efficient/confident detection of small amplitude signals requires<br />
more specialized techniques than those necessary to detect<br />
single ones. This was made explicitly obvious in, for example,<br />
the re-analysis of public HARPS data on the M0V star<br />
<strong>GJ</strong> 676A. In addition to the two signals of gas giant planets<br />
reported by Forveille et al. (2011), Anglada-Escudé & Tuomi<br />
(2012) (AT12 hereafter) identified the presence of two very significant<br />
low-amplitude signals in closer-in orbits. One of the<br />
main conclusions of AT12 was that correlations of signals already<br />
included in the model prevent detection of additional lowamplitude<br />
using techniques based on the analysis of the residuals<br />
only. In AT12, it was also pointed out that the two additional<br />
candidates (<strong>GJ</strong> 676A d and e) could be confidently detected <strong>with</strong><br />
30% less measurements using Bayesian based methods.<br />
In this work, we assess the number of Keplerian-like signals<br />
<strong>around</strong> <strong>GJ</strong> <strong>667C</strong> using the same analysis methods as in<br />
Anglada-Escudé & Tuomi (2012). The basic data consists of 1)<br />
new Doppler measurements obtained <strong>with</strong> the HARPS-TERRA<br />
software on public HARPS spectra of <strong>GJ</strong> <strong>667C</strong> (see Delfosse<br />
et al. 2012, for a more detailed description of the dataset), and<br />
2) Doppler measurements from PFS/Magellan and HIRES/Keck<br />
spectrometers (available in Anglada-Escudé & Butler 2012). We<br />
give an overview of <strong>GJ</strong> <strong>667C</strong> as a star and provide updated parameters<br />
in Section 2. The observations and data-products used<br />
in later analyses are described in Section 3. Section 4 describes<br />
our statistical tools, models and the criteria used to quantify<br />
the significance of each detection (Bayesian evidence ratios and<br />
log–likelihood periodograms). The sequence and confidences of<br />
the signals in the Doppler data are given in section 5 where<br />
up to seven planet-like signals are spotted in the data. To promote<br />
Doppler signals to planets, such signals must be validated<br />
against possible correlations <strong>with</strong> stellar activity. In section 6,<br />
we discuss the impact of stellar activity on the significance of<br />
the signals (especially on the <strong>GJ</strong> <strong>667C</strong>d candidate) and we conclude<br />
that none of the seven candidates is likely to be spurious. In<br />
section 7, we investigate if all signals were detectable in subsets<br />
of the HARPS dataset to rule out spurious detections from quasiperiodic<br />
variability caused by stellar activity cycles. We find that<br />
all signals except the least significant one are robustly present in<br />
both the first and second-halves of the HARPS observing campaign<br />
independently. A dynamical analysis of the Bayesian posterior<br />
samples finds that a subset of the allowed solutions leads<br />
to long-term stable orbits. This verification steps allows us promoting<br />
the first six signals to the status of planet candidates. In<br />
Section 8 we also investigate possible mean-motion resonances<br />
(MMR) and mechanisms that guarantee long-term stability of<br />
the <strong>system</strong>. Given that the proposed <strong>system</strong> seems physically viable,<br />
we discusses potential habitability of each candidate in the<br />
context of up-to-date climatic models, possible formation history,<br />
and the effect of tides in Section 9. Concluding remarks<br />
and a summary are given in Section 10. The appendices describe<br />
additional tests performed on the data to double-check the significance<br />
of the planet candidates.<br />
2. Properties of <strong>GJ</strong> <strong>667C</strong><br />
<strong>GJ</strong> <strong>667C</strong> (HR 6426 C), has been classified as an M1.5V (Geballe<br />
et al. 2002) and is a member of a triple star <strong>system</strong>. The star<br />
is a common proper motion companion to the K3V+K5V binary<br />
<strong>GJ</strong> 667AB. Assuming the HIPPARCOS distance to the<br />
<strong>GJ</strong> 667AB binary (∼ 6.8 pc van Leeuwen 2007), the projected<br />
separation between <strong>GJ</strong> <strong>667C</strong> and <strong>GJ</strong> 667AB is ∼ 230 AU. The<br />
metallicity of the <strong>GJ</strong> 667AB binary has spectroscopically measured<br />
to be lower than the Sun (Fe/H = -0.59±0.10 Cayrel de<br />
Strobel 1981). The galactic kinematics of <strong>GJ</strong> 667 are compatible<br />
<strong>with</strong> both thin and thick disk populations and there is no clear<br />
match to any known moving group or stream (Anglada-Escudé<br />
et al. 2012). Spectrocopic studies of the <strong>GJ</strong> 667AB pair (Cayrel<br />
de Strobel 1981) show that the AB pair is well <strong>with</strong>in the main<br />
sequence, indicating an age between 2 and 10 Gyr. Following<br />
the simple models in Reiners & Mohanty (2012), the low activity<br />
and the estimate of the rotation period of <strong>GJ</strong> <strong>667C</strong> (P><br />
100 days, see Section 6) also support an age of > 2 Gyr. In conclusion,<br />
while the age of the <strong>GJ</strong> 667 <strong>system</strong> is uncertain everything<br />
indicates that the <strong>system</strong> is old.<br />
We performed a spectroscopic analysis of <strong>GJ</strong> <strong>667C</strong> using<br />
high resolution spectra obtained <strong>with</strong> the UVES/VLT spectrograph<br />
(program 87.D-0069). Both the HARPS and the UVES<br />
spectra show no H α emission. The value of the mean S-index<br />
measurement (based on the intensity of the CaII H+K emission<br />
lines) is 0.48 ± 0.02, which puts the star among the most inactive<br />
objects in the HARPS M-dwarf sample (Bonfils et al. 2011).<br />
By comparison, <strong>GJ</strong> 581(S=0.45) and <strong>GJ</strong> 876 (S=0.82) are RVstable<br />
enough to detect multiple low-mass planets <strong>around</strong> them,<br />
while slightly more active stars like <strong>GJ</strong> 176 (S=1.4) are stable<br />
enough to detect one low-mass companion at least. Very active<br />
and rapidly rotating M-dwarfs, such <strong>GJ</strong> 388 (AD Leo) or <strong>GJ</strong> 803<br />
(AU Mic), have S-index values as high as 3.7 and 7.8, respectively.<br />
A low activity level allows one to use a large number of<br />
2
Guillem Anglada-Escudé et al.: Three HZ super-Earths in a seven-planet <strong>system</strong><br />
Table 1. Parameter space covered by the grid of synthetic models.<br />
Range Step size<br />
T eff [K] 2,300 – 5,900 100<br />
log(g) 0.0 – +6.0 0.5<br />
[Fe/H] -4.0 – -2.0 1.0<br />
-2.0 – +1.0 0.5<br />
atomic and molecular lines for the spectral fitting <strong>with</strong>out accounting<br />
for magnetic and/or rotational broadening. UVES observations<br />
of <strong>GJ</strong> <strong>667C</strong> were taken in service mode in three exposures<br />
during the night on August 4th 2011. The high resolution<br />
mode <strong>with</strong> a slit width of 0.3” was used to achieve a resolving<br />
power of R ∼ 100 000. The observations cover a wavelength<br />
range from 640 nm to 1020 nm on the two red CCDs.<br />
Spectral extraction and reduction was done using the<br />
<strong>ESO</strong>REX pipeline for UVES. The wavelength solution is based,<br />
to first order, on the Th-Ar calibration provided by <strong>ESO</strong>. All orders<br />
were corrected for the blaze function and also normalized<br />
to unity continuum level. Afterwards, all orders were merged together.<br />
For overlapping orders the redder ends were used due to<br />
their better quality. In a last step, an interactive removal of bad<br />
pixels and cosmic ray hits was performed.<br />
The adjustment consists of matching the observed spectrum<br />
to a grid of synthetic spectra from the newest PHOENIX/ACES<br />
grid (see Husser et al. 2013)). The new codes use a new equation<br />
of state that accounts for the molecular formation rates<br />
at low temperatures. Hence, it is optimally suited for simulation<br />
of spectra of cool stars. The 1D models are computed in<br />
plane parallel geometry and consist of 64 layers. Convection is<br />
treated in mixing-length geometry and from the convective velocity<br />
a micro-turbulence velocity (Edmunds 1978) is deduced<br />
via v mic = 0.5 · v conv . The latter is used in the generation of the<br />
synthetic high resolution spectra. An overview of the model grid<br />
parameters is shown in Table 1. Local thermal equilibrium is assumed<br />
in all models.<br />
First comparisons of these models <strong>with</strong> observations show<br />
that the quality of computed spectra is greatly improved in comparison<br />
to older versions. The problem in previous versions of<br />
the PHOENIX models was that observed spectra in the ϵ- and γ-<br />
TiO bands could not be reproduced assuming the same effective<br />
temperature parameter (Reiners 2005). The introduction of the<br />
new equation of state apparently resolved this problem. The new<br />
models can consistently reproduce both TiO absorption bands<br />
together <strong>with</strong> large parts of the visual spectrum at very high fidelity<br />
(see Fig. 1).<br />
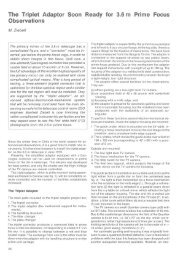
As for the observed spectra, the models in our grid are also<br />
normalized to the local continuum. The regions selected for the<br />
fit were chosen as unaffected by telluric contamination and are<br />
marked in green in Fig. 1. The molecular TiO bands in the region<br />
between 705 nm to 718 nm (ϵ-TiO) and 840 nm to 848 nm (γ-<br />
TiO) are very sensitive to T eff but almost insensitive to log g. The<br />
alkali lines in the regions between 764 nm to 772 nm and 816 nm<br />
to 822 nm (K- and Na-atomic lines, respectively) are sensitive to<br />
log g and T eff . All regions are sensitive to metallicity. The simultaneous<br />
fit of all the regions to all three parameters breaks the<br />
degeneracies, leading to a unique solution of effective temperature,<br />
surface gravity and metallicity.<br />
As the first step, a three dimensional χ 2 -map is produced to<br />
determine start values for the fitting algorithm. Since the model<br />
grid for the χ 2 -map is discrete, the real global minimum is likely<br />
to lie between grid points. We use the parameter sets of the three<br />
smallest χ 2 -values as starting points for the adjustment proce-<br />
Table 2. Stellar parameters of <strong>GJ</strong> <strong>667C</strong><br />
Parameters Value Ref.<br />
R.A. 17 18 57.16 1<br />
Dec -34 59 23.14 1<br />
µ R.A. [mas yr −1 ] 1129.7(9.7) 1<br />
µ Dec. [mas yr −1 ] -77.0(4.6) 1<br />
Parallax [mas] 146.3(9.0) 1<br />
Hel. RV [km s −1 ] 6.5(1.0) 2<br />
V [mag] 10.22(10) 3<br />
J [mag] 6.848(21) 4<br />
H [mag] 6.322(44) 4<br />
K [mag] 6.036(20) 4<br />
T e f f [K] 3350(50) 5<br />
[Fe/H] -0.55(10) 5<br />
log g [g in cm s −1 ] 4.69(10) 5<br />
Derived quantities<br />
UVW LSR [km s −1 ] (19.5, 29.4,-27.2) 2<br />
Age estimate > 2 Gyr 5<br />
Mass [M ⊙ ] 0.33(2) 5<br />
L ∗ /L ⊙ 0.0137(9) 2<br />
References. (1) van Leeuwen (2007); (2)Anglada-Escudé et al. (2012);<br />
(3) Mermilliod (1986); (4) Skrutskie et al. (2006); (5) This work (see<br />
text)<br />
dure. We use the IDL curvefit-function as the fitting algorithm.<br />
Since this function requires continuous parameters, we use three<br />
dimensional interpolation in the model spectra. As a fourth free<br />
parameter, we allow the resolution of the spectra to vary in order<br />
to account for possible additional broadening (astrophysical<br />
or instrumental). For this star, the relative broadening is always<br />
found to be < 3% of the assumed resolution of UVES, and is<br />
statistically indistinguishable from 0. More information on the<br />
method and first results on a more representative sample of stars<br />
will be given in a forthcoming publication.<br />
As already mentioned, the distance to the <strong>GJ</strong> 667 <strong>system</strong><br />
comes from the HIPPARCOS parallax of the <strong>GJ</strong> 667AB pair<br />
and is rather uncertain (see Table 2). This combined <strong>with</strong> the<br />
luminosity-mass calibrations in Delfosse et al. (2000) propagates<br />
into a rather uncertain mass (0.33±0.02 M ⊙ ) and luminosity estimates<br />
(0.0137 ± 0.0009 L ⊙ ) for <strong>GJ</strong> <strong>667C</strong> (Anglada-Escudé et al.<br />
2012). A good trigonometric parallax measurement and the direct<br />
measurement of the size of <strong>GJ</strong> <strong>667C</strong> using interferometry<br />
(e.g. von Braun et al. 2011) are mostly needed to refine its fundamental<br />
parameters. The updated values of the spectroscopic<br />
parameters are slightly changed from previous estimates. For example,<br />
the effective temperature used in Anglada-Escudé et al.<br />
(2012) was based on evolutionary models using the stellar mass<br />
as the input which, in turn, is derived from the rather uncertain<br />
parallax measurement of the <strong>GJ</strong> 667 <strong>system</strong>. If the spectral type<br />
were to be understood as a temperature scale, the star should be<br />
classified as an M3V-M4V instead of the M1.5V type assigned<br />
in previous works (e.g. Geballe et al. 2002). This mismatch is<br />
a well known effect on low metallicity M dwarfs (less absorption<br />
in the optical makes them to be an earlier type than solar<br />
metallicity stars <strong>with</strong> the same effective temperature). The spectroscopically<br />
derived parameters and other basic properties collected<br />
from the literature are listed in Table 2.<br />
3
Guillem Anglada-Escudé et al.: Three HZ super-Earths in a seven-planet <strong>system</strong><br />
Fig. 1. Snapshots of the wavelength regions used in the spectral fit to the UVES spectrum of <strong>GJ</strong> <strong>667C</strong>. The observed spectrum is represented in<br />
black, the green curves are the parts of the synthetic spectrum used in the fit. The red lines are also from the synthetic spectrum that were not used<br />
to avoid contamination by telluric features or because they did not contain relevant spectroscopic information. Unfitted deep sharp lines- especially<br />
on panels four and five from the top of the page- are non-removed telluric features.<br />
3. Observations and Doppler measurements<br />
A total of 173 spectra obtained using the HARPS spectrograph<br />
(Pepe et al. 2002) have been re-analyzed using the HARPS-<br />
TERRA software (Anglada-Escudé & Butler 2012). Most of the<br />
spectra (171) were extracted from the <strong>ESO</strong> archives and have<br />
been obtained by other groups over the years (e.g., Delfosse<br />
et al. 2012). To increase the baseline to probe longer period<br />
candidates, two more HARPS observations were obtained between<br />
April and June 2012. In addition to this, three activity<br />
indices were also extracted from the HARPS spectra. These are:<br />
the S-index (proportional to the chromospheric emission of the<br />
star), the full-width-at-half-maximum of the mean line profile<br />
4
Guillem Anglada-Escudé et al.: Three HZ super-Earths in a seven-planet <strong>system</strong><br />
(or FWHM, a measure of the width of the mean stellar line)<br />
and the line bisector (or BIS, a measure of asymmetry of the<br />
mean stellar line). All these quantities might correlate <strong>with</strong> spurious<br />
Doppler offsets caused by stellar activity. In this sense,<br />
any Doppler signal <strong>with</strong> a periodicity compatible <strong>with</strong> any of<br />
these signals will be considered suspicious and will require a<br />
more detailed analysis. The choice of these indices is not arbitrary.<br />
Each of them is thought to be related to an underlying<br />
physical process that can cause spurious Doppler offsets. For example,<br />
S-index variability typically maps the presence of active<br />
regions on the stellar surface and variability of the stellar magnetic<br />
field (e.g., solar-like cycles). The line bisector and FWHM<br />
should have the same period as spurious Doppler signals induced<br />
by spots corotating <strong>with</strong> the star (contrast effects combined <strong>with</strong><br />
stellar rotation, suppression of convection due to magnetic fields<br />
and/or Zeeman splitting in magnetic spots). Some physical processes<br />
induce spurious signals at some particular spectral regions<br />
(e.g., spots should cause stronger offsets at blue wavelengths).<br />
The Doppler signature of a planet candidate is constant over all<br />
wavelengths and, therefore, a signal that is only present at some<br />
wavelengths cannot be considered a credible candidate. This feature<br />
will be explored below to validate the reality of some of the<br />
proposed signals. A more comprehensive description of each index<br />
and their general behavior in response to stellar activity can<br />
be found elsewhere (Baliunas et al. 1995; Lovis et al. 2011).<br />
In addition to the data products derived from HARPS observations,<br />
we also include 23 Doppler measurements obtained using<br />
the PFS/Magellan spectrograph between June 2011 and October<br />
2011 using the Iodine cell technique <strong>with</strong> the Magellan/PFS<br />
spectrograph, and the 22 HIRES/Keck Doppler measurements<br />
(both RV sets are given in Anglada-Escudé & Butler 2012). The<br />
HARPS-Data Reduction Software (DRS from now on) also produces<br />
Doppler measurements using the so–called cross correlation<br />
method (or CCF). In the Appendices, we show that the CCF-<br />
Doppler measurements actually contain the same seven signals<br />
providing indirect confirmation and lending further confidence<br />
to the detections.<br />
4. Statistical and physical models<br />
The basic model of radial velocity data of a single telescopeinstrument<br />
combination is a sum of k Keplerian signals, <strong>with</strong> k<br />
= 0, 1, ..., a random variable describing the instrument noise, and<br />
another one describing all the excess noise in the data. The latter<br />
noise term, sometimes referred to as stellar RV jitter (Ford<br />
2005), includes the noise originating from the stellar surface<br />
due to inhomogeneities, activity-related phenomena, and can<br />
also include instrumental <strong>system</strong>atic effects. Following Tuomi<br />
(2011), we model these noise components as Gaussian random<br />
variables <strong>with</strong> zero mean and variances of σ 2 i<br />
and σ 2 l , where<br />
the former is the formal uncertainty in each measurement and<br />
the latter is the jitter that is treated as a free parameter of the<br />
model (one for each instrument l). Because radial velocity variations<br />
have to be calculated <strong>with</strong> respect to some reference velocity,<br />
we use a parameter γ l that describes this reference velocity<br />
<strong>with</strong> respect to the data mean of a given instrument. For several<br />
telescope/instrument combinations, the Keplerian signals must<br />
necessarily be the same but the parameters γ l (reference velocity)<br />
and σ 2 l<br />
(jitter) cannot be expected to have the same values.<br />
Finally, the model also includes a linear trend ˙γ to account for<br />
very long period companions (e.g., the acceleration caused by<br />
the nearby <strong>GJ</strong> 667AB binary). This model does not include mutual<br />
interactions between planets, which are known to be significant<br />
in some cases (e.g. <strong>GJ</strong> 876, Laughlin & Chambers 2001). In<br />
this case, the relatively low masses of the companions combined<br />
<strong>with</strong> the relatively short time span of the observations makes<br />
these effects too small to have noticeable impact on the measured<br />
orbits. Long-term dynamical stability information is incorporated<br />
and discussed in a later step (see Section 8). Explicitly,<br />
the baseline model for the RV observations is<br />
v l (t i ) = γ l + ˙γ (t i − t 0 ) +<br />
k∑<br />
[ ]<br />
f (t i , β j ) + g l ψ; ti , z i , t i−1 , r i−1 , (1)<br />
j=1<br />
where t 0 is some reference epoch (which we arbitrarily choose<br />
as t 0 =2450000 JD), g is a function describing the specific noise<br />
properties (instrumental and originating from the star) of the l-<br />
th instrument on top of the estimated Gaussian uncertainties. We<br />
model this function using first order moving average (MA) terms<br />
Tuomi et al. (2013, 2012) that depend on correlation terms <strong>with</strong><br />
activity indices (denoted as z i ) and on the residual r i−1 to the<br />
previous measurement at t i−1 . This component is typically parameterized<br />
using one or more “nuisance parameters” ψ that are<br />
also treated as free parameters of the model. Function f represents<br />
the Doppler model of a planet candidate <strong>with</strong> parameters β j<br />
(Period P j , Doppler semi-amplitude K j , mean anomaly at reference<br />
epoch M 0, j , eccentricity e j , and argument of the periastron<br />
ω j ).<br />
The Gaussian white noise component of each measurement<br />
and the Gaussian jitter component associated to each instrument<br />
enter the model in the definition of the likelihood function L as<br />
L(m|θ) =<br />
N∏<br />
i=1<br />
⎧<br />
1 ⎪⎨ − [ m i − v l (t i ) ] 2 ⎫<br />
⎪ ⎬<br />
exp<br />
√2π(σ 2 i<br />
+ σ 2 l ) ⎪⎩ 2(σ 2 i<br />
+ σ 2 l ) ⎪ ⎭ , (2)<br />
where m stands for data and N is the number of individual measurements.<br />
With these definitions, the posterior probability density<br />
π(θ|m) of parameters θ given the data m (θ includes the orbital<br />
elements β j , the slope term ˙γ, the instrument dependent<br />
constant offsets γ l , the instrument dependent jitter terms σ l , and<br />
a number of nuisance parameters ψ), is derived from the Bayes’<br />
theorem as<br />
π(θ|m) =<br />
L(m|θ)π(θ)<br />
∫<br />
L(m|θ)π(θ)dθ<br />
. (3)<br />
This equation is where the prior information enters the model<br />
through the choice of the prior density functions π(θ). This way,<br />
the posterior density π(θ|m) combines the new information provided<br />
by the new data m <strong>with</strong> our prior assumptions for the parameters.<br />
In a Bayesian sense, finding the most favored model<br />
and allowed confidence intervals consists on the identification<br />
and exploration of the higher probability regions of the posterior<br />
density. Unless the model of the observations is very simple<br />
(e.g., linear models), a closed form of π(θ|m) cannot be derived<br />
analytically and numerical methods are needed to explore<br />
its properties. The description of the adopted numerical methods<br />
are the topic of the next subsection.<br />
4.1. Posterior samplings and Bayesian detection criteria<br />
Given a model <strong>with</strong> k Keplerian signals, we draw statistically<br />
representative samples from the posterior density of the model<br />
parameters (Eq. 3) using the adaptive Metropolis algorithm<br />
Haario et al. (2001). This algorithm has been used successfully<br />
in e.g. Tuomi (2011), Tuomi et al. (2011) and Anglada-Escudé<br />
5
Guillem Anglada-Escudé et al.: Three HZ super-Earths in a seven-planet <strong>system</strong><br />
& Tuomi (2012). The algorithm appears to be a well suited to<br />
the fitting of Doppler data in terms of its relatively fast convergence<br />
– even when the posterior is not unimodal (Tuomi 2012)<br />
– and it provides samples that represent well the posterior densities.<br />
We use these samples to locate the regions of maximum<br />
a posteriori probability in the parameter space and to estimate<br />
each parameter confidence interval allowed by the data. We describe<br />
the parameter densities briefly by using the maximum<br />
a posteriori probability (MAP) estimates as the most probable<br />
values, i.e. our preferred solution, and by calculating the 99%<br />
Bayesian credibility sets (BCSs) surrounding these estimates.<br />
Because of the caveats of point estimates (e.g., inability to describe<br />
the shapes of posterior densities in cases of multimodality<br />
and/or non-negligible skewness), we also plot marginalized<br />
distributions of the parameters that are more important from a<br />
detection and characterization point of view, namely, velocity<br />
semi-amplitudes K j , and eccentricities e j .<br />
The availability of samples from the posterior densities of<br />
our statistical models also enables us to take advantage of the<br />
signal detection criteria given in Tuomi (2012). To claim that a<br />
signal is a significant one, we require that 1) its period is wellconstrained<br />
from above and below, 2) its RV amplitude has a<br />
density that differs from zero significantly (excluded from the<br />
99% credibility intervals), and 3) the posterior probability of the<br />
model containing k+1 signals must be (at least) 150 times greater<br />
than that of the model containing only k signals.<br />
The threshold of 150 on condition (3) might seem arbitrary.<br />
Admitting that posterior probabilities also have uncertainties<br />
(Jenkins & Peacock 2011), we consider that such threshold is<br />
the minimum safe one. As made explicit in the definition of the<br />
posterior density function π(θ|m), the likelihood function is not<br />
the only source of information. We take into account the fact<br />
that all parameter values are not equally probable prior to making<br />
the measurements via prior probability densities. Essentially,<br />
our priors are chosen as in Tuomi (2012). Of special relevance<br />
in the detection process is the prior choice for the eccentricities.<br />
Our functional choice for it (Gaussian <strong>with</strong> zero mean and σ e =<br />
0.3) is based on statistical, dynamical and population considerations<br />
and it is discussed further in the appendices (Appendix A).<br />
For more details on different prior choices, see dedicated discussion<br />
in Tuomi & Anglada-Escudé (2013).<br />
4.2. Log–Likelihood periodograms<br />
Because the orbital period (or frequency) is an extremely nonlinear<br />
parameter, the orbital solution of a model <strong>with</strong> k + 1<br />
signals typically contains many hundreds or thousands of local<br />
likelihood maxima (also called independent frequencies). In any<br />
method based on stochastic processes, there is always a chance<br />
that the global maxima of the target function is missed. Our<br />
log–likelihood periodogram (or log–L periodogram) is a tool<br />
to <strong>system</strong>atically identify periods for new candidate planets of<br />
higher probability and ensure that these areas have been well explored<br />
by the Bayesian samplings (e.g., we always attempt to<br />
start the chains close to the five most significant periodicities<br />
left in the data). A log–L periodogram consists on computing<br />
the improvement of the logarithm of the likelihood (new model<br />
<strong>with</strong> k + 1 planets) compared to the logarithm of the likelihood<br />
of the null hypothesis (only k planets) at each test period. Log–<br />
L periodograms are represented as period versus ∆ log L plot,<br />
where log is always the natural logarithm. The definition of the<br />
likelihood function we use is in Eq. 2 and typically assumes<br />
Gaussian noise sources only (that is, different jitter parameters<br />
are included for each instrument and g=0 in Eq. 1).<br />
∆log L<br />
∆log L<br />
∆log L<br />
∆log L<br />
∆log L<br />
∆log L<br />
∆log L<br />
100<br />
80<br />
60<br />
40<br />
20<br />
40<br />
30<br />
20<br />
10<br />
40<br />
30<br />
20<br />
10<br />
0<br />
20<br />
10<br />
20<br />
15<br />
10<br />
5<br />
20<br />
15<br />
10<br />
5<br />
0<br />
10<br />
5<br />
0<br />
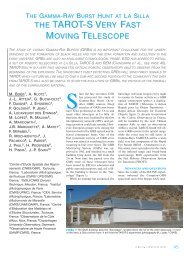
7.2 days<br />
b<br />
? 17 days<br />
(h)<br />
28.1 days<br />
c<br />
39 days<br />
f<br />
91 days<br />
d<br />
62 days<br />
e<br />
260 days<br />
g<br />
(all circular)<br />
10 100 1000<br />
Period [days]<br />
Fig. 2. Log–likelihood periodograms for the seven candidate signals<br />
sorted by significance. While the first six signals are easily spotted,<br />
the seventh is only detected <strong>with</strong> log–L periodograms if all orbits are<br />
assumed to be circular.<br />
∆ log L can also be used for estimating the frequentist false<br />
alarm probability (FAP) of a solution using the likelihood-ratio<br />
test for nested models. This FAP estimates what fraction of<br />
times one would recover such a significant solution by an unfortunate<br />
arrangement of Gaussian noise. To compute this FAP<br />
from ∆ log L we used the up-to-date recipes provided by Baluev<br />
(2009). We note that that maximization of the likelihood involves<br />
solving for many parameters simultaneous: orbital parameters<br />
of the new candidate, all orbital parameters of the already<br />
detected signals, a secular acceleration term ˙γ, a zero-point<br />
γ l for each instrument, and jitter terms σ l of each instrument<br />
(see Eq. 1). It is, therefore, a computationally intensive task,<br />
especially when several planets are included and several thousand<br />
of test periods for the new candidate must be explored. As<br />
discussed in the appendices (see Section A.1), allowing for full<br />
Keplerian solutions at the period search level makes the method<br />
very prone to false positives. Therefore while a full Keplerian<br />
solution is typically assumed for all the already detected k-<br />
candidates, the orbital model for the k + 1-candidate is always<br />
assumed to be circular in our standard setup. This way, our log–L<br />
periodograms represent a natural generalization of more classic<br />
hierarchical periodogram methods. This method was designed<br />
to account for parameter correlations at the detection level. If<br />
such correlations are not accounted for, the significance of new<br />
signals can be strongly biased causing both false positives and<br />
missed detections. In the study of the planet hosting M-dwarf<br />
<strong>GJ</strong> 676A (Anglada-Escudé & Tuomi 2012) and in the more recent<br />
manuscript on <strong>GJ</strong> 581 (Tuomi & Jenkins 2012), we have<br />
shown that -while log–L periodograms represent an improve-<br />
6
Guillem Anglada-Escudé et al.: Three HZ super-Earths in a seven-planet <strong>system</strong><br />
Table 3. Relative posterior probabilities and log-Bayes factors of models<br />
M k <strong>with</strong> k Keplerian signals given the combined HARPS-TERRA,<br />
HIRES, and PFS RV data of <strong>GJ</strong> <strong>667C</strong>. Factor ∆ indicates how much<br />
the probability increases <strong>with</strong> respect to the best model <strong>with</strong> one less<br />
Keplerian and P denotes the MAP period estimate of the signal added<br />
to the solution when increasing k. Only the highest probability sequence<br />
is shown here (reference solution). A complete table <strong>with</strong> alternative solutions<br />
corresponding to local probability maxima is given in Appendix<br />
B.2<br />
k P(M k |d) ∆ log P(d|M k ) P [days] ID<br />
0 2.7×10 −85 – -602.1 –<br />
1 3.4×10 −48 1.3×10 37 -516.0 7.2<br />
2 1.3×10 −35 3.9×10 12 -486.3 91<br />
3 8.9×10 −18 6.7×10 17 -444.5 28<br />
4 1.9×10 −14 2.1×10 3 -436.2 53<br />
4 1.2×10 −14 1.3×10 3 -436.7 62<br />
5 1.0×10 −7 5.5×10 6 -420.0 39, 53<br />
5 1.0×10 −8 5.3×10 5 -422.3 39, 62<br />
6 4.1×10 −3 4.0×10 4 -408.7 39, 53, 256<br />
6 4.1×10 −4 4.0×10 3 -411.0 39, 62, 256<br />
7 0.057 14 -405.4 17, 39, 53, 256<br />
7 0.939 230 -402.6 17, 39, 62, 256<br />
ment <strong>with</strong> respect previous periodogram schemes- the aforementioned<br />
Bayesian approach has a higher sensitivity to lower<br />
amplitude signals and is less prone to false positive detections.<br />
Because of this, the use of log–L periodograms is not to quantify<br />
the significance of a new signal but to provide visual assessment<br />
of possible aliases or alternative high-likelihood solutions.<br />
Log–L periodograms implicitly assume flat priors for all the<br />
free parameters. As a result, this method provides a quick way of<br />
assessing the sensitivity of a detection against a choice of prior<br />
functions different from uniform. As discussed later, the sixth<br />
candidate is only confidently spotted using log–L periodograms<br />
(our detection criteria is FAP< 1%) when the orbits of all the<br />
candidates are assumed to be circular. This is the red line beyond<br />
which our detection criteria becomes strongly dependent<br />
on our choice of prior on the eccentricity. The same applies to<br />
the seventh tentative candidate signal.<br />
5. Signal detection and confidences<br />
As opposed to other <strong>system</strong>s analyzed <strong>with</strong> the same techniques<br />
(e.g. Tau Ceti or HD 40307, Tuomi et al. 2012, 2013), we found<br />
that for <strong>GJ</strong> <strong>667C</strong> the simplest model (g = 0 in equation 1) already<br />
provides a sufficient description of the data. For brevity,<br />
we omit here all the tests done <strong>with</strong> more sophisticated parameterizations<br />
of the noise (see Appendix C) that essentially lead<br />
to unconstrained models for the correlated noise terms and the<br />
same final results. In parallel <strong>with</strong> the Bayesian detection sequence,<br />
we also illustrate the search using log–L periodograms.<br />
In all that follows we use the three datasets available at this time :<br />
HARPS-TERRA, HIRES and PFS. We use the HARPS-TERRA<br />
Doppler measurements instead of CCF ones because TERRA<br />
velocities have been proven to be more precise on stable M-<br />
dwarfs (Anglada-Escudé & Butler 2012).<br />
The first three periodicities (7.2 days, 28.1 days and 91 days)<br />
were trivially spotted using Bayesian posterior samplings and<br />
the corresponding log–L periodograms. These three signals were<br />
already reported by Anglada-Escudé et al. (2012) and Delfosse<br />
et al. (2012), although the last one (signal d, at 91 days) remained<br />
uncertain due to the proximity to a characteristic time-scale of<br />
the star’s activity. This signal is discussed in the context of stellar<br />
activity in Section 6. Signal d has a MAP period of 91 days and<br />
would correspond to a candidate planet <strong>with</strong> a minimum mass of<br />
∼ 5 M ⊕ .<br />
After that, the log–L periodogram search for a fourth signal<br />
indicates a double-peaked likelihood maximum at 53 and<br />
62 days -both candidate periods receiving extremely low falsealarm<br />
probability estimates (see Figure 2). Using the recipes in<br />
Dawson & Fabrycky (2010), it is easy to show that the two peaks<br />
are the yearly aliases of each other. Accordingly, our Bayesian<br />
samplings converged to either period equally well giving slightly<br />
higher probability to the 53-day orbit (×6). In both cases, we<br />
found that including a fourth signal improved the model probability<br />
by a factor >10 3 . In appendix B.2 we provide a detailed<br />
analysis and derived orbital properties of both solutions and<br />
show that the precise choice of this fourth period does not substantially<br />
affect the confidence of the rest of the signals. As will<br />
be shown at the end of the detection sequence, the most likely<br />
solution for this candidate corresponds to a minimum mass of<br />
2.7 M ⊕ and a period of 62 days.<br />
After including the fourth signal, a fifth signal at 39.0 days<br />
shows up conspicuously in the log–L periodograms. In this case,<br />
the posterior samplings always converged to the same period of<br />
39.0 days <strong>with</strong>out difficulty (signal f). Such planet would have<br />
a minimum mass of ∼2.7 M ⊕ . Given that the model probability<br />
improved by a factor of 5.3×10 5 and that the FAP derived from<br />
the log-L periodogram is 0.45%, the presence of this periodicity<br />
is also supported by the data <strong>with</strong>out requiring further assumptions.<br />
The Bayesian sampling search for a sixth signal always converged<br />
to a period of 260 days that also satisfied our detection<br />
criteria and increased the probability of the model by a 4 × 10 3<br />
factor. The log–L periodograms did spot the same signal as the<br />
most significant one but assigned a FAP of ∼20% to it. This apparent<br />
contradiction is due to the prior on the eccentricity. That<br />
is, the maximum likelihood solution favors a very eccentric orbit<br />
for the Keplerian orbit at 62 days (e e ∼ 0.9), which is unphysical<br />
and absorbs variability at long timescales through aliases.<br />
To investigate this, we performed a log–L periodogram search<br />
assuming circular orbits for all the candidates. In this case, the<br />
260-day period received a FAP of 0.5% which would then qualify<br />
as a significant detection. Given that the Bayesian detection<br />
criteria are well satisfied and that the log–L periodograms also<br />
provide substantial support for the signal, we also include it in<br />
the model (signal g). Its amplitude would correspond to a minimum<br />
mass of 4.6 M ⊕ .<br />
When performing a search for a seventh signal, the posterior<br />
samplings converged consistently to a global probability maximum<br />
at 17 days (M sin i ∼ 1.1 M ⊕ ) which improves the model<br />
probability by a factor of 230. The global probability maximum<br />
containing seven signals corresponds to a solution <strong>with</strong> a period<br />
of 62 days for planet e. This solution has a total probability ∼<br />
16 times larger than the one <strong>with</strong> P e = 53 days. Although such<br />
difference is not very large to make a final decision on which period<br />
is preferred, from now on we will assume that our reference<br />
solution is the one <strong>with</strong> P e = 62.2 days. The log–L periodogram<br />
also spotted the same seventh period as the next favored one but<br />
only when all seven candidates were assumed to have circular orbits.<br />
Given that this seventh signal is very close to the Bayesian<br />
detection limit, and based on our experience on the analysis of<br />
similar datasets (e.g., <strong>GJ</strong> 581 Tuomi & Jenkins 2012), we admit<br />
that this candidate requires more measurements to be securely<br />
confirmed. With a minimum mass of only ∼ 1.1 M ⊕ , it would be<br />
among the least massive exoplanets to date.<br />
7
Guillem Anglada-Escudé et al.: Three HZ super-Earths in a seven-planet <strong>system</strong><br />
Fig. 3. Marginalized posterior densities for the Doppler semi-amplitudes of the seven reported signals.<br />
RV [m s -1 ]<br />
RV [m s -1 ]<br />
9<br />
6<br />
3<br />
0<br />
-3<br />
-6<br />
-9<br />
0 2 4 6<br />
Phase [days]<br />
9<br />
6<br />
3<br />
0<br />
-3<br />
-6<br />
-9<br />
0 10 20 30<br />
Phase [days]<br />
b<br />
f<br />
RV [m s -1 ]<br />
RV [m s -1 ]<br />
9<br />
6<br />
3<br />
0<br />
-3<br />
-6<br />
-9<br />
0 5 10 15 20 25<br />
Phase [days]<br />
9<br />
6<br />
3<br />
0<br />
-3<br />
-6<br />
c<br />
g<br />
-9<br />
0 50 100 150 200 250<br />
Phase [days]<br />
RV [m s -1 ]<br />
RV [m s -1 ]<br />
9<br />
6<br />
3<br />
0<br />
-3<br />
-6<br />
d<br />
-9<br />
0 20 40 60 80<br />
Phase [days]<br />
9<br />
6<br />
3<br />
0<br />
-3<br />
-6<br />
(h)<br />
-9<br />
0 5 10 15<br />
Phase [days]<br />
RV [m s -1 ]<br />
9<br />
6<br />
3<br />
0<br />
-3<br />
-6<br />
-9<br />
0 10 20 30 40 50 60<br />
Phase [days]<br />
e<br />
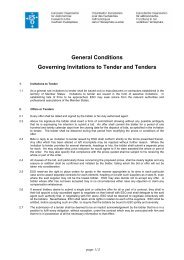
Fig. 4. RV measurements phase-folded to the best period for each planet. Brown circles are HARPS-TERRA velocities, PFS velocities are depicted<br />
as blue triangles, and HIRES velocities are green triangles. Red squares are averages on 20 phase bins of the HARPS-TERRA velocities. The black<br />
line corresponds to the best circular orbital fit (visualization purposes only).<br />
As a final comment we note that, as in Anglada-Escudé et al.<br />
(2012) and Delfosse et al. (2012), a linear trend was always included<br />
in the model. The most likely origin of such a trend is<br />
gravitational acceleration caused by the central <strong>GJ</strong> 667AB binary.<br />
Assuming a minimum separation of 230 AU, the acceleration<br />
in the line-of-sight of the observer can be as large as 3.7<br />
m s −1 , which is of the same order of magnitude as the observed<br />
trend of ∼ 2.2 m s −1 yr −1 . We remark that the trend (or part of<br />
it) could also be caused by the presence of a very long period<br />
planet or brown dwarf. Further Doppler follow-up, astrometric<br />
measurements, or direct imaging attempts of faint companions<br />
might help addressing this question.<br />
In summary, the first five signals are easily spotted using<br />
Bayesian criteria and log–L periodograms. The global seven-<br />
Keplerian solution prefers a period of 62.2 days for signal e<br />
which we adopt as our reference solution. Still, a period of 53<br />
days for the same signal cannot be ruled out at the moment. The<br />
statistical significance of a 6th periodicity depends on the prior<br />
choice on the eccentricity, but the Bayesian odds ratio is high<br />
enough to propose it as a genuine Keplerian signal. The statistical<br />
significance of the last seventh candidate (h) is close to our<br />
detection limit and more observations are needed to confirm it.<br />
6. Activity<br />
In addition to random noise (white or correlated), stellar activity<br />
can also generate spurious Doppler periodicities that can mimic<br />
<strong>planetary</strong> signals (e.g., Lovis et al. 2011; Reiners et al. 2013).<br />
In this section we investigate whether there are periodic variations<br />
in the three activity indices of <strong>GJ</strong> <strong>667C</strong> (S-index, BIS and<br />
FWHM are described in Section 3). Our general strategy is the<br />
following : if a significant periodicity is detected in any of the indices<br />
and such periodicity can be related to any of the candidate<br />
signals (same period or aliases), we add a linear correlation term<br />
to the model and compute log–L periodograms and new samplings<br />
of the parameter space. If the data were better described<br />
by the correlation term rather than a genuine Doppler signal, the<br />
overall model probability would increase and the planet signal<br />
in question should decrease its significance (even disappear).<br />
Log–L periodogram analysis of two activity indices (S-index<br />
but specially the FWHM) show a strong periodic variability<br />
at 105 days. As discussed in Anglada-Escudé et al. (2012);<br />
Delfosse et al. (2012), this cast some doubt on the candidate at<br />
91 days (d). Despite the fact that the 91-day and 105-day periods<br />
are not connected by first order aliases, the phase sampling<br />
in this period domain is sparse (see phase–folded diagrams of<br />
the RV data for the planet d candidate in Fig. 4) and the log–L<br />
periodogram for this candidate also shows substantial power at<br />
105 days. From the log–L periodograms in Figure 2, one can di-<br />
8
Guillem Anglada-Escudé et al.: Three HZ super-Earths in a seven-planet <strong>system</strong><br />
Table 4. Reference orbital parameters and their corresponding 99% credibility intervals. While the angles ω and M 0 are unconstrained due to strong degeneracies at small eccentricities,<br />
their sum λ = M 0 + ω is better behaved and is also provided here for reference.<br />
b (h) c f e ∗<br />
P [days] 7.2004 [7.1987, 7.2021] 16.946 [16.872, 16.997] 28.140 [28.075, 28.193] 39.026 [38.815, 39.220] 62.24 [61.69, 62.79]<br />
e 0.13 [0.02, 0.23] 0.06 [0, 0.38] 0.02 [0, 0.17] 0.03 [0, 0.19] 0.02 [0, 0.24]<br />
K [m s −1 ] 3.93 [3.55, 4.35] 0.61 [0.12, 1.05] 1.71 [1.24, 2.18] 1.08 [0.62, 1.55] 0.92 [0.50, 1.40]<br />
ω [rad] 0.10 [5.63, 0.85] 2.0 [0, 2π] 5.1 [0, 2π] 1.8 [0, 2π] 0.5 [0, 2π]<br />
M 0 [rad] 3.42 [2.32, 4.60] 5.1 [0, 2π] 0.3 [0, 2π] 5.1 [0, 2π] 4.1 [0, 2π]<br />
λ [deg] 201[168, 250] 45(180) † 308(99) † 34 (170) † 262(150) †<br />
M sin i [M ⊕ ] 5.6 [4.3, 7.0] 1.1 [0.2, 2.1] 3.8 [2.6, 5.3] 2.7 [1.5, 4.1] 2.7 [1.3, 4.3]<br />
a [AU] 0.0505 [0.0452, 0.0549] 0.0893 [0.0800, 0.0977] 0.125 [0.112, 0.137] 0.156 [0.139, 0.170] 0.213 [0.191, 0.232]<br />
d g Other model parameters<br />
P [days] 91.61 [90.72, 92.42] 256.2 [248.3, 270.0] ˙γ [m s −1 yr −1 ] 2.07 [1.79, 2.33]<br />
e 0.03 [0, 0.23] 0.08 [0, 0.49] γ HARPS [m s −1 ] -30.6 [-34.8, -26.8]<br />
K [m s −1 ] 1.52 [1.09, 1.95] 0.95 [0.51, 1.43] γ HIRES [m s −1 ] -31.9 [-37.0,, -26.9]<br />
ω [rad] 0.7 [0, 2π] 0.9 [0, 2π] γ PFS [m s −1 ] -25.8 [-28.9, -22.5]<br />
M 0 [rad] 3.7 [0, 2π] 4.1 [0, 2π] σ HARPS [m s −1 ] 0.92 [0.63, 1.22]<br />
σ HIRES [m s −1 ] 2.56 [0.93, 5.15]<br />
λ [deg] 251(126) † 285(170) † σ PFS [m s −1 ] 1.31 [0.00, 3.85]<br />
M sin i [M ⊕ ] 5.1 [3.4, 6.9] 4.6 [2.3, 7.2]<br />
a [AU] 0.276 [0.246, 0.300] 0.549 [0.491, 0.601]<br />
Notes. † Values allowed in the full range of λ. Full-width-at-half-maximum of the marginalized posterior is provided to illustrate the most likely<br />
range (see Figure 10). ∗ Due to the presence of a strong alias, the orbital period of this candidate could be 53 days instead. Such alternative orbital<br />
solution for planet e is given in Table B.2.<br />
∆log L<br />
∆log L<br />
d (h) c f e d<br />
g<br />
15<br />
S-index (1)<br />
10<br />
105 days<br />
5<br />
0<br />
10 100 1000<br />
15<br />
S-index (2)<br />
29 days<br />
10<br />
5<br />
0<br />
10 100 1000<br />
Period [days]<br />
d<br />
20<br />
(h) c f e d<br />
g<br />
105 days FWHM (1)<br />
15<br />
∆ log L<br />
40<br />
30<br />
20<br />
10<br />
0<br />
91 days<br />
105 days<br />
No correlation term<br />
Including correlation term<br />
10 100 1000<br />
Period [days]<br />
Fig. 6. Log–likelihood periodograms for planet d (91 days) including<br />
the correlation term (red dots) compared to the original periodogram<br />
<strong>with</strong>out them (black line). The inclusion of the correlation term increases<br />
the contrast between the peaks at 91 and 105 days, favoring<br />
the interpretation of the 91 days signals as a genuine planet candidate.<br />
∆log L<br />
10<br />
∆log L<br />
5<br />
0<br />
15<br />
10<br />
5<br />
0<br />
10 100 1000<br />
110 days<br />
FWHM (2)<br />
10 100 1000<br />
Period [days]<br />
Fig. 5. Top two panels Log–L periodograms for up to 2 signals in the<br />
S-index. The most likely periods of the proposed planet candidates are<br />
marked as vertical lines. Bottom two panels. Log–L periodograms for<br />
up to 2 signals in the FWHM. Given the proximity of these two signals,<br />
it is possible that both of them originate from the same feature (active<br />
region corotating <strong>with</strong> the star) that is slowly evolving <strong>with</strong> time.<br />
rectly obtain the probability ratio of a putative solution at 91 days<br />
versus one <strong>with</strong> a period of 105 days when no correlation terms<br />
are included. This ratio is 6.8 × 10 4 , meaning that the Doppler<br />
period at 91 days is largely favored over the 105-day one. All<br />
Bayesian samplings starting close to the 105-day peak ended-up<br />
converging on the signal at 91 day. We then applied our validation<br />
procedure by inserting linear correlation terms in the model<br />
(g=C F × FWHM i or g=C S × S i ), in eq. 1) and computed both<br />
log–L periodograms and Bayesian samplings <strong>with</strong> C F and C S as<br />
free parameters. In all cases the ∆ log L between 91 and 105 days<br />
slightly increased thus supporting that the signal at 91 days is of<br />
<strong>planetary</strong> origin. For example, the ratio of likelihoods between<br />
the 91 and the 105 days increased from 6.8×10 4 to 3.7×10 6 when<br />
the correlation term <strong>with</strong> the FWHM was included (see Figure<br />
6). The Bayesian samplings including the correlation term did<br />
not improve the model probability (see Appendix C) and still<br />
preferred the 91-day signal overwhelmingly. We conclude that<br />
this signal is not directly related to the stellar activity and therefore<br />
is a valid planet candidate.<br />
Given that activity might induce higher order harmonics in<br />
the time-series, all seven candidates have been analyzed and<br />
double-checked using the same approach. Some more details on<br />
the results from the samplings are given in the Appendix C.2. All<br />
candidates -including the tentative planet candidate h- passed all<br />
these validation tests <strong>with</strong>out difficulties.<br />
9
Guillem Anglada-Escudé et al.: Three HZ super-Earths in a seven-planet <strong>system</strong><br />
Table 5. Most significant periods as extracted using log–L periodograms on subsamples of the first N o bs measurements. Boldfaced values indicate<br />
coincidence <strong>with</strong> a signal of our seven-planet solution (or a first order yearly alias of it). A parenthesis in the last period indicates preferred period<br />
that did not satisfy the frequentist 1% FAP threshold but did satisfy the Bayesian detectability criteria.<br />
Notes. a 1 year −1 alias of the preferred period in Table 4.<br />
N obs 1 2 3 4 5 6 7<br />
50 7.2 101.5 – – – – –<br />
75 7.2 103.0 – – – – –<br />
90 7.2 28.0 104.1 – – – –<br />
100 7.2 91.2 28.0 54.4 a – – –<br />
120 7.2 91.6 28.0 – – – –<br />
143 7.2 91.6 28.0 53.6 a 35.3 a (260) –<br />
160 7.2 28.1 91.0 38.9 53.4 a 275 (16.9)<br />
173 7.2 28.1 91.9 61.9 38.9 260 (16.9)<br />
7. Tests for quasi-periodic signals<br />
Activity induced signals and superposition of several independent<br />
signals can be a source of confusion and result in detections<br />
of “apparent” false positives. In an attempt to quantify how<br />
much data is necessary to support our preferred global solution<br />
(<strong>with</strong> seven planets) we applied the log-L periodogram analysis<br />
method to find the solution as a function of the number of data<br />
points. For each dataset, we stopped searching when no peak<br />
above FAP 1% was found. The process was fully automated so<br />
no human-biased intervention could alter the detection sequence.<br />
The resulting detection sequences are show in Table 5. In addition<br />
to observing how the complete seven-planet solution slowly<br />
emerges from the data one can notice that for N obs
Guillem Anglada-Escudé et al.: Three HZ super-Earths in a seven-planet <strong>system</strong><br />
Power<br />
100<br />
80<br />
60<br />
40<br />
20<br />
0<br />
80<br />
60<br />
40<br />
20<br />
0<br />
50<br />
40<br />
30<br />
20<br />
10<br />
0<br />
50<br />
40<br />
30<br />
20<br />
10<br />
0<br />
40<br />
30<br />
20<br />
10<br />
0<br />
40<br />
30<br />
20<br />
10<br />
0<br />
25<br />
20<br />
15<br />
10<br />
5<br />
0<br />
+28d<br />
+91d<br />
+63d<br />
+39d<br />
+260d<br />
+17d<br />
Real set<br />
16 32 64 128 256<br />
Period [days]<br />
Power<br />
100<br />
80<br />
60<br />
40<br />
20<br />
0<br />
100<br />
80<br />
60<br />
40<br />
20<br />
0<br />
70<br />
60<br />
50<br />
40<br />
30<br />
20<br />
10<br />
0<br />
60<br />
50<br />
40<br />
30<br />
20<br />
10<br />
0<br />
50<br />
40<br />
30<br />
20<br />
10<br />
0<br />
50<br />
40<br />
30<br />
20<br />
10<br />
0<br />
30<br />
25<br />
20<br />
15<br />
10<br />
5<br />
0<br />
+28d<br />
+91d<br />
+63d<br />
+39d<br />
+260d<br />
+17d<br />
Real set<br />
16 32 64 128 256<br />
Period [days]<br />
Power<br />
100<br />
80<br />
60<br />
40<br />
20<br />
0<br />
80<br />
60<br />
40<br />
20<br />
0<br />
50<br />
40<br />
30<br />
20<br />
10<br />
0<br />
50<br />
40<br />
30<br />
20<br />
10<br />
0<br />
40<br />
30<br />
20<br />
10<br />
0<br />
40<br />
30<br />
20<br />
10<br />
0<br />
30<br />
25<br />
20<br />
15<br />
10<br />
5<br />
0<br />
+28d<br />
+91d<br />
+63d<br />
+39d<br />
+260d<br />
+17d<br />
Real set<br />
16 32 64 128 256<br />
Period [days]<br />
Fig. 8. Same as 7 but using the first 100 epochs (left), first 120 (center) and all of them (right).<br />
∆log L<br />
∆log L<br />
∆log L<br />
∆log L<br />
∆log L<br />
200<br />
150<br />
100<br />
50<br />
60<br />
45<br />
30<br />
15<br />
30<br />
20<br />
10<br />
20<br />
15<br />
10<br />
5<br />
30<br />
20<br />
10<br />
First half<br />
b<br />
c<br />
d<br />
e<br />
f<br />
Second half<br />
∆log L<br />
∆log L<br />
20<br />
15<br />
10<br />
5<br />
20<br />
15<br />
10<br />
5<br />
0<br />
1 10 100 1000<br />
Period [days]<br />
g<br />
(h)<br />
1 10 100 1000<br />
Period [days]<br />
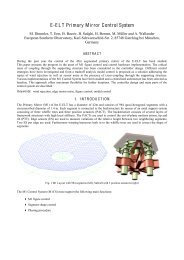
Fig. 9. Periodograms on first and second half of the time series as obtained when all signals except one were removed from the data. Except<br />
for signal h, all signals are significantly present in both halves and could have been recovered using either half if they had been in single planet<br />
<strong>system</strong>s.<br />
amplitudes – except perhaps candidate b which has a considerably<br />
higher amplitude – made this problem especially severe. In<br />
this sense, the currently available set of observation are a sub–<br />
sample of the many more that might be obtained in the future,<br />
so it might happen that one of the signals we report “bifurcates”<br />
into other periodicities. This experiment also suggests that spectral<br />
information beyond the most trivial aliases can be used to<br />
verify and assess the significance of future detections (under investigation).<br />
7.1. Presence of individual signals in one half of the data<br />
As an additional verification against quasi-periodicity, we investigated<br />
if the signals were present in the data when it was divided<br />
in two halves. First half corresponds to the first 86 HARPS observations<br />
and the second half covers the rest. The data from PFS<br />
and HIRES was not used for this test. The experiment consists in<br />
removing all signals except for one of them at a time and compute<br />
the periodogram on those residuals (first and second halfs<br />
separately). If a signal is strongly present in both halfs, it should,<br />
at least, emerge as substantially significant. All signals except for<br />
the seventh one passed this test nicely. That is, in all cases except<br />
for h, the periodograms prominently display the non-removed<br />
11
Guillem Anglada-Escudé et al.: Three HZ super-Earths in a seven-planet <strong>system</strong><br />
signal unambiguously. Besides demonstrating that all signals are<br />
strongly present in the two halves, it also illustrates that any<br />
of the candidates would have been trivially spotted using periodograms<br />
if it had been orbiting alone <strong>around</strong> the star. The fact<br />
that each signal was not spotted before (Anglada-Escudé et al.<br />
2012; Delfosse et al. 2012) is a consequence of an inadequate<br />
treatment of signal correlations when dealing <strong>with</strong> periodograms<br />
of the residuals only. Both the described Bayesian method and<br />
the log-likelihood periodogram technique are able to deal <strong>with</strong><br />
such correlations by identifying the combined global solution<br />
at the period search level. As for other multiplanet <strong>system</strong>s detected<br />
using similar techniques (Tuomi et al. 2013; Anglada-<br />
Escudé & Tuomi 2012), optimal exploration of the global probability<br />
maxima at signal search level is essential to properly detect<br />
and assess the significance of low mass multiplanet solutions,<br />
especially when several signals have similar amplitudes close to<br />
the noise level of the measurements.<br />
Summarizing these investigations and validation of the signals<br />
against activity, we conclude that<br />
– Up to seven periodic signals are detected in the Doppler measurements<br />
of <strong>GJ</strong> <strong>667C</strong> data, being the last (seventh) signal<br />
very close to our detection threshold.<br />
– The significance of the signals is not affected by correlations<br />
<strong>with</strong> activity indices and we could not identify any strong<br />
wavelength dependence <strong>with</strong> any of them.<br />
– The first six signals are strongly present in subsamples of<br />
the data. Only the seventh signal is unconfirmed using half<br />
of the data only. Our analysis indicates that any of the six<br />
stronger signals would had been robustly spotted <strong>with</strong> half<br />
the available data if each had been orbiting alone <strong>around</strong> the<br />
host star.<br />
– Signal correlations in unevenly sampled data is the reason<br />
why Anglada-Escudé et al. (2012) and Delfosse et al. (2012)<br />
only reported three of them. This is a known problem assessing<br />
the significance of signals when using periodograms<br />
of residuals only (see Anglada-Escudé & Tuomi 2012, as<br />
another example).<br />
Given the results of these validation tests, we promote six of the<br />
signals (b, c, d, e, f, g) to planet candidates. For economy of<br />
language, we will refer to them as planets but the reader must<br />
remember that, unless complementary and independent verification<br />
of a Doppler signal is obtained (e.g., transits), they should be<br />
called planet candidates. Verifying the proposed <strong>planetary</strong> <strong>system</strong><br />
against dynamical stability is the purpose of the next section.<br />
8. Dynamical analysis<br />
One of the by-products of the Bayesian analysis described in the<br />
previous sections, are numerical samples of statistically allowed<br />
parameter combinations. The most likely orbital elements and<br />
corresponding confidence levels can be deduced from these samples.<br />
In Table 4 we give the orbital configuration for a <strong>planetary</strong><br />
<strong>system</strong> <strong>with</strong> seven planets <strong>around</strong> <strong>GJ</strong> <strong>667C</strong>, which is preferred<br />
from a statistical point of view. To be sure that the proposed<br />
<strong>planetary</strong> <strong>system</strong> is physically realistic, it is necessary to confirm<br />
that these parameters not only correspond to the solution favored<br />
by the data, but also constitute a <strong>dynamically</strong> stable configuration.<br />
Due to the compactness of the orbits, abundant resonances<br />
and therefore complex inter<strong>planetary</strong> interactions are expected<br />
<strong>with</strong>in the credibility intervals. To slightly reduce this complexity<br />
and since evidence for planet h is weak, we split our analysis<br />
and present in the first part of this section the results for the sixplanet<br />
solution <strong>with</strong> planets b to g. The dynamical feasibility of<br />
the seven-planet solution is then assessed by investigating the<br />
semi-major axis that would allow introducing a seventh planet<br />
<strong>with</strong> the characteristics of planet h.<br />
8.1. Finding stable solutions for six planets<br />
A first thing to do is to extract from the Bayesian samplings<br />
those orbital configurations that allow stable <strong>planetary</strong> motion<br />
over long time scales, if any. Therefore we tested the stability of<br />
each configuration by a separate numerical integration using the<br />
symplectic integrator SABA 2 of Laskar & Robutel (2001) <strong>with</strong><br />
a step size τ = 0.0625 days. In the integration we included a correction<br />
term to account for general relativistic precession. Tidal<br />
effects were neglected for these runs. Possible effects of tides are<br />
discussed separately in Section 9.4. The integration was stopped<br />
if any of the planets went beyond 5 AU or planets approached<br />
each other closer than 10 −4 AU.<br />
The stability of those configurations that survived the integration<br />
time span of 10 4 orbital periods of planet g (i. e. ≈ 7000<br />
years), was then determined using frequency analysis (Laskar<br />
1993). For this we computed the stability index D k for each<br />
planet k as the relative change in its mean motion n k over two<br />
consecutive time intervals as was done in Tuomi et al. (2013).<br />
For stable orbits the computed mean motion in both intervals<br />
will be almost the same and therefore D k will be very small. We<br />
note that, that this also holds true for planets captured inside a<br />
mean-motion resonance (MMR), as long as this resonance helps<br />
to stabilize the <strong>system</strong>. As an index for the total stability of a configuration<br />
we used D = max(|D k |). The results are summarized<br />
in Figure 10. To generate Figure 10, we extracted a sub-sample<br />
of 80,000 initial conditions from the Bayesian samplings. Those<br />
configurations that did not reach the final integration time are<br />
represented as gray dots. By direct numerical integration of the<br />
remaining initial conditions we found that almost all configurations<br />
<strong>with</strong> D < 10 −5 survive a time span of 1 Myr. This corresponds<br />
to ∼0.3 percent of the total sample. The most stable orbits<br />
we found (D < 10 −6 ) are depicted as black crosses.<br />
In Figure 10 one can see that the initial conditions taken from<br />
the integrated 80,000 solutions are already confined to a very<br />
narrow range in the parameter space of all possible orbits. This<br />
means, that the allowed combinations of initial a and λ are already<br />
quite restricted by the statistics. By examining Figure 10<br />
one can also notice that those initial conditions that turned out<br />
to be long-term stable are quite spread along the areas where<br />
the density of Bayesian states is higher. Also, for some of the<br />
candidates, (d, f and g) and d) there are regions were no orbit<br />
was found <strong>with</strong> D10 −5 ), mod-<br />
12
Guillem Anglada-Escudé et al.: Three HZ super-Earths in a seven-planet <strong>system</strong><br />
360<br />
270<br />
b c d<br />
λ [deg]<br />
180<br />
90<br />
0<br />
0.050425 0.05043 0.050435 0.050440.1249 0.1250 0.1251 0.1252 0.1253<br />
0.273 0.274 0.275 0.276 0.277<br />
360<br />
270<br />
e f g<br />
λ [deg]<br />
180<br />
90<br />
0<br />
0.211 0.212 0.213 0.214 0.215<br />
a [au]<br />
0.155 0.1555 0.156 0.1565<br />
a [au]<br />
0.536 0.544 0.552<br />
a [au]<br />
Fig. 10. Result of the stability analysis of 80,000 six-planet solutions in the plane of initial semi-major axis a vs. initial mean longitude λ obtained<br />
from a numerical integration over T ≈ 7000 years. Each initial condition is represented as a point. Initial conditions leading to an immediate<br />
disintegration of the <strong>system</strong> are shown as gray dots. Initial conditions that lead to stable motion for at least 1 Myr are shown as red points<br />
(D< 10 −5 ). Black crosses represent the most stable solutions (D< 10 −6 ), and can last over many Myr.<br />
Table 6. Astrocentric orbital elements of solution S 6 .<br />
Planet P (d) a (AU) e ω ( ◦ ) M 0 ( ◦ ) M sin i (M ⊕ )<br />
b 7.2006 0.05043 0.112 4.97 209.18 5.94<br />
c 28.1231 0.12507 0.001 101.38 154.86 3.86<br />
f 39.0819 0.15575 0.001 77.73 339.39 1.94<br />
e 62.2657 0.21246 0.001 317.43 11.32 2.68<br />
d 92.0926 0.27580 0.019 126.05 243.43 5.21<br />
g 251.519 0.53888 0.107 339.48 196.53 4.41<br />
erately eccentric orbits would have been much more strongly<br />
suppressed than <strong>with</strong> our choice of prior function (Gaussian distribution<br />
of zero mean and σ = 0.3, see Appendix A.1). In this<br />
sense, our prior density choice provides a much softer and uninformative<br />
constraint than the dynamical viability of the <strong>system</strong>.<br />
In the following we will use the set of initial conditions that<br />
gave the smallest D for a detailed analysis and will refer to it<br />
as S 6 . In Table 6, we present the masses and orbital parameters<br />
of S 6 , and propose it as the favored configuration. To double<br />
check our dynamical stability results, we also integrated S 6 for<br />
10 8 years using the HNBody package (Rauch & Hamilton 2002)<br />
including general relativistic corrections and a time step of τ =<br />
10 −3 years. 1<br />
chitecture of the <strong>system</strong>. From studies of the Solar System we<br />
know that, in the absence of mean motion resonances, the variations<br />
in the orbital elements of the planets are governed by the<br />
so-called secular equations. These equations are obtained after<br />
averaging over the mean longitudes of the planets. Since the<br />
involved eccentricities for <strong>GJ</strong> <strong>667C</strong> are small, the secular <strong>system</strong><br />
can be limited here to its linear version, which is usually<br />
called Laplace-Lagrange solution (for details see Laskar (1990)).<br />
Basically, the solution is obtained from a transformation of the<br />
complex variables z k = e k e ıϖ k<br />
into the proper modes u k . Here e k<br />
are the eccentricities and ϖ k the longitudes of the periastron of<br />
planet k = b, c, . . . , g. The proper modes u k determine the secular<br />
variation of the eccentricities and are given by u k ≈ e i(g kt+ϕ k ) .<br />
8.2. Secular evolution<br />
Although the dynamical analysis of such a complex <strong>system</strong> <strong>with</strong><br />
different, interacting resonances could be treated in a separate<br />
paper, we present here some basic analysis of the dynamical ar-<br />
1 Publicly available at http://janus.astro.umd.edu/HNBody/<br />
Since the transformation into the proper modes depends only<br />
on the masses and semi-major axes of the planets, the secular<br />
frequencies will not change much for the different stable configurations<br />
found in Figure 10. Here we use solution S 6 to obtain<br />
numerically the parameters of the linear transformation by a frequency<br />
analysis of the numerically integrated orbit. The secular<br />
frequencies g k and the phases ϕ k are given in Table 7. How well<br />
13
Guillem Anglada-Escudé et al.: Three HZ super-Earths in a seven-planet <strong>system</strong><br />
0.5<br />
0.5<br />
0.5<br />
0.4<br />
0.4<br />
0.4<br />
Frequency<br />
0.3<br />
0.2<br />
Frequency<br />
0.3<br />
0.2<br />
Frequency<br />
0.3<br />
0.2<br />
0.1<br />
0.1<br />
0.1<br />
0.5<br />
0<br />
0 0.1 0.2 0.3 0.4 0.5<br />
e b<br />
0.5<br />
0<br />
0 0.1 0.2 0.3 0.4 0.5<br />
e c<br />
0.5<br />
0<br />
0 0.1 0.2 0.3 0.4 0.5<br />
e d<br />
0.4<br />
0.4<br />
0.4<br />
Frequency<br />
0.3<br />
0.2<br />
Frequency<br />
0.3<br />
0.2<br />
Frequency<br />
0.3<br />
0.2<br />
0.1<br />
0.1<br />
0.1<br />
0<br />
0 0.1 0.2 0.3 0.4 0.5<br />
e e<br />
0<br />
0 0.1 0.2 0.3 0.4 0.5<br />
e f<br />
0<br />
0 0.1 0.2 0.3 0.4 0.5<br />
e g<br />
Fig. 11. Marginalized posterior densities for the orbital eccentricities of the six planet solution (b, c, d, in the first row; e, f, g in the second) before<br />
(gray histogram) and after (red histogram) ruling out <strong>dynamically</strong> unstable configuration.<br />
eccentricity<br />
0.12<br />
0.1<br />
0.08<br />
0.06<br />
0.04<br />
0.02<br />
0<br />
d<br />
b<br />
e<br />
f<br />
c<br />
g<br />
5000 7500 10000 12500<br />
t [yr]<br />
Fig. 12. Evolution of the eccentricities of solution S 6 . Colored lines give<br />
the eccentricity as obtained from a numerical integration. The thin black<br />
lines show the eccentricity of the respective planet as given by the linear,<br />
secular approximation. Close to each line we give the name of the<br />
corresponding planet.<br />
the secular solution describes the long-term evolution of the eccentricities<br />
can be readily seen in Figure 12.<br />
Table 7. Fundamental secular frequencies g k , phases ϕ k and corresponding<br />
periods of the six-planet solution.<br />
k g k ϕ k Period<br />
[deg/yr] [deg] [yr]<br />
1 0.071683 356.41 5022.09<br />
2 0.184816 224.04 1947.88<br />
3 0.991167 116.46 363.21<br />
4 0.050200 33.63 7171.37<br />
5 0.656733 135.52 548.17<br />
6 0.012230 340.44 29435.80<br />
From Figure 12, it is easy to see that there exists a strong secular<br />
coupling between all the inner planets. From the Laplace-<br />
Lagrange solution we find that the long-term variation of the<br />
eccentricities of these planets is determined by the secular frequency<br />
g 1 −g 4 <strong>with</strong> a period of ≈ 17000 years. Here the variation<br />
in eccentricity of planet b is in anti-phase to that of planets c to<br />
f due to the exchange of orbital angular momentum. On shorter<br />
time scales we easily spot in Figure 12 the coupling between<br />
planets d and e <strong>with</strong> a period of ≈ 600 years (g 1 − g 5 ), while<br />
the eccentricities of planets c and f vary <strong>with</strong> a period of almost<br />
3000 years (g 1 + g 4 ). Such couplings are already known to prevent<br />
close approaches between the planets (Ferraz-Mello et al.<br />
2006). As a result, the periastron of the planets are locked and<br />
the difference ∆ϖ between any of their ϖ librates <strong>around</strong> zero.<br />
Although the eccentricities show strong variations, these<br />
changes are very regular and their maximum values remain<br />
bounded. From the facts that 1) the secular solution agrees so<br />
well <strong>with</strong> numerically integrated orbits, and 2) at the same time<br />
the semi-major axes remain nearly constant (Table 8), we can<br />
conclude that S 6 is not affected by strong MMRs.<br />
Nevertheless, MMRs that can destabilize the whole <strong>system</strong><br />
are <strong>with</strong>in the credibility intervals allowed by the samplings and<br />
not far away from the most stable orbits. Integrating some of the<br />
initial conditions marked as chaotic in Figure 10 one finds that,<br />
for example, planets d and g are in some of these cases temporarily<br />
trapped inside a 3:1 MMR, causing subsequent disintegration<br />
of the <strong>system</strong>.<br />
Table 8. Minimum and maximum values of the semi-major axes and<br />
eccentricities during a run of S 6 over 10 Myr.<br />
k a min a max e min e max<br />
b 0.050431 0.050433 0.035 0.114<br />
c 0.125012 0.125135 0.000 0.060<br />
f 0.155582 0.155922 0.000 0.061<br />
e 0.212219 0.212927 0.000 0.106<br />
d 0.275494 0.276104 0.000 0.087<br />
g 0.538401 0.539456 0.098 0.116<br />
8.3. Including planet h<br />
After finding a non-negligible set of stable six-planet solutions, it<br />
is tempting to look for more planets in the <strong>system</strong>. From the data<br />
analysis one even knows the preferred location of such a planet.<br />
We first considered doing an analysis similar to the one for the<br />
six-planet case using the Bayesian samples for the seven-planet<br />
solution. As shown in previous sections, the subset of stable so-<br />
14
Guillem Anglada-Escudé et al.: Three HZ super-Earths in a seven-planet <strong>system</strong><br />
eccentricity<br />
0.15<br />
0.1<br />
0.05<br />
0<br />
b<br />
h<br />
c<br />
0.05 0.1 0.15 0.2<br />
a [AU]<br />
f<br />
-3<br />
-4<br />
-5<br />
-6<br />
max |D k |<br />
Fig. 13. Stability plot of the possible location of a 7th planet in the stable<br />
S 6 solution (Table 5). We investigate the stability of an additional<br />
planet <strong>with</strong> 1.1 Earth masses <strong>around</strong> the location found by the Bayesian<br />
analysis. For these integrations we varied the semi-major axis and eccentricity<br />
of the putative planet on a regular grid. The orbital angles<br />
ω and M 0 were set to the values of the statistically preferred solution,<br />
while the inclination was fixed to zero. The nominal positions of the<br />
planets as given in Table 6 are marked <strong>with</strong> white crosses.<br />
lutions found by this approach is already small compared to the<br />
statistical samples in the six-planet case (∼ 0.3%). Adding one<br />
more planet (five extra dimensions) can only shrink the relative<br />
volume of stable solutions further. Given the large uncertainties<br />
on the orbital elements of h, we considered this approach too<br />
computationally expensive and inefficient.<br />
As a first approximation to the problem, we checked whether<br />
the distances between neighboring planets are still large enough<br />
to allow stable motion. In Chambers et al. (1996) the mean lifetime<br />
for coplanar <strong>system</strong>s <strong>with</strong> small eccentricities is estimated<br />
as a function of the mutual distance between the planets, their<br />
masses and the number of planets in the <strong>system</strong>. From their results<br />
we can estimate the expected lifetime for the seven planet<br />
solution to be at least 10 8 years.<br />
Motivated by this result, we explored the phase space <strong>around</strong><br />
the proposed orbit for the seventh planet. To do this, we use solution<br />
S 6 and placed a fictitious planet <strong>with</strong> 1.1 M ⊕ (the estimated<br />
mass of planet h as given in Table 4) in the semi-major axis range<br />
between 0.035 and 0.2 AU (step size of 0.001 AU) varying the<br />
eccentricity between 0 and 0.2 (step size of 0.01). The orbital angles<br />
ω and M 0 were set to the values of the statistically preferred<br />
solution for h (see Table 4). For each of these initial configuration<br />
we integrated the <strong>system</strong> for 10 4 orbits of planet g and<br />
analyzed stability of the orbits using the same secular frequency<br />
analysis. As a result, we obtained a value of the chaos index D<br />
at each grid point. Figure 13 shows that the putative orbit of h<br />
appears right in the middle of the only island of stability left in<br />
the inner region of the <strong>system</strong>. By direct numerical integration<br />
of solution S 6 together <strong>with</strong> planet h at its nominal position, we<br />
found that such a solution is also stable on Myr timescales. With<br />
this we conclude that the seventh signal detected by the Bayesian<br />
analysis also belongs to a physically viable planet that might be<br />
confirmed <strong>with</strong> a few more observations.<br />
8.4. An upper limit for the masses<br />
Due to the lack of reported transit, only the minimum masses are<br />
known for the planet candidates. The true masses depend on the<br />
unknown inclination i of the <strong>system</strong> to the line-of-sight. In all the<br />
analysis presented above we implicitly assume that the <strong>GJ</strong> <strong>667C</strong><br />
is observed edge-on (i = 90 ◦ ) and that all true masses are equal<br />
to the minimum mass Msin i. As shown in the discussion on the<br />
dynamics, the stability of the <strong>system</strong> is fragile in the sense that<br />
<strong>dynamically</strong> unstable configurations can be found close in the<br />
parameter space to the stable ones. Therefore, it is likely that a<br />
more complete analysis could set strong limitations on the maximum<br />
masses allowed to each companion. An exploration of the<br />
total phase space including mutual inclinations would require<br />
too much computational resources and is beyond the scope of<br />
this paper. To obtain a basic understanding of the situation, we<br />
only search for a constrain on the maximum masses of the S 6<br />
solution assuming co-planarity. Decreasing the inclination of the<br />
orbital plane in steps of 10 ◦ , we applied the frequency analysis<br />
to the resulting <strong>system</strong>. By making the planets more massive, the<br />
interactions between them become stronger, <strong>with</strong> a corresponding<br />
shrinking of the areas of stability. In this experiment, we<br />
found that the <strong>system</strong> remained stable for at least one Myr for<br />
an inclination down to i = 30 ◦ . If this result can be validated by<br />
a much more extensive exploration of the dynamics and longer<br />
integration times (in prep.), it would confirm that the masses of<br />
all the candidates are <strong>with</strong>in a factor of 2 of the minimum masses<br />
derived from Doppler data. Accordingly, c,f and e would be the<br />
first <strong>dynamically</strong> confirmed super-Earths (true masses below 10<br />
M ⊕ ) in the habitable zone of a nearby star.<br />
9. Habitability<br />
Planets h–d receive 20–200% of the Earth’s current insolation,<br />
and hence should be evaluated in terms of potential habitability.<br />
Traditionally, analyses of <strong>planetary</strong> habitability begin <strong>with</strong> determining<br />
if a planet is in the habitable zone (Dole 1964; Hart 1979;<br />
Kasting et al. 1993; Selsis et al. 2007; Kopparapu et al. 2013),<br />
but many factors are relevant. Unfortunately, many aspects cannot<br />
presently be determined due to the limited characterization<br />
derivable from RV observations. However, we can explore the<br />
issues quantitatively and identify those situations in which habitability<br />
is precluded, and hence determine which of these planets<br />
could support life. In this section we provide a preliminary<br />
analysis of each potentially habitable planet in the context of previous<br />
results, bearing in mind that theoretical predictions of the<br />
most relevant processes cannot be constrained by existing data.<br />
9.1. The Habitable Zone<br />
The HZ is defined at the inner edge by the onset of a “moist<br />
greenhouse,” and at the outer edge by the “maximum greenhouse”<br />
(Kasting et al. 1993). Both these definitions assume that<br />
liquid surface water is maintained under an Earth-like atmosphere.<br />
At the inner edge the temperature near the surface becomes<br />
large enough that water cannot be confined to the surface<br />
and water vapor saturates the stratosphere. From there, stellar<br />
radiation can dissociate the water and hydrogen can escape.<br />
Moreover, as water vapor is a greenhouse gas, large quantities in<br />
the atmosphere can heat the surface to temperatures that forbid<br />
the liquid phase, rendering the planet uninhabitable. At the outer<br />
edge, the danger is global ice coverage. While greenhouse gases<br />
like CO 2 can warm the surface and mitigate the risk of global<br />
glaciation, CO 2 also scatters starlight via Rayleigh scattering.<br />
15
Guillem Anglada-Escudé et al.: Three HZ super-Earths in a seven-planet <strong>system</strong><br />
Fig. 14. Tidal evolution of the spin properties of planet <strong>GJ</strong> <strong>667C</strong> f. Solid lines depict predictions from constant-time-lag theory (“CTL”), while<br />
dashed lines illustrate those from a constant-phase-lag model (“CPL”). All tracks assume a scenario similar to the “base” configuration (see text<br />
and Table 9). Left: Despinning for an assumed initial rotation period of one day. The CPL model yields tidal locking in less than 5 Myr, and CTL<br />
theory predicts about 20 Myr for tidal locking. Right: Tilt erosion of an assumed initial Earth-like obliquity of 23.5 ◦ . Time scales for both CPL and<br />
CTL models are similar to the locking time scales.<br />
There is therefore a limit to the amount of CO 2 that can warm<br />
a planet as more CO 2 actually cools the planet by increasing its<br />
albedo, assuming a moist or runaway greenhouse was never triggered.<br />
We use the most recent calculations of the HZ (Kopparapu<br />
et al. 2013) and find, for a 1 Earth-mass planet, that the inner<br />
and outer boundaries of the habitable zone for <strong>GJ</strong> <strong>667C</strong> lie between<br />
0.095–0.126 AU and 0.241–0.251 AU respectively. We<br />
will adopt the average of these limits as a working definition of<br />
the HZ: 0.111 – 0.246 AU. At the inner edge, larger mass planets<br />
resist the moist greenhouse and the HZ edge is closer in, but<br />
the outer edge is almost independent of mass. Kopparapu et al.<br />
(2013) find that a 10 M ⊕ planet can be habitable 5% closer to<br />
the star than a 1 M ⊕ planet. However, we must bear in mind that<br />
the HZ calculations are based on 1-dimensional photochemical<br />
models that may not apply to slowly rotating planets, a situation<br />
likely for planets c, d, e, f and h (see below).<br />
From these definitions, we find that planet candidate h (a =<br />
0.0893 AU) is too hot to be habitable, but we note its semi-major<br />
axis is consistent <strong>with</strong> the most optimistic version of the HZ.<br />
Planet c (a = 0.125 AU) is close to the inner edge but is likely to<br />
be in the HZ, especially since it has a large mass. Planets f and<br />
e are firmly in the HZ. Planet d is likely beyond the outer edge<br />
of the HZ, but the uncertainty in its orbit prevents a definitive<br />
assessment. Thus, we conclude that planets c, f, and e are in<br />
the HZ, and planet d might be, i.e. there up to four potentially<br />
habitable planets orbiting <strong>GJ</strong> <strong>667C</strong>.<br />
Recently, Abe et al. (2011) pointed out that planets <strong>with</strong><br />
small, but non-negligible, amounts of water have a larger HZ<br />
than Earth-like planets. From their definition, both h and d are<br />
firmly in the HZ. However, as we discuss below, these planets<br />
are likely water-rich, and hence we do not use the Abe et al.<br />
(2011) HZ here.<br />
9.2. Composition<br />
Planet formation is a messy process characterized by scattering,<br />
migration, and giant impacts. Hence precise calculations of<br />
<strong>planetary</strong> composition are presently impossible, but see Bond<br />
et al. (2010); Carter-Bond et al. (2012) for some general trends.<br />
For habitability, our first concern is discerning if a planet is<br />
rocky (and potentially habitable) or gaseous (and uninhabitable).<br />
Unfortunately, we cannot even make this rudimentary evaluation<br />
based on available data and theory. Without radii measurements,<br />
we cannot determine bulk density, which could discriminate between<br />
the two. The least massive planet known to be gaseous is<br />
<strong>GJ</strong> 1214 b at 6.55 M ⊕ (Charbonneau et al. 2009), and the largest<br />
planet known to be rocky is Kepler-10 b at 4.5 M ⊕ (Batalha<br />
et al. 2011). Modeling of gas accretion has found that planets<br />
smaller than 1 M ⊕ can accrete hydrogen in certain circumstances<br />
(Ikoma et al. 2001), but the critical mass is likely larger (Lissauer<br />
et al. 2009). The planets in this <strong>system</strong> lie near these masses,<br />
and hence we cannot definitively say if any of these planets are<br />
gaseous.<br />
Models of rocky planet formation <strong>around</strong> M dwarfs have<br />
found that those that accrete from primordial material are likely<br />
to be sub-Earth mass (Raymond et al. 2007) and volatilepoor<br />
(Lissauer 2007). In contrast, the planets orbiting <strong>GJ</strong> <strong>667C</strong><br />
are super-Earths in a very <strong>packed</strong> configuration summing up to<br />
> 25 M ⊕ inside 0.5 AU. Therefore, the planets either formed at<br />
larger orbital distances and migrated in (e.g. Lin et al. 1996),<br />
or additional dust and ice flowed inward during the proto<strong>planetary</strong><br />
disk phase and accumulated into the planets Hansen &<br />
Murray (2012, 2013). The large masses disfavor the first scenario,<br />
and we therefore assume that the planets formed from material<br />
that condensed beyond the snow-line and are volatile rich.<br />
If not gaseous, these planets contain substantial water content,<br />
which is a primary requirement for life (and negates the dryworld<br />
HZ discussed above). In conclusion, these planets could<br />
be terrestrial-like <strong>with</strong> significant water content and hence are<br />
potentially habitable.<br />
9.3. Stellar Activity and habitability<br />
Stellar activity can be detrimental to life as the planets can be<br />
bathed in high energy photons and protons that could strip the<br />
atmosphere or destroy ozone layers. In quiescence, M dwarfs<br />
emit very little UV light, so the latter is only dangerous if flares<br />
occur frequently enough that ozone does not have time to be<br />
replenished (Segura et al. 2010). As already discussed in Section<br />
2, <strong>GJ</strong> <strong>667C</strong> appears to be relatively inactive (indeed, we would<br />
not have been able to detect <strong>planetary</strong> signals otherwise), and<br />
16
Guillem Anglada-Escudé et al.: Three HZ super-Earths in a seven-planet <strong>system</strong><br />
so the threat to life is small today. If the star was very active<br />
in its youth- <strong>with</strong> mega-flares like those on the equal mass star<br />
AD Leo (Hawley & Pettersen 1991)- any life on the surface of<br />
planets might have been difficult during those days (Segura et al.<br />
2010). While M dwarfs are likely to be active for much longer<br />
time than the Sun (West et al. 2008; Reiners & Mohanty 2012),<br />
<strong>GJ</strong> <strong>667C</strong> is not active today and there is no reason to assume that<br />
life could not form after an early phase of strong stellar activity.<br />
9.4. Tidal Effects<br />
Planets in the HZ of low mass stars may be subject to strong<br />
tidal distortion, which can lead to long-term changes in orbital<br />
and spin properties (Dole 1964; Kasting et al. 1993; Barnes et al.<br />
2008; Heller et al. 2011), and tidal heating (Jackson et al. 2008;<br />
Barnes et al. 2009, 2012). Both of these processes can affect habitability,<br />
so we now consider its effects on planets c, d, e, f and<br />
h.<br />
Tides will first spin-lock the <strong>planetary</strong> spin and drive the<br />
obliquity to either 0 or π. The timescale for these processes<br />
is a complex function of orbits, masses, radii and spins, (see<br />
e.g. Darwin 1880; Hut 1981; Ferraz-Mello et al. 2008; Leconte<br />
et al. 2010) but for super-Earths in the HZ of ∼ 0.3 M ⊙ , Heller<br />
et al. (2011) found that tidal locking should occur in 10 6 –10 9<br />
years. We have used both the constant-time-lag and constantphase-lag<br />
tidal models described in Heller et al. (2011) and<br />
Barnes et al. (2012) (see also Ferraz-Mello et al. 2008; Leconte<br />
et al. 2010), to calculate how long tidal locking could take for<br />
these planets. We consider two possibilities. Our baseline case<br />
is very similar to that of Heller et al. (2011) in which the planets<br />
initially have Earth-like properties: 1 day rotation period, an<br />
obliquity of 23.5 ◦ and the current tidal dissipation of the Earth (a<br />
tidal Q of 12-Yoder (1995) or time lag of 638 s-Lambeck (1977);<br />
Neron de Surgy & Laskar (1997)). We also consider an extreme,<br />
but plausible, case that maximizes the timescale for tidal locking:<br />
8 hour rotation period, obliquity of 89.9 ◦ and a tidal Q of<br />
1000 or time lag of 6.5 s. In Table 9 we show the time for the<br />
obliquity to erode to 1 ◦ , t ero , and the time to reach the pseudosynchronous<br />
rotation period, t lock .<br />
In Figure 14, we depict the tidal evolution of the rotation period<br />
(left panel) and obliquity (right panel) for planet f as an example.<br />
The assumed initial configuration is similar to the “base”<br />
scenario. Time scales for rotational locking and tilt erosion are<br />
similar to those shown in Table 9. 2<br />
As these planets are on nearly circular orbits, we expect<br />
tidally-locked planets to be synchronously rotating, although<br />
perhaps when the eccentricity is relatively large pseudosynchronous<br />
rotation could occur (Goldreich 1966; Murray &<br />
Dermott 1999; Barnes et al. 2008; Correia et al. 2008; Ferraz-<br />
Mello et al. 2008; Makarov & Efroimsky 2013). From Table<br />
9 we see that all the planets h–f are very likely synchronous<br />
rotators, planet e is likely to be, but planet d is uncertain.<br />
Should these planets have tenuous atmospheres (< 0.3 bar), then<br />
they may not support a habitable surface (Joshi et al. 1997).<br />
Considerable work has shown that thicker atmospheres are able<br />
to redistribute dayside heat to produce clement conditions (Joshi<br />
et al. 1997; Joshi 2003; Edson et al. 2011; Pierrehumbert 2011;<br />
Wordsworth et al. 2011). As we have no atmospheric data, we<br />
2 Note that evolution for the CPL model is faster <strong>with</strong> our parameterization.<br />
In the case of Gl581 d, shown in Heller et al. (2011), the planet<br />
was assumed to be less dissipative in the CPL model (Q p = 100) and<br />
evolution in the CPL model was slower.<br />
assert that tidal locking does not preclude habitability for any of<br />
the HZ planets.<br />
During the tidal despinning, tidal heat can be generated as<br />
dissipation transforms rotational energy into frictional heat. In<br />
some cases, the heating rates can be large enough to trigger a<br />
runaway greenhouse and render a planet uninhabitable (Barnes<br />
et al. 2012). Tidal heating is maximized for large radius planets<br />
that rotate quickly and at high obliquity. Using the Leconte et al.<br />
(2010) model and the Earth’s dissipation, we find that tidal heating<br />
of the HZ planets will be negligible for most cases. Consider<br />
an extreme version of planet h, which is just interior to the HZ.<br />
Suppose it has the same tidal dissipation as the Earth (which is<br />
the most dissipative body known), a rotation period of 10 hr, an<br />
eccentricity of 0.1, and an obliquity of 80 ◦ . The Leconte et al.<br />
(2010) model predicts such a planet would have a tidal heat<br />
flux of nearly 4000 W m −2 . However, that model also predicts<br />
the flux would drop to only 0.16 W m −2 in just 10 6 years. The<br />
timescale for a runaway greenhouse to sterilize a planet is on the<br />
order of 10 8 years (Watson et al. 1981; Barnes et al. 2012), so<br />
this burst of tidal heating does not forbid habitability.<br />
After tidal locking, the planet would still have about 0.14 W<br />
m −2 of tidal heating due to the eccentricity (which, as for the<br />
other candidates, can oscillate due to dynamical interactions between<br />
0 and 0.1). If we assume an Earth-like planet, then about<br />
90% of that heat is generated in the oceans, and 10% in the rocky<br />
interior. Such a planet would have churning oceans, and about<br />
0.01 W m −2 of tidal heat flux from the rocky interior. This number<br />
should be compared to 0.08 W m −2 , the heat flux on the Earth<br />
due entirely to other sources. As e = 0.1 is near the maximum of<br />
the secular cycle, see § 8, the actual heat flux is probably much<br />
lower. We conclude that tidal heating on planet h is likely to be<br />
negligible, <strong>with</strong> the possibility it could be a minor contributor to<br />
the internal energy budget. As the other planets are more distant,<br />
the tidal heating of those planets is negligible. The CPL predicts<br />
higher heating rates and planet c could receive ∼ 0.01 W m −2 of<br />
internal heating, but otherwise tidal heating does not affect the<br />
HZ planets.<br />
9.5. The Weather Forecast<br />
Assuming planets c, f and e have habitable surfaces (see Figure<br />
15), what might their climates be like? To first order we expect<br />
the planet’s surface temperatures to be cooler as semi-major<br />
axis increases because the incident flux falls off <strong>with</strong> distance<br />
squared. However, albedo variations can supersede this trend,<br />
e.g. a closer, high-albedo planet could absorb less energy than a<br />
more distant low-albedo planet. Furthermore, molecules in the<br />
atmosphere can trap photons near the surface via the greenhouse<br />
effect, or scatter stellar light via Rayleigh scattering, an antigreenhouse<br />
effect. For example, the equilibrium temperature of<br />
Venus is actually lower than the Earth’s due to the former’s large<br />
albedo, yet the surface temperature of Venus is much larger than<br />
the Earth’s due to the greenhouse effect.Here we speculate on<br />
the climates of each HZ planet based on the our current understanding<br />
of the range of possible climates that HZ planets might<br />
have.<br />
Certain aspects of each planet will be determined by the redder<br />
spectral energy distribution of the host star. For example, the<br />
“stratosphere” is expected to be isothermal as there is negligible<br />
UV radiation (Segura et al. 2003). On Earth, the UV light<br />
absorbed by ozone creates a temperature inversion that delineates<br />
the stratosphere. HZ calculations also assume the albedo of<br />
planets orbiting cooler stars are lower than the Earth’s because<br />
Rayleigh scattering is less effective for longer wavelengths, and<br />
17
Guillem Anglada-Escudé et al.: Three HZ super-Earths in a seven-planet <strong>system</strong><br />
CPL<br />
CTL<br />
base max base max<br />
t lock t ero t lock t ero t lock t ero t lock t ero<br />
h 0.07 0.08 18.2 20.4 0.55 0.77 66.9 103<br />
c 0.62 0.69 177 190 4.7 8.1 704 1062<br />
f 2.2 2.3 626 660 18.5 30.1 2670 3902<br />
e 14.2 15.0 4082 4226 129 210 > 10 4 > 10 4<br />
d 70.4 73 > 10 4 > 10 4 692 1094 > 10 4 > 10 4<br />
Table 9. Timescales for the planets’ tidal despinning in units of Myr. “CPL” denotes the constant-phase-lag model of Ferraz-Mello et al. (2008),<br />
“CTL” labels the constant-time-lag model of Leconte et al. (2010).<br />
Fig. 15. Liquid water habitable zone of <strong>GJ</strong> <strong>667C</strong> <strong>with</strong> the proposed seven candidates as estimated using updated relations in Kopparapu et al.<br />
(2013). Three of the reported planets lie <strong>with</strong>in the HZ. The newly reported planets f and e are the most comfortably located <strong>with</strong>in it. The inner<br />
edge is set by the moist greenhouse runaway limit and the outer edge is set by the snow ball runaway limit. The empirical limits set by a recent<br />
uninhabitable Venus and an early habitable Mars are marked in brown solid lines. The presence of clouds of water (inner edge) or CO 2 (outer<br />
edge) might allow habitable conditions on planets slightly outside the nominal definition of the habitable zone (Selsis et al. 2007).<br />
because the peak emission in the stellar spectrum is close to<br />
several H 2 O and CO 2 absorption bands in the near infrared.<br />
Therefore, relative to the Earth’s insolation, the HZ is farther<br />
from the star. In other words, if we placed the Earth in orbit<br />
<strong>around</strong> an M dwarf such that it received the same incident radiation<br />
as the modern Earth, the M dwarf planet would be hotter as<br />
it would have a lower albedo. The different character of the light<br />
can also impact plant life, and we might expect less productive<br />
photosynthesis (Kiang et al. 2007), perhaps relying on pigments<br />
such as chlorophyll d (Mielke et al. 2013) or chlorophyll f (Chen<br />
et al. 2010).<br />
Planet c is slightly closer to the inner edge of the HZ than<br />
the Earth, and so we expect it to be warmer than the Earth, too.<br />
It receives 1230 W m −2 of stellar radiation, which is actually<br />
less than the Earth’s solar constant of 1360 W m −2 . Assuming<br />
synchronous rotation and no obliquity, then the global climate<br />
depends strongly on the properties of the atmosphere. If the atmosphere<br />
is thin, then the heat absorbed at the sub-stellar point<br />
cannot be easily transported to the dark side or the poles. The<br />
surface temperature would be a strong function of the zenith angle<br />
of the host star <strong>GJ</strong> <strong>667C</strong>. For thicker atmospheres, heat redistribution<br />
becomes more significant. With a rotation period of<br />
∼ 28 days, the planet is likely to have Hadley cells that extend<br />
to the poles (at least if Titan, <strong>with</strong> a similar rotation period, is<br />
a guide), and hence jet streams and deserts would be unlikely.<br />
The location of land masses is also important. Should land be<br />
concentrated near the sub-stellar point, then silicate weathering<br />
is more effective, and cools the planet by drawing down CO 2<br />
(Edson et al. 2012).<br />
Planet f is a prime candidate for habitability and receives<br />
788 W m −2 of radiation. It likely absorbs less energy than the<br />
Earth, and hence habitability requires more greenhouse gases,<br />
like CO 2 or CH 4 . Therefore a habitable version of this planet has<br />
to have a thicker atmosphere than the Earth, and we can assume<br />
a relatively uniform surface temperature. Another possibility is<br />
an “eyeball” world in which the planet is synchronously rotating<br />
and ice-covered except for open ocean at the sub-stellar point<br />
(Pierrehumbert 2011). On the other hand, the lower albedo of<br />
ice in the IR may make near-global ice coverage difficult (Joshi<br />
& Haberle 2011; Shields 2013).<br />
Planet e receives only a third the radiation the Earth does, and<br />
lies close to the maximum greenhouse limit. We therefore expect<br />
a habitable version of this planet to have > 2 bars of CO 2 . The<br />
planet might not be tidally locked, and may have an obliquity<br />
that evolves significantly due to perturbations from other planets.<br />
From this perspective planet e might be the most Earth-like,<br />
experiencing a day-night cycle and seasons.<br />
Finally planet d is unlikely to be in the habitable zone, but it<br />
could potentially support sub-surface life. Internal energy generated<br />
by, e.g. , radiogenic heat could support liquid water below<br />
an ice layer, similar to Europa. Presumably the biologically<br />
generated gases could find their way through the ice and become<br />
detectable bio-signatures, but they might be a very small<br />
constituent of a large atmosphere, hampering remote detection.<br />
While its transit probability is rather low (∼0.5%), its apparent<br />
angular separation from the star is ∼ 40 milliarcseconds. This<br />
value is the baseline inner working angle for the Darwin/ESA<br />
18
Guillem Anglada-Escudé et al.: Three HZ super-Earths in a seven-planet <strong>system</strong><br />
high-contrast mission being considered by ESA (Cockell et al.<br />
2009) so planet d could be a primary target for such a mission.<br />
9.6. Moons in the habitable zone of <strong>GJ</strong> <strong>667C</strong><br />
In addition to planets, extrasolar moons have been suggested as<br />
hosts for life (Reynolds et al. 1987; Williams et al. 1997; Tinney<br />
et al. 2011; Heller & Barnes 2013). In order to sustain a substantial,<br />
long-lived atmosphere under an Earth-like amount of stellar<br />
irradiation (Williams et al. 1997; Kaltenegger 2000), to drive a<br />
magnetic field over billions of years (Tachinami et al. 2011), and<br />
to drive tectonic activity, Heller & Barnes (2013) concluded that<br />
a satellite in the stellar HZ needs a mass 0.25 M ⊕ in order to<br />
maintain liquid surface water.<br />
If potential moons <strong>around</strong> planets <strong>GJ</strong> <strong>667C</strong> c, f, or e formed<br />
in the circum<strong>planetary</strong> disk, then they will be much less massive<br />
than the most massive satellites in the Solar System (Canup &<br />
Ward 2006) and thus not be habitable. However, if one of those<br />
planets is indeed terrestrial then impacts could have created a<br />
massive moon as happened on Earth (Cameron & Ward 1976).<br />
Further possibilities for the formation of massive satellites are<br />
summarized in Heller & Barnes (2013, Sect. 2.1).<br />
As the stellar HZ of <strong>GJ</strong> <strong>667C</strong> is very close to this M dwarf<br />
star, moons of planets in the habitable zone would have slightly<br />
eccentric orbits due to stellar perturbations. These perturbations<br />
induce tidal heating and they could be strong enough to prevent<br />
any moon from being habitable (Heller 2012). Moons <strong>around</strong><br />
planet d, which orbits slightly outside the stellar HZ, could offer<br />
a more benign environment to life than the planet itself, if they<br />
experience weak tidal heating of, say, a few watts per square<br />
meter (see Jupiter’s moon Io, Reynolds et al. 1987; Spencer<br />
et al. 2000).<br />
Unless some of these planets are found to transit, there is<br />
no currently available technique to identify satellites (Kipping<br />
2009; Kipping et al. 2012). The RV technique is only sensitive<br />
to the combined mass of a planet plus its satellites so it might be<br />
possible that some of the planets could be somewhat lighter– but<br />
host a massive moon.<br />
10. Conclusions<br />
We describe and report the statistical methods and tests used<br />
to detect up to seven planet candidates <strong>around</strong> <strong>GJ</strong> <strong>667C</strong> using<br />
Doppler spectroscopy. The detection of the first five planets is<br />
very robust and independent of any prior choice. In addition to<br />
the first two already reported ones (b and c Anglada-Escudé &<br />
Butler 2012; Delfosse et al. 2012) we show that the third planet<br />
also proposed in those papers (planet d) is much better explained<br />
by a Keplerian orbit rather than an activity-induced periodicity.<br />
The next two confidently detected signals (e and f) both<br />
correspond to small super-Earth mass objects <strong>with</strong> most likely<br />
periods of 62 and 39 days. The detection of the 6th planet is<br />
weakly dependent on the prior choice of the orbital eccentricity.<br />
The statistical evidence for the 7th candidate (planet h) is tentative<br />
and requires further Doppler follow-up for confirmation.<br />
Gregory (2012) proposed a solution for the <strong>system</strong> <strong>with</strong> similar<br />
characteristics to the one we present here but had fundamental<br />
differences. In particular, he also identified the first five stronger<br />
signals but his six-planet solution also included a candidate periodicity<br />
at 30 days- which would be <strong>dynamically</strong> unstable- and<br />
activity was associated to the signal at 53 days <strong>with</strong>out further<br />
discussion or verification. The difference in our conclusions are<br />
due to a slightly different choice of priors (especially on the eccentricity),<br />
more data was used in our analysis -only HARPS-<br />
CCF data was used by Gregory (2012)-, and we performed a<br />
more thorough investigation of possible activity related periodicities.<br />
Numerical integration of orbits compatible <strong>with</strong> the posterior<br />
density distributions show that there is a subset of configurations<br />
that allow long-term stable configurations. Except for planets<br />
b and g, the condition of dynamical stability dramatically affects<br />
the distribution of allowed eccentricities indicating that the<br />
lower mass planet candidates (c, e, f) must have quasi-circular<br />
orbits. A <strong>system</strong> of six planets is rather complex in terms of<br />
stabilizing mechanisms and possible mean-motion resonances.<br />
Nonetheless, we identified that the physically allowed configurations<br />
are those that avoid transient 3:1 MMR between planets<br />
d and g. We also found that the most stable orbital solutions are<br />
well described by the theory of secular frequencies (Laplace-<br />
Lagrange solution). We investigated if the inclusion of a seventh<br />
planet <strong>system</strong> was <strong>dynamically</strong> feasible in the region disclosed<br />
by the Bayesian samplings. It is notable that this preliminary<br />
candidate appears <strong>around</strong> the center of the region of stability.<br />
Additional data should be able to confirm this signal and provide<br />
detectability for longer period signals.<br />
The closely <strong>packed</strong> dynamics keeps the eccentricities small<br />
but non-negligible for the lifetime of the <strong>system</strong>. As a result, potential<br />
habitability of the candidates must account for tidal dissipation<br />
effects among others. Dynamics essentially affect 1) the<br />
total energy budget at the surface of the planet (tidal heating), 2)<br />
synchronization of the rotation <strong>with</strong> the orbit (tidal locking) and<br />
the timescales for the erosion of their obliquities. These dynamical<br />
constraints, as well as predictions for potentially habitable<br />
super-Earths <strong>around</strong> M dwarf stars, suggest that at least three<br />
planet candidates (planets c, e and f) could have remained habitable<br />
for the current life-span of the star. Assuming a rocky composition,<br />
planet d lies slightly outside the cold edge of the stellar<br />
HZ. Still, given the uncertainties in the planet parameters and in<br />
the assumptions in the climatic models, its potential habitability<br />
cannot be ruled out (e.g., ocean of liquid water under a thick ice<br />
crust, or presence of some strong green-house effect gas).<br />
One of the main results of the Kepler mission is that highmultiplicity<br />
<strong>system</strong>s of <strong>dynamically</strong> <strong>packed</strong> super-Earths are<br />
quite common <strong>around</strong> G and K dwarfs (Fabrycky et al. 2012).<br />
The putative existence of this kind of compact <strong>system</strong>s <strong>around</strong><br />
M-dwarfs, combined <strong>with</strong> a closer-in habitable zone suggests the<br />
existence of a numerous population of <strong>planetary</strong> <strong>system</strong>s <strong>with</strong><br />
several potentially habitable worlds each. <strong>GJ</strong> <strong>667C</strong> is likely to<br />
be among first of many of such <strong>system</strong>s that may be discovered<br />
in the forthcoming years.<br />
Acknowledgements. We acknowledge the constructive discussions <strong>with</strong> the referees<br />
of this manuscript. The robustness and confidence of the result greatly<br />
improved thanks to such discussions. GAE is supported by the German<br />
Federal Ministry of Education and Research under 05A11MG3. M. Tuomi acknowledges<br />
D. Pinfield and RoPACS (Rocky Planets Around Cool Stars), a<br />
Marie Curie Initial Training Network funded by the European Commission’s<br />
Seventh Framework Programme. E. Gerlach would like to acknowledge the<br />
financial support from the DFG research unit FOR584. RB is supported by<br />
NASA’s Virtual Planetary Laboratory under Cooperative Agreement Number<br />
NNH05ZDA001C and NSF grant AST-1108882. RH receives funding from the<br />
Deutsche Forschungsgemeinschaft (reference number scho394/29-1). JSJ also<br />
acknowledges funding by Fondecyt through grant 3110004 and partial support<br />
from CATA (PB06, Conicyt), the GEMINI-CONICYT FUND and from the<br />
Comité Mixto <strong>ESO</strong>-GOBIERNO DE CHILE. A. Reiners acknowledges research<br />
funding from DFG grant RE1664/9-1. S. Vogt gratefully acknowledges support<br />
from NSF grant AST-0307493. Based on data obtained from the <strong>ESO</strong> Science<br />
Archive Facility under request number ANGLADA36104. The work herein is<br />
based in part on observations obtained at the W.M. Keck Observatory, which<br />
is operated jointly by the University of California and the California Institute<br />
of Technology. We also acknowledge the efforts of the PFS/Magellan team<br />
19
Guillem Anglada-Escudé et al.: Three HZ super-Earths in a seven-planet <strong>system</strong><br />
in obtaining Doppler measurements. We thank Sandy Keiser for her efficient<br />
setup of the computer network at Carnegie/DTM. This research made use of the<br />
Magny Cours Cluster hosted by the GWDG, which is managed by Georg August<br />
University Göttingen and the Max Planck Society. This research has made use<br />
of the SIMBAD database, operated at CDS, Strasbourg, France. The authors<br />
acknowledge the significant efforts of the HARPS-<strong>ESO</strong> team in improving the<br />
instrument and its data reduction pipelines that made this work possible. We also<br />
acknowledge the efforts of all the individuals that have been involved in observing<br />
the target star <strong>with</strong> HARPS, HIRES and PFS.<br />
References<br />
Abe, Y., Abe-Ouchi, A., Sleep, N. H., & Zahnle, K. J. 2011, Astrobiology, 11,<br />
443<br />
Anglada-Escudé, G., Arriagada, P., Vogt, S. S., et al. 2012, ApJ, 751, L16<br />
Anglada-Escudé, G. & Butler, R. P. 2012, ApJS, 200, 15<br />
Anglada-Escudé, G., López-Morales, M., & Chambers, J. E. 2010, ApJ, 709,<br />
168<br />
Anglada-Escudé, G. & Tuomi, M. 2012, A&A, 548, A58<br />
Baliunas, S. L., Donahue, R. A., Soon, W. H., et al. 1995, ApJ, 438, 269<br />
Baluev, R. V. 2009, MNRAS, 393, 969<br />
Baluev, R. V. 2012, MNRAS, 420<br />
Barnes, R., Jackson, B., Greenberg, R., & Raymond, S. N. 2009, Astrophys. J.,<br />
700, L30<br />
Barnes, R., Mullins, K., Goldblatt, C., et al. 2012, ArXiv e-prints<br />
Barnes, R., Raymond, S. N., Jackson, B., & Greenberg, R. 2008, Astrobiology,<br />
8, 557<br />
Batalha, N. M., Borucki, W. J., Bryson, S. T., et al. 2011, Astrophys. J., 729, 27<br />
Bond, J. C., O’Brien, D. P., & Lauretta, D. S. 2010, Astrophys. J., 715, 1050<br />
Bonfils, X. 2009, in <strong>ESO</strong>-CAUP conference Series, ed. N. Santos, Vol. 1, –<br />
Bonfils, X., Delfosse, X., Udry, S., et al. 2011, arXiv:1111.5019<br />
Cameron, A. G. W. & Ward, W. R. 1976, in Lunar and Planetary Institute<br />
Science Conference Abstracts, Vol. 7, Lunar and Planetary Institute Science<br />
Conference Abstracts, 120<br />
Canup, R. M. & Ward, W. R. 2006, Nature, 441, 834<br />
Carter-Bond, J. C., O’Brien, D. P., & Raymond, S. N. 2012, ApJ, 760, 44<br />
Cayrel de Strobel, G. 1981, Bulletin d’Information du Centre de Donnees<br />
Stellaires, 20, 28<br />
Chambers, J. E., Wetherill, G. W., & Boss, A. P. 1996, Icarus, 119, 261<br />
Charbonneau, D., Berta, Z. K., Irwin, J., et al. 2009, Nature, 462, 891<br />
Chen, M., Schliep, M., Willows, R. D., et al. 2010, Science, 329, 1318<br />
Cockell, C. S., Léger, A., Fridlund, M., et al. 2009, Astrobiology, 9, 1<br />
Correia, A. C. M., Levrard, B., & Laskar, J. 2008, A&A, 488, L63<br />
Darwin, G. H. 1880, Royal Society of London Philosophical Transactions Series<br />
I, 171, 713<br />
Dawson, R. I. & Fabrycky, D. C. 2010, ApJ, 722, 937<br />
Delfosse, X., Bonfils, X., Forveille, T., et al. 2012, arXiv:1202.2467<br />
Delfosse, X., Forveille, T., Ségransan, D., et al. 2000, A&A, 364, 217<br />
Dole, S. H. 1964, Habitable planets for man (Blaisdell Pub. Co.)<br />
Edmunds, M. G. 1978, A&A, 64, 103<br />
Edson, A., Lee, S., Bannon, P., Kasting, J. F., & Pollard, D. 2011, Icarus, 212, 1<br />
Edson, A. R., Kasting, J. F., Pollard, D., Lee, S., & Bannon, P. R. 2012,<br />
Astrobiology, 12, 562<br />
Fabrycky, D. C., Lissauer, J. J., Ragozzine, D., et al. 2012, ArXiv e-prints<br />
Ferraz-Mello, S., Micchtchenko, T. A., & Beaugé, C. 2006, Regular motions in<br />
extra-solar <strong>planetary</strong> <strong>system</strong>s (Springer), 255<br />
Ferraz-Mello, S., Rodríguez, A., & Hussmann, H. 2008, Celestial Mechanics and<br />
Dynamical Astronomy, 101, 171<br />
Ford, E. B. 2005, AJ, 129, 1706<br />
Forveille, T., Bonfils, X., Lo Curto, G., et al. 2011, A&A, 526, A141+<br />
Geballe, T. R., Knapp, G. R., Leggett, S. K., et al. 2002, ApJ, 564, 466<br />
Goldreich, P. 1966, Astron. J., 71, 1<br />
Gregory, P. C. 2012, ArXiv e-prints<br />
Haario, H., Saksman, E., & Tamminen, J. 2001, Bernouilli, 7, 223<br />
Hansen, B. & Murray, N. 2013, ArXiv e-prints<br />
Hansen, B. M. S. & Murray, N. 2012, ApJ, 751, 158<br />
Hart, M. H. 1979, Icarus, 37, 351<br />
Hawley, S. L. & Pettersen, B. R. 1991, Astrophys. J., 378, 725<br />
Heller, R. 2012, A&A, 545, L8<br />
Heller, R. & Barnes, R. 2013, Astrobiology, 13, 18<br />
Heller, R., Leconte, J., & Barnes, R. 2011, Astro. & Astrophys., 528, A27+<br />
Husser, T. O., Wende, S., Dreizler, S., et al. 2013, submitted to å<br />
Hut, P. 1981, Astro. & Astrophys., 99, 126<br />
Ikoma, M., Emori, H., & Nakazawa, K. 2001, ApJ, 553, 999<br />
Jackson, B., Barnes, R., & Greenberg, R. 2008, Mon. Not. Roy. Astron. Soc.,<br />
391, 237<br />
Jenkins, C. R. & Peacock, J. A. 2011, MNRAS, 413, 2895<br />
Jenkins, J. S., Jones, H. R. A., Tuomi, M., et al. 2013, ApJ, 766, 67<br />
Joshi, M. 2003, Astrobiology, 3, 415<br />
Joshi, M. & Haberle, R. 2011, ArXiv e-prints<br />
Joshi, M. M., Haberle, R. M., & Reynolds, R. T. 1997, Icarus, 129, 450<br />
Kaltenegger, L. 2000, in ESA Special Publication, Vol. 462, Exploration and<br />
Utilisation of the Moon, ed. B. H. Foing & M. Perry, 199<br />
Kasting, J. F., Whitmire, D. P., & Reynolds, R. T. 1993, Icarus, 101, 108<br />
Kiang, N. Y., Segura, A., Tinetti, G., et al. 2007, Astrobiology, 7, 252<br />
Kipping, D. M. 2009, MNRAS, 392, 181<br />
Kipping, D. M., Bakos, G. Á., Buchhave, L., Nesvorný, D., & Schmitt, A. 2012,<br />
ApJ, 750, 115<br />
Kopparapu, R. k., Ramirez, R., Kasting, J. F., et al. 2013, ArXiv e-prints<br />
Lambeck, K. 1977, Royal Society of London Philosophical Transactions Series<br />
A, 287, 545<br />
Laskar, J. 1990, Icarus, 88, 266<br />
Laskar, J. 1993, Celestial Mechanics and Dynamical Astronomy, 56, 191<br />
Laskar, J. & Robutel, P. 2001, Celestial Mechanics and Dynamical Astronomy,<br />
80, 39<br />
Laughlin, G. & Chambers, J. E. 2001, ApJ, 551, L109<br />
Leconte, J., Chabrier, G., Baraffe, I., & Levrard, B. 2010, Astro. & Astrophys.,<br />
516, A64+<br />
Lin, D. N. C., Bodenheimer, P., & Richardson, D. C. 1996, Nature, 380, 606<br />
Lissauer, J. J. 2007, Astrophys. J., 660, L149<br />
Lissauer, J. J., Hubickyj, O., D’Angelo, G., & Bodenheimer, P. 2009, Icarus,<br />
199, 338<br />
Lo Curto, G., Mayor, M., Benz, W., et al. 2010, A&A, 512, A48<br />
Lovis, C., Dumusque, X., Santos, N. C., et al. 2011, arXiv:1107.5325<br />
Makarov, V. V. & Efroimsky, M. 2013, ApJ, 764, 27<br />
Mayor, M., Bonfils, X., Forveille, T., et al. 2009, A&A, 507, 487<br />
Mermilliod, J.-C. 1986, Catalogue of Eggen’s UBV data., 0 (1986),<br />
Mielke, S. P., Kiang, N. Y., Blankenship, R. E., & Mauzerall, D. 2013,<br />
Biochimica et Biophysica Acta (BBA) - Bioenergetics, 1827, 255<br />
Murray, C. D. & Dermott, S. F. 1999, Solar <strong>system</strong> dynamics (Cambridge<br />
University Press)<br />
Neron de Surgy, O. & Laskar, J. 1997, Astro. & Astrophys., 318, 975<br />
Pepe, F., Mayor, M., Galland, & et al. 2002, A&A, 388, 632<br />
Pierrehumbert, R. T. 2011, Astrophys. J., 726, L8+<br />
Rauch, K. P. & Hamilton, D. P. 2002, in Bulletin of the American Astronomical<br />
Society, Vol. 34, AAS/Division of Dynamical Astronomy Meeting #33, 938<br />
Raymond, S. N., Scalo, J., & Meadows, V. S. 2007, Astrophys. J., 669, 606<br />
Reiners, A. 2005, Astronomische Nachrichten, 326, 930<br />
Reiners, A. & Mohanty, S. 2012, ApJ, 746, 43<br />
Reiners, A., Shulyak, D., Anglada-Escude, G., et al. 2013, ArXiv e-prints<br />
Reynolds, R. T., McKay, C. P., & Kasting, J. F. 1987, Advances in Space<br />
Research, 7, 125<br />
Segura, A., Krelove, K., Kasting, J. F., et al. 2003, Astrobiology, 3, 689<br />
Segura, A., Walkowicz, L. M., Meadows, V., Kasting, J., & Hawley, S. 2010,<br />
Astrobiology, 10, 751<br />
Selsis, F., Kasting, J. F., Levrard, B., & et al. 2007, A&A, 476, 1373<br />
Shields, A. e. a. 2013, AsBio, submitted<br />
Skrutskie, M. F., Cutri, R. M., Stiening, R., et al. 2006, AJ, 131, 1163<br />
Spencer, J. R., Rathbun, J. A., Travis, L. D., et al. 2000, Science, 288, 1198<br />
Tachinami, C., Senshu, H., & Ida, S. 2011, ApJ, 726, 70<br />
Tinney, C. G., Wittenmyer, R. A., Butler, R. P., et al. 2011, ApJ, 732, 31<br />
Tuomi, M. 2011, A&A, 528, L5<br />
Tuomi, M. 2012, A&A, 543, A52<br />
Tuomi, M. & Anglada-Escudé, G. 2013, submitted to A&A, –,<br />
Tuomi, M., Anglada-Escudé, G., Gerlach, E., et al. 2013, A&A, 549, A48<br />
Tuomi, M. & Jenkins, J. S. 2012, arXiv:1211.1280<br />
Tuomi, M., Jones, H. R. A., Jenkins, J. S., et al. 2012, arXiv:1212.4277<br />
Tuomi, M., Pinfield, D., & Jones, H. R. A. 2011, A&A, 532, A116<br />
Udry, S., Bonfils, X., Delfosse, X., et al. 2007, A&A, 469, L43<br />
van Leeuwen, F. 2007, A&A, 474, 653<br />
Vogt, S. S., Butler, R. P., Rivera, E. J., et al. 2010, ApJ, 723, 954<br />
von Braun, K., Boyajian, T. S., Kane, S. R., et al. 2011, ApJ, 729, L26<br />
Watson, A. J., Donahue, T. M., & Walker, J. C. G. 1981, Icarus, 48, 150<br />
West, A. A., Hawley, S. L., Bochanski, J. J., et al. 2008, Astron. J., 135, 785<br />
Williams, D. M., Kasting, J. F., & Wade, R. A. 1997, Nature, 385, 234<br />
Wordsworth, R. D., Forget, F., Selsis, F., et al. 2011, Astrophys. J., 733, L48+<br />
Yoder, C. F. 1995, in Global Earth Physics: A Handbook of Physical Constants,<br />
ed. T. J. Ahrens, 1–+<br />
Zakamska, N. L., Pan, M., & Ford, E. B. 2011, MNRAS, 410, 1895<br />
Zechmeister, M., Kürster, M., Endl, M., et al. 2013, A&A, 552, A78<br />
20
Guillem Anglada-Escudé et al.: Three HZ super-Earths in a seven-planet <strong>system</strong><br />
Table A.1. Reference prior probability densities and ranges of the<br />
model parameters<br />
Parameter π(θ) Interval Hyper-parameter<br />
values<br />
K Uniform [0, K max ] K max = 5 m s −1<br />
ω Uniform [0, 2π] –<br />
e ∝ N(0, σ 2 e) [0,1] σ e = 0.3<br />
M 0 Uniform [0, 2π] –<br />
σ J Uniform [0, K max ] (*)<br />
γ Uniform [−K max , K max ] (*)<br />
ϕ Uniform [-1, 1]<br />
log P Uniform [log P 0 , log P max ] P 0 = 1.0 days<br />
P max = 3000 days<br />
Notes. * Same K max as for the K parameter in first row.<br />
Appendix A: Priors<br />
The choice of uninformative and adequate priors plays a central<br />
role in Bayesian statistics. More classic methods -such as<br />
weighted least-squares solvers- can be derived from Bayes theorem<br />
by assuming uniform prior distributions for all free parameters.<br />
Using the definition of Eq. 3, one can quickly note that,<br />
under coordinate transformations in the parameter space (e.g.,<br />
change from P to P −1 as the free parameter) the posterior probability<br />
distribution will change its shape through the Jacobian<br />
determinant of this transformation. This means that the posterior<br />
distributions are substantially different under changes of parameterizations<br />
and, even in the case of least-square statistics, one<br />
must be very aware of the prior choices made (explicit, or implicit<br />
through the choice of parameterization). This discussion<br />
is addressed in more detail in Tuomi & Anglada-Escudé (2013).<br />
For the Doppler data of <strong>GJ</strong> <strong>667C</strong>, our reference prior choices<br />
are summarized in Table A.1. The basic rationale on each prior<br />
choice can also be found in Tuomi (2012), Anglada-Escudé &<br />
Tuomi (2012) and Tuomi & Anglada-Escudé (2013). The prior<br />
choice for the eccentricity can be decisive in detection of weak<br />
signals. Our choice for this prior (N(0, σ 2 e)) is justified using<br />
statistical, dynamical and population arguments.<br />
A.1. Eccentricity prior : statistical argument<br />
The first argument is based on statistical considerations to minimize<br />
the risk of false positives. That is, since e is a strongly<br />
non-linear parameter in the Keplerian model of Doppler signals<br />
(especially if e >0.5), the likelihood function has many local<br />
maxima <strong>with</strong> high eccentricities. Although such solutions might<br />
appear very significant, it can be shown that, when the detected<br />
amplitudes approach the uncertainty in the measurements, these<br />
high-eccentricity solutions are mostly spurious.<br />
To illustrate this, we generate simulated sets of observations<br />
(same observing epochs, no signal, Gaussian white noise injected,<br />
1m s −1 jitter level), and search for the maximum likelihood<br />
solution using the log–L periodograms approach (assuming<br />
a fully Keplerian solution at the period search level, see<br />
Section 4.2). Although no signal is injected, solutions <strong>with</strong> a<br />
formal false-alarm probability (FAP) smaller than 1% are found<br />
in 20% of the sample. On the contrary, our log–L periodogram<br />
search for circular orbits found 1.2% of false positives, matching<br />
the expectations given the imposed 1% threshold. We performed<br />
an additional test to assess the impact of the eccentricity prior on<br />
the detection completeness. That is, we injected one Keplerian<br />
signal (e = 0.8) at the same observing epochs <strong>with</strong> amplitudes<br />
of 1.0 m s −1 and white Gaussian noise of 1 m s −1 . We then performed<br />
the log–L periodogram search on a large number of these<br />
datasets (10 3 ). When the search model was allowed to be a fully<br />
Keplerian orbit, the correct solution was only recovered 2.5% of<br />
the time, and no signals at the right period were spotted assuming<br />
a circular orbit. With a K = 2.0 m s −1 , the situation improved<br />
and 60% of the orbits were identified in the full Keplerian case,<br />
against 40% of them in the purely circular one. More tests are illustrated<br />
in the left panel of Fig. A.1. When an eccentricity of 0.4<br />
and K=1 m s −1 signal was injected, the completeness of the fully<br />
Keplerian search increased to 91% and the completeness of the<br />
circular orbit search increased to 80%. When a K = 2 m s −1 or<br />
larger signal was injected, the orbits were identified in > 99% of<br />
the cases. We also obtained a histogram of the semi-amplitudes<br />
of the false positive detections obtained when no signal was injected.<br />
The histogram shows that these amplitudes were smaller<br />
than 1.0 m s −1 <strong>with</strong> a 99% confidence level (see right panel of<br />
Fig. A.1). This illustrates that statistical tests based on point estimates<br />
below to the noise level do not produce reliable assessments<br />
on the significance of a fully Keplerian signal. For a given<br />
dataset, information based on simulations (e.g., Fig. A.1) or a<br />
physically motivated prior is necessary to correct such detection<br />
bias (Zakamska et al. 2011).<br />
In summary, although some sensitivity is lost (a few very<br />
eccentric solutions might be missed), the rate of false positive<br />
detections (∼ 20%) is unacceptable at the low amplitude regime<br />
if the signal search allows a uniform prior on the eccentricity.<br />
Furthermore, only a small fraction of highly eccentric orbits<br />
are missed if the search is done assuming strictly circular orbits.<br />
This implies that, for log–likelihood periodogram searches,<br />
circular orbits should always be assumed when searching for a<br />
new low-amplitude signals and that, when approaching amplitudes<br />
comparable to the measurement uncertainties, assuming<br />
circular orbits is a reasonable strategy to avoid false positives.<br />
In a Bayesian sense, this means that we have to be very skeptic<br />
of highly eccentric orbits when searching for signals close to<br />
the noise level. The natural way to address this self-consistently<br />
is by imposing a prior on the eccentricity that suppresses the<br />
likelihood of highly eccentric orbits. The log–Likelihood periodograms<br />
indicate that the strongest possible prior (force e=0),<br />
already does a very good job so, in general, any function less informative<br />
than a delta function (π(e) = δ(0)) and a bit more constraining<br />
than a uniform prior (π(e) = 1) can provide a more optimal<br />
compromise between sensitivity and robustness. Our particular<br />
functional choice of the prior (Gaussian distribution <strong>with</strong><br />
zero-mean and σ = 0.3) is based on dynamical and population<br />
analysis considerations.<br />
A.2. Eccentricity prior : dynamical argument<br />
From a physical point of view, we expect a priori that eccentricities<br />
closer to zero are more probable than those close to unity<br />
when multiple planets are involved. That is, when one or two<br />
planets are clearly present (e.g. <strong>GJ</strong> <strong>667C</strong>b and <strong>GJ</strong> <strong>667C</strong>c are<br />
solidly detected even <strong>with</strong> a flat prior in e), high eccentricities in<br />
the remaining lower amplitude candidates would correspond to<br />
unstable and therefore physically impossible <strong>system</strong>s.<br />
Our prior for e takes this feature into account (reducing the<br />
likelihood of highly eccentric solutions) but still allows high eccentricities<br />
if the data insists so (Tuomi 2012). At the sampling<br />
level, the only orbital configurations that we explicitly forbid<br />
is that we do not allow solutions <strong>with</strong> orbital crossings. While<br />
a rather weak limitation, this requirement essentially removes<br />
all extremely eccentric multiplanet solutions (e >0.8) from our<br />
21
Guillem Anglada-Escudé et al.: Three HZ super-Earths in a seven-planet <strong>system</strong><br />
100<br />
1<br />
Completeness (in %)<br />
80<br />
60<br />
40<br />
20<br />
False<br />
positive<br />
ratio<br />
e>0.0<br />
Injected e=0.8, Keplerian search<br />
Injected e=0.8, circular search<br />
Injected e=0.4, Keplerian search<br />
Injected e=0.4, circular search<br />
e=0<br />
0<br />
0 1 2 3 4 5<br />
Injected amplitude [m s -1 ]<br />
Cumulative probability<br />
0.8<br />
0.6<br />
0.4<br />
0.2<br />
0<br />
0 0.5 1<br />
Recovered K from false positives [m s -1 ]<br />
Fig. A.1. Left panel. Detection completeness as a function of the injected signal using a fully Keplerian search versus a circular orbit search.<br />
Red and blue lines are for an injected eccentricity of 0.8, and the brown and purple ones are for injected signals <strong>with</strong> eccentricity of 0.4. Black<br />
horizontal lines on the left show the fraction of false-positive detections satisfying the FAP threshold of 1% using both methods (Keplerian versus<br />
circular). While the completeness is slightly enhanced in the low K regime, the fraction of false positives is unacceptable and, therefore, the<br />
implicit assumptions of the method (e.g., uniform prior for e) are not correct. Right panel. Distribution of semi-amplitudes K for these false<br />
positive detections. Given that the injected noise level is 1.4 m s −1 (1 m s −1 nominal uncertainty, 1 m s −1 jitter), it is clear that signals detected <strong>with</strong><br />
fully Keplerian log–L periodograms <strong>with</strong> K below the noise level cannot be trusted.<br />
MCMC samples. This requirement does not, for example, remove<br />
orbital configurations <strong>with</strong> close encounters between planets,<br />
and the solutions we receive still have to be analyzed by numerical<br />
integration to make sure that they correspond to stable<br />
<strong>system</strong>s. As shown in Section 8, posterior numerical integration<br />
of the samplings illustrate that our prior function was, after all,<br />
rather conservative.<br />
A.3. Eccentricity prior : population argument<br />
To investigate how realistic our prior choice is compared to the<br />
statistical properties of the known exoplanet populations, we<br />
obtained the parameters of all planet candidates <strong>with</strong> M sin i<br />
smaller than 0.1 M jup as listed in The Extrasolar Planets<br />
Encyclopaedia 3 as in Dec 1, 2012. We then produced a histogram<br />
in eccentricity bins of 0.1. The obtained distribution<br />
follows very nicely a Gaussian function <strong>with</strong> zero mean an<br />
σ e = 0.2, meaning that our prior choice is more uninformative<br />
(and therefore, more conservative) than the current distribution<br />
of detections. This issue is the central topic of Tuomi & Anglada-<br />
Escudé (2013), and a more detailed discussion (plus some illustrative<br />
plots) can be found in there.<br />
Appendix B: Detailed Bayesian detection<br />
sequences<br />
In this section, we provide a more detailed description of detections<br />
of seven signals in the combined HARPS-TERRA, PFS,<br />
and HIRES data. We also show that the same seven signals (<strong>with</strong><br />
some small differences due to aliases) are also detected independently<br />
detected when using HARPS-CCF velocities instead of<br />
HARPS TERRA ones. The PFS and HIRES measurements used<br />
are again those provided in Anglada-Escudé & Butler (2012).<br />
B.1. HARPS-CCF, PFS and HIRES<br />
First, we perform a detailed analysis <strong>with</strong> the CCF values provided<br />
by Delfosse et al. (2012) in combination <strong>with</strong> the PFS and<br />
3 http:<br />
exoplanet.eu<br />
HIRES velocities. When increasing the number of planets, parameter<br />
k, in our statistical model, we were able to determine<br />
the relative probabilities of models <strong>with</strong> k = 0, 1, 2, ... rather easily.<br />
The parameter spaces of all models could be sampled <strong>with</strong><br />
our Markov chains relatively rapidly and the parameters of the<br />
signals converged to the same periodicities and RV amplitudes<br />
regardless of the exact initial states of the parameter vectors.<br />
Unlike in Anglada-Escudé et al. (2012) and Delfosse et al.<br />
(2012), we observed immediately that k = 2 was not the number<br />
of signals favored by the data. While the obvious signals at 7.2<br />
and 28.1 days were easy to detect using samplings of the parameter<br />
space, we also quickly discovered a third signal at a period<br />
of 91 days. These signals correspond to the planets <strong>GJ</strong> <strong>667C</strong><br />
b, c, and d of Anglada-Escudé et al. (2012) and Delfosse et al.<br />
(2012), respectively, though the orbital period of companion d<br />
was found to be 75 days by Anglada-Escudé et al. (2012) and<br />
106 days by Delfosse et al. (2012). The periodograms also show<br />
considerable power at 106 days corresponding to the solution<br />
of Delfosse et al. (2012). Again, it did not provide a solution<br />
as probable as the signal at 91 days and the inclusion of linear<br />
correlation terms <strong>with</strong> activity did not affect its significance (see<br />
also Sec. 6).<br />
We could identify three more signals in the data at 39, 53,<br />
and 260 days <strong>with</strong> low RV amplitudes of 1.31, 0.96, and 0.97<br />
ms −1 , respectively. The 53-day signal had a strong alias at 62<br />
days and so we treated these as alternative models and calculated<br />
their probabilities as well. The inclusion of k = 6 and k = 7<br />
signals at 260 and 17 days improved the models irrespective of<br />
the preferred choice of the period of planet e (see Table B.1).<br />
To assess the robustness of the detection of the 7-th signal, we<br />
started alternative chains at random periods. All the chains that<br />
show good signs of convergence (bound period) unequivocally<br />
suggested 17 days for the last candidate. Since all these signals<br />
satisfied our Bayesian detection criteria, we promoted all of them<br />
to planet candidates.<br />
We performed samplings of the parameter space of the model<br />
<strong>with</strong> k = 8 but could not spot a clear 8-th periodicity. The period<br />
of such 8th signal converged to a broad probability maximum between<br />
1200 and 2000 days but the corresponding RV amplitude<br />
received a posterior density that did not differ significantly from<br />
zero. The probability of the model <strong>with</strong> k = 8 only exceeded the<br />
probability of k = 7 by a factor of 60.<br />
22
Guillem Anglada-Escudé et al.: Three HZ super-Earths in a seven-planet <strong>system</strong><br />
Table B.1. Relative posterior probabilities and log-Bayes factors of models M k <strong>with</strong> k Keplerian signals given the combined HARPS-CCF, HIRES,<br />
and PFS RV data on the left and HARPS-TERRA HIRES, PFS on the right. Factor ∆ indicates how much the probability increases <strong>with</strong> respect<br />
to the best model <strong>with</strong> one less Keplerian signal and P s denotes the MAP period estimate of the signal added to the solution when inreasing the<br />
number k. For k =4, 5, 6, and 7, we denote all the signals on top of the three most significant ones at 7.2, 28, and 91 days because the 53 and 62<br />
day periods are each other’s yearly aliases and the relative significances of these two and the signal <strong>with</strong> a period of 39 days are rather similar.<br />
HARPS-CCF, PFS, HIRES<br />
HARPS-TERRA, PFS, HIRES<br />
k P(M k |d) ∆ log P(d|M k ) P s [days] P(M k |d) ∆ log P(d|M k ) P s [days]<br />
0 2.2×10 −74 – -629.1 – 2.7×10 −85 – -602.1 –<br />
1 2.4×10 −40 1.1×10 34 -550.0 7.2 3.4×10 −48 1.3×10 37 -516.0 7.2<br />
2 1.3×10 −30 5.6×10 9 -526.9 28 1.3×10 −35 3.9×10 12 -486.3 91<br />
3 8.7×10 −21 6.5×10 9 -503.6 91 8.9×10 −18 6.7×10 17 -444.5 28<br />
4 5.1×10 −17 5.9×10 3 -494.2 39 1.5×10 −14 1.7×10 3 -436.4 39<br />
4 1.0×10 −14 1.2×10 6 -488.9 53 1.9×10 −14 2.1×10 3 -436.2 53<br />
4 2.0×10 −17 2.3×10 3 -495.2 62 1.2×10 −14 1.3×10 3 -436.7 62<br />
5 8.0×10 −9 7.6×10 5 -474.7 39, 53 1.0×10 −7 5.5×10 6 -420.0 39, 53<br />
5 5.4×10 −12 5.2×10 2 -482.0 39, 62 1.0×10 −8 5.3×10 5 -422.3 39, 62<br />
6 3.4×10 −4 4.3×10 4 -463.3 39, 53, 256 4.1×10 −3 4.0×10 4 -408.7 39, 53, 256<br />
6 1.3×10 −7 16 -471.2 39, 62, 256 4.1×10 −4 4.0×10 3 -411.0 39, 62, 256<br />
7 0.998 2.9×10 3 -454.6 17, 39, 53, 256 0.057 14 -405.4 17, 39, 53, 256<br />
7 1.5×10 −3 4.3 -461.2 17, 39, 62, 256 0.939 230 -402.6 17, 39, 62, 256<br />
Table B.2. Seven-Keplerian solution of the combined RVs of <strong>GJ</strong> <strong>667C</strong> <strong>with</strong> HARPS-CCF data. MAP estimates of the parameters and their 99%<br />
BCSs. Corresponding solution derived from HARPS-TERRA data is given in table 4. Note that each dataset prefers a different alias for planet f<br />
(53 versus 62 days).<br />
Parameter b h c f<br />
P [days] 7.1998 [7.1977, 7.2015] 16.955 [16.903, 17.011] 28.147 [28.084, 28.204] 39.083 [38.892, 39.293]<br />
e 0.10 [0, 0.25] 0.16 [0, 0.39] 0.02 [0, 0.20] 0.03 [0, 0.18]<br />
K [ms −1 ] 3.90 [3.39, 4.37] 0.80 [0.20, 1.34] 1.60 [1.09, 2.17] 1.31 [0.78, 1.85]<br />
ω [rad] 0.2 [0, 2π] 2.3 [0, 2π] 2.3 [0, 2π] 3.6 [0, 2π]<br />
M 0 [rad] 3.2 [0, 2π] 6.0 [0, 2π] 2.9 [0, 2π] 2.8 [0, 2π]<br />
e d g<br />
P [days] 53.19 [52.73, 53.64] 91.45 [90.81, 92.23] 256.4 [248.6, 265.8]<br />
e 0.13 [0, 0.19] 0.12 [0, 0.29] 0.18 [0, 0.49]<br />
K [ms −1 ] 0.96 [0.48, 1.49] 1.56 [1.11, 2.06] 0.97 [0.41, 1.53]<br />
ω [rad] 0.8 [0, 2π] 3.0 [0, 2π] 6.2 [0, 2π]<br />
M 0 [rad] 5.9 [0, 2π] 5.4 [0, 2π] 1.0 [0, 2π]<br />
γ 1 [ms −1 ] (HARPS) -32.6 [-37.3, -28.2]<br />
γ 2 [ms −1 ] (HIRES) -33.3 [-38.9,, -28.2]<br />
γ 3 [ms −1 ] (PFS) -27.7 [-31.0, -24.0]<br />
˙γ [ms −1 a −1 ] 2.19 [1.90, 2.48]<br />
σ J,1 [ms −1 ] (HARPS) 0.80 [0.20, 1.29]<br />
σ J,2 [ms −1 ] (HIRES) 2.08 [0.54, 4.15]<br />
σ J,3 [ms −1 ] (PFS) 1.96 [0.00, 4.96]<br />
We therefore conclude that the combined data set <strong>with</strong><br />
HARPS-CCF RVs was in favor of k = 7. The corresponding<br />
orbital parameters of these seven Keplerian signals are shown in<br />
Table B.2. Whether there is a weak signal at roughly 1200-2000<br />
days or not remains to be seen when future data become available.<br />
The naming of the seven candidate planets (b to h) follows<br />
the significance of detection.<br />
B.2. HARPS-TERRA, PFS and HIRES (reference solution)<br />
The HARPS-TERRA velocities combined <strong>with</strong> PFS and HIRES<br />
velocities contained the signals of <strong>GJ</strong> <strong>667C</strong> b, c, and d very<br />
clearly. We could extract these signals from the data <strong>with</strong> ease<br />
and obtained estimates for orbital periods that were consistent<br />
<strong>with</strong> the estimates obtained using the CCF data in the previous<br />
subsection. Unlike for the HARPS-CCF data, however, the<br />
91 day signal was more significantly present in the HARPS-<br />
TERRA data and it corresponded to the second most significant<br />
periodicity instead of the 28 day one. Also, increasing k<br />
improved the statistical model significantly and we could again<br />
detect all the additional signals in the RVs.<br />
As for the CCF data, we branched the best fit solution into<br />
the two preferred periods for the planet e (53/62 days). The solution<br />
and model probabilities are listed on the right-side of Table<br />
B.1. The only significant difference compared to the HARPS-<br />
CCF one is that the 62-day period for planet e is now preferred.<br />
Still, the model <strong>with</strong> 53 days is only seventeen times less probable<br />
than the one <strong>with</strong> a 62 days signal, so we cannot confidently<br />
rule out that the 53 days one is the real one. For simplicity and to<br />
avoid confusion, we use the 62-day signal in our reference solution<br />
and is the one used to analyze dynamical stability and habitability<br />
for the <strong>system</strong>. As an additional check, preliminary dynamical<br />
analysis of solutions <strong>with</strong> a period of 53 days for planet<br />
e showed very similar behavior to the reference solution in terms<br />
of long-term stability (similar fraction of <strong>dynamically</strong> stable orbits<br />
and similar distribution for the D chaos indices). Finally,<br />
we made several efforts at sampling the eight-Keplerian model<br />
<strong>with</strong> different initial states. As for the CCF data, there are hints<br />
23
Guillem Anglada-Escudé et al.: Three HZ super-Earths in a seven-planet <strong>system</strong><br />
of a signal in the ∼ 2000 days period domain that could not be<br />
constrained.<br />
Appendix C: Further activity-related tests<br />
C.1. Correlated noise<br />
The possible effect of correlated noise must be investigated together<br />
<strong>with</strong> the significance of the reported detections (e.g. <strong>GJ</strong><br />
581; Baluev 2012; Tuomi & Jenkins 2012). We studied the impact<br />
of correlated noise by adding a first order Moving Average<br />
term (MA(1), see Tuomi et al. 2012) to the model in Eq. 1<br />
and repeated the Bayesian search for all the signals. The MA(1)<br />
model proposed in (Tuomi et al. 2012) contains two free parameters:<br />
a characteriztic time-scale τ and a correlation coefficient<br />
c. Even for the HARPS data set <strong>with</strong> the greatest number of Fig. C.1. Value of the linear correlation parameter of the S-index (C S )<br />
measurements, the characteristic time-scale could not be constrained.<br />
Similarly, the correlation coefficient (see e.g. Tuomi tion of planet d).<br />
<strong>with</strong> the radial velocity data for a model <strong>with</strong> k = 3 Keplerians (detec-<br />
et al. 2013, 2012) had a posteriori density that was not different<br />
from its prior, i.e. it was found to be roughly uniform in the<br />
of each apperture were considered as free parameters. To assess<br />
interval [-1,1], which is a natural range for this parameter because<br />
it makes the corresponding MA model stationary. While<br />
the wavelength dependence of each signal, the Keplerian model<br />
of the i-th planet (one planet at a time) also contained one semiamplitude<br />
K<br />
the k = 7 searches lead to the same seven planet solution, models<br />
containing such noise terms produced lower integrated probabilities,<br />
which suggests over-parameterization. When this happens, i , ω i , M 0,i and P i ) where common to all apertures. The result-<br />
i,l per echelle apperture and all the other parameters<br />
(e<br />
ing statistical model has 72 × 3 + 5 × k − 1 parameters when<br />
one should use the simplest model (principle of parsimony) and<br />
k Keplerian signals are included and one is investigated (250<br />
accept that the noise is better explained by the white noise components<br />
only. Finally, very low levels of correlated noise are also<br />
free parameters for k = 7). We started the posterior samplings<br />
in the vicinity of the solutions of interest because searching the<br />
consistent <strong>with</strong> the good match between synthetic and real periodograms<br />
of subsamples in Section 7.<br />
period space would have been computationally too demanding.<br />
Neglecting the searches for periodicities, we could obtain relatively<br />
well converged samples from the posterior densities in a<br />
C.2. Including activity correlation in the model<br />
reasonable time-scale (few days of computer time).<br />
The result is the semi-amplitude K of each signal measured<br />
Because the HARPS activity-indices (S-index, FWHM, and as a function of wavelength. Plotting this K against central wavelength<br />
of each echelle order enabled us to visually assess if<br />
BIS) were available, we analyzed the data by taking into account<br />
possible correlations <strong>with</strong> any of these indices. We added an extra<br />
component into the statistical model taking into account lin-<br />
were signals only present in a few echelle orders) and check if<br />
signals had strong wavelength dependencies (i.e. whether there<br />
ear correlation <strong>with</strong> each of these parameters as F(t i , C) = C z i the obtained solution was consistent <strong>with</strong> the one derived from<br />
(see Eq. 1), where z i is the any of the three indices at epoch t i . the combined Doppler measurements. By visual inspection and<br />
In Section 6, we found that the log–L of the solution for applying basic statistical tests, we observed that the scatter in<br />
planet d slightly improved when adding the correlation term. the amplitudes for all the candidates was consistent <strong>with</strong>in the<br />
The slight improvement of the likelihood is compatible <strong>with</strong> a error bars and no significant <strong>system</strong>atic trend (e.g. increasing K<br />
consistently positive estimate of C for both FWHM and the S- towards the blue or the red) was found in any case. Also, the<br />
index obtained <strong>with</strong> the MC samplings (see Fig. C.1, for an example<br />
distribution of C S−index as obtained <strong>with</strong> a k = 3 model). <strong>with</strong> the values in Table 4. We are developing a more quantitave<br />
weighted means of the derived amplitudes were fully consistent<br />
While the correlation terms were observed to be mostly positive version of these tests by studying reported activity-induced signals<br />
on a larger sample of stars. As examples of low–amplitude<br />
in all cases, the 0 value for the coefficient was always <strong>with</strong>in the<br />
95% credibility interval. Moreover, we found that the integrated wavelength-dependent signals ruled out using similar tests in<br />
model probabilities decreased when compared to the model <strong>with</strong> the HARPS wavelength range see : Tuomi et al. (2013) on HD<br />
the same number of planets but no correlation term included. 40307 (K3V), Anglada-Escudé & Butler (2012) on HD 69830<br />
This means that such models are over-parameterized and, therefore,<br />
they are penalized by the principle of parsimony.<br />
Leo (M3V).<br />
(G8V) and Reiners et al. (2013) on the very active M dwarf AD<br />
C.3. Wavelength dependence of the signals<br />
Stellar activity might cause spurious Doppler variability that<br />
is wavelength dependent (e.g., cool spots). Using the HARPS-<br />
TERRA software on the HARPS spectra only, we extracted one<br />
time-series for each echelle aperture (72 of them). This process<br />
results is N obs = 72 × 173 = 12456 almost independent RV measurements<br />
<strong>with</strong> corresponding uncertainties. Except for calibration<br />
related <strong>system</strong>atic effects (unkown at this level of precision),<br />
each echelle apperture can be treated as an independent instrument.<br />
Therefore, the reference velocities γ l and jitter terms σ l<br />
24
Guillem Anglada-Escudé et al.: Three HZ super-Earths in a seven-planet <strong>system</strong><br />
Table C.2. HARPS-TERRA Doppler measurements of <strong>GJ</strong> <strong>667C</strong>. Measurements are in the Barycenter of the Solar System and corrected for<br />
perspective acceleration. The median has been velocity has been subtracted for cosmetic purposes. Nominal uncertainties in FWHM and BIS are<br />
2.0 and 2.35 times the correspondin σ ccf (see Section 4.5 in Zechmeister et al. 2013). No consistent CCF measurement could be obtained for<br />
the last two spectra because of conflicting HARPS-DRS software versions (different binary masks) used to produce them. Except for those two<br />
spectra and according to the <strong>ESO</strong> archive documentation, all CCF measurements were generated using the default M2 binary mask.<br />
BJD RV T ERRA σ TERRA RV ccf σ ccf FWHM BIS S-index σ S<br />
(days) (m s −1 ) (m s −1 ) (m s −1 ) (m s −1 ) (km s −1 ) (m s −1 ) (–) (–)<br />
2453158.764366 -3.10 0.95 -3.11 1.05 3.0514 -7.93 0.4667 0.0095<br />
2453201.586794 -11.88 1.25 -11.8 1.09 3.0666 -9.61 0.4119 0.0074<br />
2453511.798846 -7.61 0.89 -9.22 1.07 3.0742 -7.42 0.5915 0.0088<br />
2453520.781048 -3.92 1.17 -0.37 1.23 3.0701 -11.99 0.4547 0.0082<br />
2453783.863348 0.25 0.61 0.34 0.65 3.0743 -13.31 0.4245 0.0053<br />
2453810.852282 -3.48 0.55 -3.00 0.54 3.0689 -10.62 0.4233 0.0044<br />
2453811.891816 2.20 1.08 0.24 1.02 3.0700 -9.37 0.4221 0.0066<br />
2453812.865858 -0.34 0.71 -0.56 0.72 3.0716 -9.78 0.4125 0.0054<br />
2453814.849082 -10.16 0.49 -10.06 0.47 3.0697 -10.63 0.4848 0.0042<br />
2453816.857459 -9.15 0.52 -9.89 0.65 3.0698 -12.20 0.4205 0.0051<br />
2453830.860468 -6.96 0.56 -7.29 0.59 3.0694 -11.59 0.4729 0.0052<br />
2453832.903068 -0.49 0.64 -0.35 0.68 3.0706 -13.33 0.4930 0.0058<br />
2453834.884977 -1.50 0.72 -1.68 0.57 3.0734 -8.20 0.4456 0.0049<br />
2453836.887788 -6.99 0.48 -6.24 0.48 3.0723 -8.27 0.4864 0.0044<br />
2453861.796371 6.38 0.59 7.84 0.59 3.0780 -11.47 0.6347 0.0060<br />
2453862.772051 6.69 0.76 8.00 0.74 3.0768 -12.54 0.5534 0.0065<br />
2453863.797178 4.57 0.59 4.58 0.56 3.0759 -10.71 0.4891 0.0051<br />
2453864.753954 1.21 0.68 2.52 0.65 3.0783 -9.21 0.4854 0.0055<br />
2453865.785606 -1.85 0.61 -2.55 0.55 3.0752 -7.73 0.4815 0.0050<br />
2453866.743120 -1.36 0.58 -2.32 0.49 3.0770 -7.49 0.5277 0.0045<br />
2453867.835652 -0.48 0.66 -0.05 0.64 3.0816 -10.55 0.4708 0.0055<br />
2453868.813512 2.34 0.56 0.62 0.61 3.0754 -10.01 0.4641 0.0053<br />
2453869.789495 3.85 0.63 4.73 0.65 3.0795 -12.71 0.4837 0.0055<br />
2453870.810097 2.37 0.88 2.82 0.81 3.0813 -10.48 0.4567 0.0062<br />
2453871.815952 -1.11 0.61 -3.03 0.81 3.0790 -9.16 0.5244 0.0068<br />
2453882.732970 -2.96 0.52 -4.17 0.51 3.0795 -8.09 0.5121 0.0047<br />
2453886.703550 -4.54 0.58 -3.78 0.48 3.0757 -10.11 0.4607 0.0042<br />
2453887.773514 -5.97 0.48 -3.98 0.44 3.0700 -10.94 0.4490 0.0041<br />
2453917.737524 -4.12 0.88 -2.44 1.14 3.0666 -10.91 0.5176 0.0084<br />
2453919.712544 0.98 0.99 0.69 1.17 3.0774 -8.01 0.4324 0.0073<br />
2453921.615825 -1.67 0.49 -1.24 0.51 3.0671 -9.87 0.4305 0.0043<br />
2453944.566259 -2.02 0.98 -2.16 1.00 3.0776 -9.25 0.6143 0.0079<br />
2453947.578821 3.89 1.68 5.83 2.43 3.0806 -8.54 0.7079 0.0134<br />
2453950.601834 -1.01 0.89 1.65 0.92 3.0780 -11.80 0.5612 0.0071<br />
2453976.497106 2.40 0.61 3.52 0.60 3.0791 -12.74 0.5365 0.0054<br />
2453979.594316 -2.67 0.95 -0.48 1.19 3.0776 -9.20 0.5517 0.0091<br />
2453981.555311 -4.77 0.64 -4.29 0.57 3.0749 -13.12 0.5339 0.0055<br />
2453982.526504 -4.36 0.81 -2.88 0.69 3.0717 -11.84 0.4953 0.0061<br />
2454167.866839 -1.87 0.62 -2.51 0.61 3.0798 -10.14 0.5141 0.0053<br />
2454169.864835 -0.10 0.59 -0.04 0.63 3.0793 -11.94 0.4729 0.0052<br />
2454171.876906 5.17 0.71 6.08 0.58 3.0744 -7.24 0.4893 0.0050<br />
2454173.856452 -1.18 0.83 -1.44 0.61 3.0746 -10.33 0.4809 0.0052<br />
2454194.847290 1.27 0.59 0.85 0.69 3.0756 -8.43 0.4586 0.0054<br />
2454196.819157 -3.57 0.79 -3.06 0.79 3.0759 -12.33 0.4809 0.0061<br />
2454197.797125 -3.83 0.86 -4.71 0.97 3.0726 -9.12 0.4584 0.0069<br />
2454198.803823 -4.06 0.76 -4.99 0.79 3.0708 -9.33 0.5685 0.0068<br />
2454199.854238 0.18 0.55 0.97 0.51 3.0714 -10.66 0.4652 0.0044<br />
2454200.815699 1.30 0.60 2.55 0.57 3.0708 -10.26 0.4468 0.0047<br />
2454201.918397 0.54 0.79 2.31 0.63 3.0681 -11.27 0.4690 0.0056<br />
2454202.802697 -2.96 0.69 -3.23 0.66 3.0696 -8.49 0.4954 0.0056<br />
2454227.831743 -1.26 0.84 0.47 0.95 3.0619 -9.96 0.4819 0.0071<br />
2454228.805860 3.35 0.68 5.19 0.65 3.0651 -15.03 0.4603 0.0055<br />
2454229.773888 7.44 1.29 7.23 1.28 3.0708 -6.34 0.5213 0.0082<br />
2454230.845843 1.51 0.58 1.97 0.62 3.0631 -8.92 0.4409 0.0053<br />
2454231.801726 -0.57 0.62 -1.15 0.55 3.0704 -8.86 0.5993 0.0055<br />
2454232.721251 -0.63 1.15 -2.17 1.41 3.0719 -9.70 0.3737 0.0079<br />
2454233.910349 -1.27 1.29 -2.10 1.68 3.0687 -12.12 0.5629 0.0112<br />
2454234.790981 -1.89 0.74 -1.48 0.66 3.0672 -8.39 1.2169 0.0093<br />
2454253.728334 0.99 0.79 1.65 0.84 3.0773 -10.30 0.4509 0.0062<br />
2454254.755898 -2.64 0.54 -3.25 0.52 3.0779 -7.99 0.4426 0.0046<br />
2454255.709350 -2.92 0.74 -2.83 0.72 3.0775 -7.36 0.4829 0.0059<br />
25
Guillem Anglada-Escudé et al.: Three HZ super-Earths in a seven-planet <strong>system</strong><br />
Table C.2. continued.<br />
BJD RV T ERRA σ TERRA RV ccf σ ccf FWHM BIS S-index σ S<br />
(days) (m s −1 ) (m s −1 ) (m s −1 ) (m s −1 ) (km s −1 ) (m s −1 ) (–) (–)<br />
2454256.697674 -0.21 0.97 -0.45 0.84 3.0775 -9.19 0.4608 0.0063<br />
2454257.704446 2.93 0.66 2.39 0.70 3.0766 -11.09 0.4549 0.0055<br />
2454258.698322 4.19 0.83 5.19 0.63 3.0799 -9.57 0.4760 0.0052<br />
2454291.675565 -5.58 1.16 -4.45 1.35 3.0802 -9.95 0.4298 0.0086<br />
2454292.655662 -4.37 0.75 -1.25 0.76 3.0820 -11.83 0.4487 0.0056<br />
2454293.708786 0.89 0.63 2.84 0.59 3.0732 -11.52 0.5344 0.0056<br />
2454295.628628 3.05 0.92 3.67 1.03 3.0786 -6.85 0.4975 0.0072<br />
2454296.670395 -4.68 0.75 -3.99 0.74 3.0703 -7.79 0.5453 0.0067<br />
2454297.631678 -5.53 0.63 -4.81 0.55 3.0725 -10.38 0.5212 0.0053<br />
2454298.654206 -5.39 0.67 -6.73 0.71 3.0743 -5.18 0.5718 0.0066<br />
2454299.678909 -1.46 0.85 -2.26 0.92 3.0785 -6.46 0.5299 0.0070<br />
2454300.764649 0.14 0.74 -0.07 0.63 3.0693 -12.07 0.4803 0.0057<br />
2454314.691809 -0.53 1.88 -2.89 2.22 3.0756 -12.48 0.3823 0.0102<br />
2454315.637551 3.41 1.12 2.31 1.47 3.0701 -10.42 0.4835 0.0091<br />
2454316.554926 5.78 0.96 6.61 1.12 3.0746 -6.02 0.4402 0.0069<br />
2454319.604048 -6.64 0.79 -7.01 0.59 3.0694 -7.54 0.4643 0.0052<br />
2454320.616852 -5.58 0.65 -6.49 0.69 3.0698 -3.94 0.4611 0.0057<br />
2454340.596942 -1.52 0.60 -0.55 0.55 3.0691 -10.11 0.4480 0.0048<br />
2454342.531820 -2.39 0.66 -1.74 0.54 3.0667 -9.95 0.4573 0.0048<br />
2454343.530662 0.55 0.64 1.39 0.61 3.0669 -7.25 0.4900 0.0055<br />
2454346.551084 -0.17 1.01 -0.82 1.14 3.0677 -5.48 0.5628 0.0086<br />
2454349.569500 -5.24 0.65 -4.02 0.77 3.0658 -11.12 0.3809 0.0058<br />
2454522.886464 -1.68 0.70 -1.11 0.61 3.0688 -9.85 0.5582 0.0056<br />
2454524.883089 4.38 0.69 3.05 0.69 3.0668 -8.66 0.4779 0.0057<br />
2454525.892144 1.96 0.72 0.69 0.58 3.0692 -8.77 0.4202 0.0047<br />
2454526.871196 -1.08 0.54 0.30 0.52 3.0717 -9.58 0.4898 0.0046<br />
2454527.897962 -2.69 0.64 -3.31 0.65 3.0689 -8.46 0.4406 0.0052<br />
2454528.903672 -2.80 0.71 -5.04 0.74 3.0679 -8.40 0.4666 0.0058<br />
2454529.869217 0.48 0.63 -0.10 0.62 3.0664 -8.23 0.4255 0.0050<br />
2454530.878876 1.40 0.68 1.38 0.53 3.0667 -7.31 0.4331 0.0044<br />
2454550.901932 -6.95 0.70 -6.46 0.58 3.0680 -5.44 0.4330 0.0047<br />
2454551.868783 -3.73 0.65 -3.44 0.53 3.0654 -7.36 0.4287 0.0045<br />
2454552.880221 0.24 0.59 -0.25 0.50 3.0665 -9.12 0.4342 0.0042<br />
2454554.846366 2.14 0.57 1.73 0.68 3.0699 -5.49 0.4116 0.0052<br />
2454555.870790 -2.84 0.58 -2.26 0.58 3.0663 -7.66 0.4704 0.0050<br />
2454556.838936 -4.14 0.59 -3.47 0.51 3.0686 -11.20 0.4261 0.0043<br />
2454557.804592 -4.56 0.66 -4.37 0.60 3.0650 -8.87 0.4306 0.0049<br />
2454562.905075 0.67 0.70 0.80 0.57 3.0668 -7.11 0.4709 0.0051<br />
2454563.898808 -1.37 0.71 -1.39 0.53 3.0656 -11.93 0.4127 0.0046<br />
2454564.895759 -2.63 0.85 -2.82 0.71 3.0680 -8.67 0.5068 0.0061<br />
2454568.891702 3.27 0.87 4.85 1.02 3.0735 -11.20 0.4682 0.0069<br />
2454569.881078 -0.46 0.83 0.46 0.78 3.0720 -16.02 0.4939 0.0061<br />
2454570.870766 -1.70 0.72 -1.21 0.88 3.0715 -10.68 0.4606 0.0063<br />
2454583.933324 0.44 1.00 1.56 1.11 3.0711 -17.51 0.5177 0.0087<br />
2454587.919825 -0.50 0.90 -1.42 1.10 3.0824 -7.86 0.4602 0.0078<br />
2454588.909632 4.05 0.98 3.18 1.05 3.0828 -6.95 0.5501 0.0080<br />
2454590.901964 4.22 0.93 4.19 0.93 3.0758 -9.05 0.4707 0.0073<br />
2454591.900611 1.69 0.91 -1.27 0.96 3.0753 -7.39 0.5139 0.0075<br />
2454592.897751 -2.50 0.68 -2.50 0.63 3.0757 -8.84 0.4741 0.0057<br />
2454593.919961 -2.30 0.74 -2.58 0.65 3.0680 -12.41 0.5039 0.0063<br />
2454610.878230 9.08 0.88 10.36 0.95 3.0671 -9.46 0.4037 0.0069<br />
2454611.856581 5.49 0.56 6.40 0.54 3.0650 -8.37 0.4296 0.0050<br />
2454616.841719 4.81 0.91 5.15 0.88 3.0713 -8.09 0.3999 0.0065<br />
2454617.806576 8.12 0.93 7.30 1.33 3.0753 -14.38 0.4948 0.0086<br />
2454618.664475 10.67 1.76 7.01 2.51 3.0854 -7.21 0.6755 0.0135<br />
2454639.867730 3.14 1.06 4.26 1.10 3.0588 -8.27 0.4083 0.0083<br />
2454640.723804 5.06 0.64 7.07 0.66 3.0705 -13.61 0.4387 0.0055<br />
2454642.676950 -0.81 0.47 1.56 0.61 3.0704 -10.27 0.4720 0.0053<br />
2454643.686130 -2.06 0.72 -4.52 0.76 3.0709 -9.26 0.4809 0.0064<br />
2454644.732044 -1.19 0.46 -1.85 0.56 3.0680 -8.64 0.5097 0.0054<br />
2454646.639658 5.74 1.11 5.01 0.95 3.0737 -10.14 0.4316 0.0066<br />
2454647.630210 5.37 0.68 3.28 0.72 3.0693 -6.35 0.4938 0.0062<br />
2454648.657090 2.58 0.92 0.96 0.94 3.0720 -8.85 0.4597 0.0068<br />
2454658.650838 -4.20 0.97 -3.30 0.88 3.0714 -13.06 0.4193 0.0065<br />
2454660.650214 -0.82 1.13 -0.40 1.06 3.0728 -10.20 0.4224 0.0074<br />
2454661.760056 1.72 0.73 1.76 0.84 3.0737 -11.56 0.4238 0.0065<br />
26
Guillem Anglada-Escudé et al.: Three HZ super-Earths in a seven-planet <strong>system</strong><br />
Table C.2. continued.<br />
BJD RV T ERRA σ TERRA RV ccf σ ccf FWHM BIS S-index σ S<br />
(days) (m s −1 ) (m s −1 ) (m s −1 ) (m s −1 ) (km s −1 ) (m s −1 ) (–) (–)<br />
2454662.664144 3.30 0.72 2.58 0.97 3.0713 -8.43 0.4675 0.0070<br />
2454663.784376 -1.92 0.93 -1.14 0.78 3.0643 -11.52 0.3811 0.0061<br />
2454664.766558 -1.00 1.51 0.0 1.85 3.0765 -9.85 0.4702 0.0106<br />
2454665.774513 -1.88 0.87 -2.51 0.85 3.0695 -9.89 0.4183 0.0065<br />
2454666.683607 -0.37 0.87 0.36 0.79 3.0717 -9.64 0.4098 0.0060<br />
2454674.576462 4.82 1.01 6.41 1.39 3.0901 -6.38 0.4226 0.0083<br />
2454677.663487 7.37 1.78 8.63 3.11 3.1226 -4.66 0.4452 0.0117<br />
2454679.572671 2.94 1.26 -1.23 1.48 3.0822 -5.41 0.5622 0.0103<br />
2454681.573996 2.51 0.89 2.86 1.10 3.0780 -6.26 0.4443 0.0075<br />
2454701.523392 -0.50 0.68 -0.28 0.67 3.0719 -4.48 0.5141 0.0058<br />
2454708.564794 -0.12 0.86 -0.67 0.79 3.0803 -12.80 0.5160 0.0062<br />
2454733.487290 8.06 3.51 10.75 3.89 3.0734 -3.79 0.5017 0.0146<br />
2454735.499425 0.00 1.04 -2.22 1.19 3.0720 -11.44 0.4337 0.0072<br />
2454736.550865 -3.28 0.91 -4.99 1.05 3.0671 -8.70 0.4647 0.0075<br />
2454746.485935 -4.49 0.58 -5.00 0.53 3.0611 -13.01 0.4259 0.0045<br />
2454992.721062 6.84 0.79 7.80 0.65 3.0748 -10.71 0.4826 0.0053<br />
2455053.694541 -3.20 0.84 -3.32 1.09 3.0741 -11.73 0.4427 0.0078<br />
2455276.882590 0.27 0.74 1.86 0.77 3.0732 -11.03 0.4699 0.0061<br />
2455278.827303 1.84 0.92 1.02 0.85 3.0760 -8.41 0.5883 0.0074<br />
2455280.854800 5.26 0.76 4.41 0.87 3.0793 -12.50 0.4817 0.0065<br />
2455283.868014 -0.69 0.68 -0.09 0.61 3.0793 -8.23 0.5411 0.0054<br />
2455287.860052 4.99 0.72 5.42 0.64 3.0779 -11.76 0.5366 0.0056<br />
2455294.882720 8.56 0.69 6.81 0.58 3.0775 -8.71 0.5201 0.0051<br />
2455295.754277 10.15 1.06 8.21 0.98 3.0743 -8.94 0.5805 0.0076<br />
2455297.805750 4.95 0.64 3.95 0.70 3.0779 -10.19 0.4614 0.0057<br />
2455298.813775 2.52 0.75 2.95 0.67 3.0807 -7.72 0.5828 0.0061<br />
2455299.785905 3.74 1.60 4.62 2.19 3.0793 -10.36 0.4187 0.0106<br />
2455300.876852 5.07 0.60 5.78 0.75 3.0792 -9.53 0.5104 0.0060<br />
2455301.896438 9.54 0.99 8.40 1.32 3.0774 -12.07 0.4395 0.0085<br />
2455323.705436 8.56 0.86 8.82 0.78 3.0702 -7.78 0.4349 0.0067<br />
2455326.717047 2.17 1.05 0.67 1.27 3.0649 -9.48 0.5955 0.0103<br />
2455328.702599 1.56 1.02 1.83 1.01 3.0658 -8.48 0.5077 0.0089<br />
2455335.651717 1.01 0.92 3.02 1.22 3.0593 -10.79 0.4685 0.0092<br />
2455337.704618 7.58 1.03 6.13 1.24 3.0725 -11.55 0.4859 0.0090<br />
2455338.649293 13.01 1.97 12.32 2.54 3.0687 -5.74 0.4969 0.0134<br />
2455339.713716 6.70 1.03 5.13 1.57 3.0700 -11.07 0.4760 0.0097<br />
2455341.789626 -0.40 0.63 0.01 0.71 3.0812 -11.27 0.4916 0.0061<br />
2455342.720036 4.80 0.91 5.68 1.13 3.0718 -7.25 0.4674 0.0076<br />
2455349.682257 6.55 0.78 4.00 0.97 3.0685 -4.609 0.4787 0.0073<br />
2455352.601155 12.92 1.11 14.24 1.35 3.0700 -7.48 0.4530 0.0093<br />
2455354.642822 7.52 0.60 8.38 0.65 3.0663 -10.63 0.4347 0.0057<br />
2455355.576777 6.41 0.97 4.76 0.96 3.0681 -9.41 0.4278 0.0074<br />
2455358.754723 8.54 1.17 10.00 1.30 3.0619 -11.04 0.3527 0.0095<br />
2455359.599377 6.89 0.90 6.90 0.97 3.0724 -11.39 0.3649 0.0070<br />
2455993.879754 12.28 1.04 – – – – 0.5179 0.0086<br />
2455994.848576 15.43 1.30 – – – – 0.6712 0.0120<br />
27