Bemis Company 2007 Annual Report - IR Solutions
Bemis Company 2007 Annual Report - IR Solutions
Bemis Company 2007 Annual Report - IR Solutions

Create successful ePaper yourself
Turn your PDF publications into a flip-book with our unique Google optimized e-Paper software.
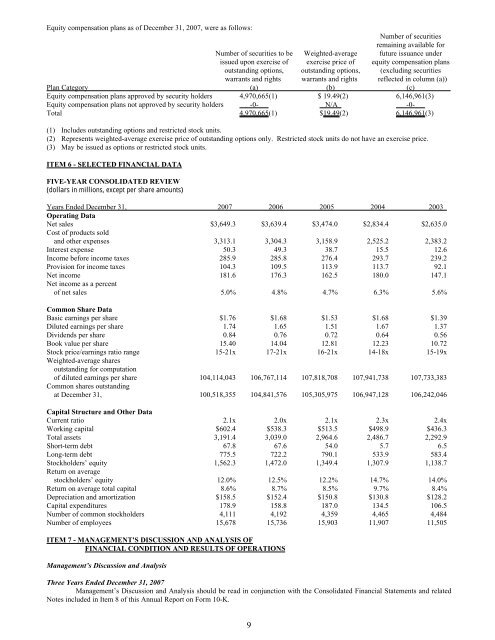
Equity compensation plans as of December 31, <strong>2007</strong>, were as follows:<br />
Number of securities<br />
remaining available for<br />
Number of securities to be Weighted-average future issuance under<br />
issued upon exercise of exercise price of equity compensation plans<br />
outstanding options, outstanding options, (excluding securities<br />
warrants and rights warrants and rights reflected in column (a))<br />
Plan Category (a) (b) (c)<br />
Equity compensation plans approved by security holders 4,970,665(1) $ 19.49(2) 6,146,961(3)<br />
Equity compensation plans not approved by security holders -0- N/A -0-<br />
Total 4,970,665(1) $19.49(2) 6,146,961(3)<br />
(1) Includes outstanding options and restricted stock units.<br />
(2) Represents weighted-average exercise price of outstanding options only. Restricted stock units do not have an exercise price.<br />
(3) May be issued as options or restricted stock units.<br />
ITEM 6 - SELECTED FINANCIAL DATA<br />
FIVE-YEAR CONSOLIDATED REVIEW<br />
(dollars in millions, except per share amounts)<br />
Years Ended December 31, <strong>2007</strong> 2006 2005 2004 2003<br />
Operating Data<br />
Net sales $3,649.3 $3,639.4 $3,474.0 $2,834.4 $2,635.0<br />
Cost of products sold<br />
and other expenses 3,313.1 3,304.3 3,158.9 2,525.2 2,383.2<br />
Interest expense 50.3 49.3 38.7 15.5 12.6<br />
Income before income taxes 285.9 285.8 276.4 293.7 239.2<br />
Provision for income taxes 104.3 109.5 113.9 113.7 92.1<br />
Net income 181.6 176.3 162.5 180.0 147.1<br />
Net income as a percent<br />
of net sales 5.0% 4.8% 4.7% 6.3% 5.6%<br />
Common Share Data<br />
Basic earnings per share $1.76 $1.68 $1.53 $1.68 $1.39<br />
Diluted earnings per share 1.74 1.65 1.51 1.67 1.37<br />
Dividends per share 0.84 0.76 0.72 0.64 0.56<br />
Book value per share 15.40 14.04 12.81 12.23 10.72<br />
Stock price/earnings ratio range 15-21x 17-21x 16-21x 14-18x 15-19x<br />
Weighted-average shares<br />
outstanding for computation<br />
of diluted earnings per share 104,114,043 106,767,114 107,818,708 107,941,738 107,733,383<br />
Common shares outstanding<br />
at December 31, 100,518,355 104,841,576 105,305,975 106,947,128 106,242,046<br />
Capital Structure and Other Data<br />
Current ratio 2.1x 2.0x 2.1x 2.3x 2.4x<br />
Working capital $602.4 $538.3 $513.5 $498.9 $436.3<br />
Total assets 3,191.4 3,039.0 2,964.6 2,486.7 2,292.9<br />
Short-term debt 67.8 67.6 54.0 5.7 6.5<br />
Long-term debt 775.5 722.2 790.1 533.9 583.4<br />
Stockholders’ equity 1,562.3 1,472.0 1,349.4 1,307.9 1,138.7<br />
Return on average<br />
stockholders’ equity 12.0% 12.5% 12.2% 14.7% 14.0%<br />
Return on average total capital 8.6% 8.7% 8.5% 9.7% 8.4%<br />
Depreciation and amortization $158.5 $152.4 $150.8 $130.8 $128.2<br />
Capital expenditures 178.9 158.8 187.0 134.5 106.5<br />
Number of common stockholders 4,111 4,192 4,359 4,465 4,484<br />
Number of employees 15,678 15,736 15,903 11,907 11,505<br />
ITEM 7 - MANAGEMENT'S DISCUSSION AND ANALYSIS OF<br />
FINANCIAL CONDITION AND RESULTS OF OPERATIONS<br />
Management’s Discussion and Analysis<br />
Three Years Ended December 31, <strong>2007</strong><br />
Management’s Discussion and Analysis should be read in conjunction with the Consolidated Financial Statements and related<br />
Notes included in Item 8 of this <strong>Annual</strong> <strong>Report</strong> on Form 10-K.<br />
9