Bemis Company 2007 Annual Report - IR Solutions
Bemis Company 2007 Annual Report - IR Solutions
Bemis Company 2007 Annual Report - IR Solutions
You also want an ePaper? Increase the reach of your titles
YUMPU automatically turns print PDFs into web optimized ePapers that Google loves.
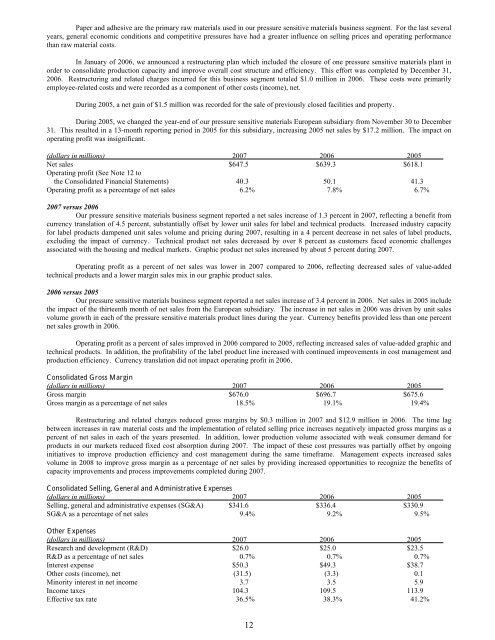
Paper and adhesive are the primary raw materials used in our pressure sensitive materials business segment. For the last several<br />
years, general economic conditions and competitive pressures have had a greater influence on selling prices and operating performance<br />
than raw material costs.<br />
In January of 2006, we announced a restructuring plan which included the closure of one pressure sensitive materials plant in<br />
order to consolidate production capacity and improve overall cost structure and efficiency. This effort was completed by December 31,<br />
2006. Restructuring and related charges incurred for this business segment totaled $1.0 million in 2006. These costs were primarily<br />
employee-related costs and were recorded as a component of other costs (income), net.<br />
During 2005, a net gain of $1.5 million was recorded for the sale of previously closed facilities and property.<br />
During 2005, we changed the year-end of our pressure sensitive materials European subsidiary from November 30 to December<br />
31. This resulted in a 13-month reporting period in 2005 for this subsidiary, increasing 2005 net sales by $17.2 million. The impact on<br />
operating profit was insignificant.<br />
(dollars in millions) <strong>2007</strong> 2006 2005<br />
Net sales $647.5 $639.3 $618.1<br />
Operating profit (See Note 12 to<br />
the Consolidated Financial Statements) 40.3 50.1 41.3<br />
Operating profit as a percentage of net sales 6.2% 7.8% 6.7%<br />
<strong>2007</strong> versus 2006<br />
Our pressure sensitive materials business segment reported a net sales increase of 1.3 percent in <strong>2007</strong>, reflecting a benefit from<br />
currency translation of 4.5 percent, substantially offset by lower unit sales for label and technical products. Increased industry capacity<br />
for label products dampened unit sales volume and pricing during <strong>2007</strong>, resulting in a 4 percent decrease in net sales of label products,<br />
excluding the impact of currency. Technical product net sales decreased by over 8 percent as customers faced economic challenges<br />
associated with the housing and medical markets. Graphic product net sales increased by about 5 percent during <strong>2007</strong>.<br />
Operating profit as a percent of net sales was lower in <strong>2007</strong> compared to 2006, reflecting decreased sales of value-added<br />
technical products and a lower margin sales mix in our graphic product sales.<br />
2006 versus 2005<br />
Our pressure sensitive materials business segment reported a net sales increase of 3.4 percent in 2006. Net sales in 2005 include<br />
the impact of the thirteenth month of net sales from the European subsidiary. The increase in net sales in 2006 was driven by unit sales<br />
volume growth in each of the pressure sensitive materials product lines during the year. Currency benefits provided less than one percent<br />
net sales growth in 2006.<br />
Operating profit as a percent of sales improved in 2006 compared to 2005, reflecting increased sales of value-added graphic and<br />
technical products. In addition, the profitability of the label product line increased with continued improvements in cost management and<br />
production efficiency. Currency translation did not impact operating profit in 2006.<br />
Consolidated Gross Margin<br />
(dollars in millions) <strong>2007</strong> 2006 2005<br />
Gross margin $676.0 $696.7 $675.6<br />
Gross margin as a percentage of net sales 18.5% 19.1% 19.4%<br />
Restructuring and related charges reduced gross margins by $0.3 million in <strong>2007</strong> and $12.9 million in 2006. The time lag<br />
between increases in raw material costs and the implementation of related selling price increases negatively impacted gross margins as a<br />
percent of net sales in each of the years presented. In addition, lower production volume associated with weak consumer demand for<br />
products in our markets reduced fixed cost absorption during <strong>2007</strong>. The impact of these cost pressures was partially offset by ongoing<br />
initiatives to improve production efficiency and cost management during the same timeframe. Management expects increased sales<br />
volume in 2008 to improve gross margin as a percentage of net sales by providing increased opportunities to recognize the benefits of<br />
capacity improvements and process improvements completed during <strong>2007</strong>.<br />
Consolidated Selling, General and Administrative Expenses<br />
(dollars in millions) <strong>2007</strong> 2006 2005<br />
Selling, general and administrative expenses (SG&A) $341.6 $336.4 $330.9<br />
SG&A as a percentage of net sales 9.4% 9.2% 9.5%<br />
Other Expenses<br />
(dollars in millions) <strong>2007</strong> 2006 2005<br />
Research and development (R&D) $26.0 $25.0 $23.5<br />
R&D as a percentage of net sales 0.7% 0.7% 0.7%<br />
Interest expense $50.3 $49.3 $38.7<br />
Other costs (income), net (31.5) (3.3) 0.1<br />
Minority interest in net income 3.7 3.5 5.9<br />
Income taxes 104.3 109.5 113.9<br />
Effective tax rate 36.5% 38.3% 41.2%<br />
12


