Balanced Fertility Management: A Key to Nutrient Use Efficiency (Ohio)
Balanced Fertility Management: A Key to Nutrient Use Efficiency (Ohio)
Balanced Fertility Management: A Key to Nutrient Use Efficiency (Ohio)

Create successful ePaper yourself
Turn your PDF publications into a flip-book with our unique Google optimized e-Paper software.
O H I O<br />
<strong>Balanced</strong> <strong>Fertility</strong> <strong>Management</strong>:<br />
A <strong>Key</strong> <strong>to</strong> <strong>Nutrient</strong> <strong>Use</strong> <strong>Efficiency</strong><br />
By J.W. Johnson, T.S. Murrell and H.F. Reetz, Jr.<br />
Abalanced fertility program is<br />
essential for optimizing yields,<br />
increasing profits, and improving<br />
the efficiency of fertilizer applications.<br />
For non-legumes, nitrogen (N) may be the<br />
most common limiting nutrient. However,<br />
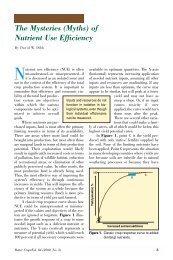
Corn grain yield, bu/A<br />
210<br />
180<br />
150<br />
120<br />
90<br />
320<br />
240<br />
160<br />
80<br />
Fertilizer N rate, lb/A<br />
<strong>Balanced</strong> fertilization<br />
practices produce higher<br />
yields, greater profitability,<br />
and improved environmental<br />
protection: goals which<br />
every <strong>to</strong>p producer should<br />
strive <strong>to</strong> achieve.<br />
0<br />
160<br />
200<br />
232<br />
without balanced nutrition,<br />
fertilizer N applications<br />
may be less efficient,<br />
and part of the fertilizer<br />
investment is wasted. To<br />
address these issues, a<br />
four-year study was conducted<br />
on a Crosby silt<br />
loam soil near Springfield,<br />
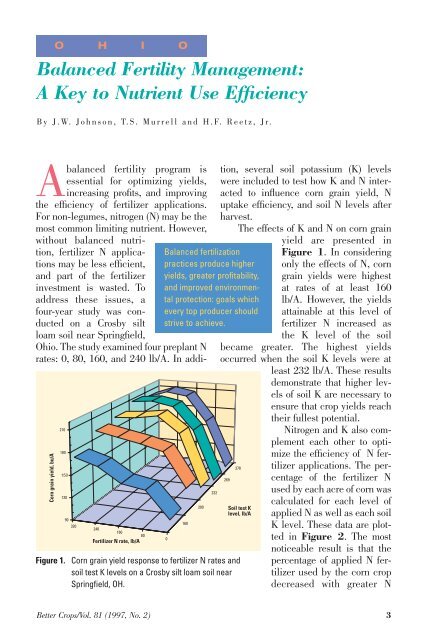
<strong>Ohio</strong>. The study examined four preplant N<br />
rates: 0, 80, 160, and 240 lb/A. In addition,<br />
several soil potassium (K) levels<br />
were included <strong>to</strong> test how K and N interacted<br />
<strong>to</strong> influence corn grain yield, N<br />
uptake efficiency, and soil N levels after<br />
harvest.<br />
The effects of K and N on corn grain<br />
269<br />
278<br />
Soil test K<br />
level, lb/A<br />
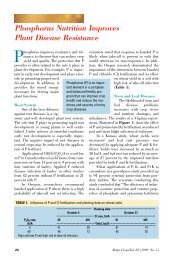
Figure 1. Corn grain yield response <strong>to</strong> fertilizer N rates and<br />
soil test K levels on a Crosby silt loam soil near<br />
Springfield, OH.<br />
yield are presented in<br />
Figure 1. In considering<br />
only the effects of N, corn<br />
grain yields were highest<br />
at rates of at least 160<br />
lb/A. However, the yields<br />
attainable at this level of<br />
fertilizer N increased as<br />
the K level of the soil<br />
became greater. The highest yields<br />
occurred when the soil K levels were at<br />
least 232 lb/A. These results<br />
demonstrate that higher levels<br />
of soil K are necessary <strong>to</strong><br />
ensure that crop yields reach<br />
their fullest potential.<br />
Nitrogen and K also complement<br />
each other <strong>to</strong> optimize<br />
the efficiency of N fertilizer<br />
applications. The percentage<br />
of the fertilizer N<br />
used by each acre of corn was<br />
calculated for each level of<br />
applied N as well as each soil<br />
K level. These data are plotted<br />
in Figure 2. The most<br />
noticeable result is that the<br />
percentage of applied N fertilizer<br />
used by the corn crop<br />
decreased with greater N<br />
Better Crops/Vol. 81 (1997, No. 2) 3
Percent of applied N in plant<br />
rates. This occurred because the amount<br />
of N taken up by the crop initially<br />
increased as increasing amounts of fertilizer<br />
were applied; however, as N rates<br />
continued <strong>to</strong> increase, crop uptake began<br />
<strong>to</strong> reach a plateau. When N uptake<br />
reached this maximum, lower percentages<br />
of fertilizer N were utilized.<br />
The effects of K are also evident.<br />
Percent of applied N remaining<br />
in soil in Oc<strong>to</strong>ber, 0 <strong>to</strong> 3 ft. depth<br />
110<br />
100<br />
90<br />
80<br />
70<br />
50<br />
45<br />
60<br />
50<br />
40<br />
40<br />
35<br />
30<br />
30<br />
20<br />
10<br />
80<br />
25<br />
20<br />
15<br />
10<br />
5<br />
0<br />
320<br />
160<br />
240<br />
Fertilizer N rate, lb/A<br />
240<br />
160<br />
Fertilizer N rate, lb/A<br />
80<br />
278<br />
269<br />
232<br />
Higher levels of soil K resulted<br />
in greater use of applied N<br />
fertilizer by the corn crop.<br />
Other data from this experiment<br />
(not presented here)<br />
showed that K did not<br />
increase fodder N uptake significantly,<br />
but it did produce<br />
significant increases in N<br />
uptake by the grain. The<br />
removal of N by the grain was<br />
therefore most likely responsible<br />
for the observed<br />
increases in whole plant<br />
uptake of N with increased K<br />
levels in the soil.<br />
So far, increased soil K<br />
levels have been shown <strong>to</strong><br />
improve the efficiency of fertilizer<br />
N utilization and <strong>to</strong> increase the<br />
yields attainable at higher N rates. Both of<br />
these effects may work <strong>to</strong>gether <strong>to</strong> reduce<br />
the quantity of N fertilizer remaining in<br />
the soil after harvest. Figure 3 shows the<br />
percentage of applied N fertilizer remaining<br />
in the <strong>to</strong>p 3 ft. of soil after grain harvest<br />
for five different soil test K levels.<br />
Higher soil K levels resulted in a smaller<br />
percentage of the applied N<br />
fertilizer remaining in the<br />
soil. These lower levels may<br />
have resulted from the<br />
greater fertilizer N removal<br />
by corn growing on the areas<br />
with higher K levels.<br />
200<br />
160<br />
Soil test K<br />
level, lb/A<br />
Figure 3. The effects of N rates and soil test K levels on the<br />
percent of applied fertilizer N remaining in the upper<br />
3 ft. of a Crosby silt loam soil in Oc<strong>to</strong>ber after corn<br />
grain harvest.<br />
320<br />
160<br />
200<br />
232<br />
269<br />
278<br />
Soil test K<br />
level, lb/A<br />
Figure 2. The effect of fertilizer N rates and soil test K levels on<br />
the N uptake efficiency of a corn crop grown on a<br />
Crosby silt loam soil near Springfield, OH.<br />
The data from this study<br />
also show that N and K work<br />
<strong>to</strong>gether <strong>to</strong> maximize profitability.<br />
The change in yield<br />
response <strong>to</strong> increasing fertilizer<br />
N applications was calculated<br />
for each soil K level.<br />
Income generated or lost<br />
from each fertilizer increment<br />
was based upon a price<br />
of $2.90/bu for corn and<br />
$0.25/lb of N for fertilizer.<br />
4 Better Crops/Vol. 81 (1997, No. 2)
13<br />
12<br />
11<br />
10<br />
9<br />
8<br />
Marginal return in grain yield<br />
per fertilizer dollar invested, $<br />
7<br />
6<br />
5<br />
4<br />
3<br />
2<br />
1<br />
0<br />
-1<br />
278<br />
-2<br />
269<br />
0<br />
20<br />
40<br />
60<br />
80<br />
100<br />
120<br />
140<br />
160<br />
180<br />
Fertilizer N rate, lb/A<br />
200<br />
220<br />
240<br />
260<br />
280<br />
300<br />
320<br />
160<br />
200<br />
232<br />
Soil test K<br />
level, lb/A<br />
Figure 4. Marginal returns <strong>to</strong> N fertilizer investment for incremental changes in N rate at different<br />
soil test K levels (corn grain price set at $2.90/bu and fertilizer N fixed at 25¢/lb).<br />
The income from yield was compared <strong>to</strong><br />
the investment in fertilizer N.<br />
The results of this analysis are plotted<br />
in Figure 4. The most evident feature<br />
of this graph is the well-known relationship<br />
that marginal return is highest at the<br />
initial increments of fertilizer N, but<br />
begins <strong>to</strong> reach a plateau at higher fertilizer<br />
N levels. The data clearly show that<br />
higher levels of soil K greatly increase the<br />
marginal returns from applications. This<br />
response is directly related <strong>to</strong> the heightened<br />
yield response at the higher soil K<br />
levels. Eventually, N additions either produce<br />
no additional profit or begin <strong>to</strong><br />
reduce profit. Higher soil test K levels<br />
allow corn <strong>to</strong> achieve its maximum profitability<br />
at lower N rates.<br />
The results from this study have several<br />
implications for N and K management.<br />
When N and K work <strong>to</strong>gether,<br />
yields and N uptake are superior <strong>to</strong> those<br />
arising from N alone. Higher K levels also<br />
reduce the amount of fertilizer N needed<br />
<strong>to</strong> maximize profitability. The increased<br />
yields and N levels in the crop lead <strong>to</strong> a<br />
more efficient use of applied N fertilizer.<br />
When more of the N fertilizer is used by<br />
the crop, less is left over in the soil after<br />
harvest. Reduced soil N levels mean<br />
reduced chances for groundwater contamination<br />
through runoff or leaching.<br />
Dr. Johnson is Professor of Soil <strong>Fertility</strong>, School of<br />
Natural Resources, The <strong>Ohio</strong> State University,<br />
Columbus, OH. Dr. Murrell is Northcentral Direc<strong>to</strong>r,<br />
PPI, Andover, MN. Dr. Reetz is Midwest Direc<strong>to</strong>r,<br />
PPI, Monticello, IL.<br />
Better Crops/Vol. 81 (1997, No. 2) 5