2. Average rate of change
2. Average rate of change
2. Average rate of change

Create successful ePaper yourself
Turn your PDF publications into a flip-book with our unique Google optimized e-Paper software.
2m<br />
1.2s<br />
at 2m<br />
0.4s<br />
2m<br />
≈ 1.67m/s. The fourth two meters are completed at<br />
0.8s<br />
= <strong>2.</strong>50m/s. The last two meters are completed<br />
= 5m/s, or about 11 miles per hour.<br />
Notice that this example is essentially identical to the previous example. All I’ve done is<br />
multiplied the x values by 0.4 and the y values by 2 to get more realistic figures for this situation.<br />
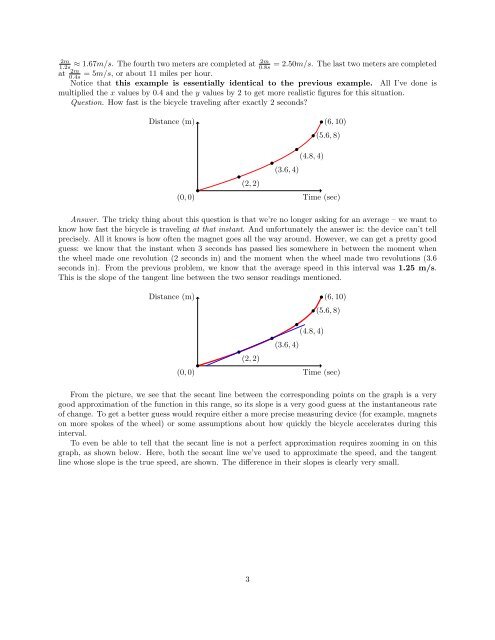
Question. How fast is the bicycle traveling after exactly 2 seconds?<br />
Distance (m)<br />
(0, 0)<br />
(2, 2)<br />
(6, 10)<br />
(5.6, 8)<br />
(4.8, 4)<br />
(3.6, 4)<br />
Time (sec)<br />
Answer. The tricky thing about this question is that we’re no longer asking for an average – we want to<br />
know how fast the bicycle is traveling at that instant. And unfortunately the answer is: the device can’t tell<br />
precisely. All it knows is how <strong>of</strong>ten the magnet goes all the way around. However, we can get a pretty good<br />
guess: we know that the instant when 3 seconds has passed lies somewhere in between the moment when<br />
the wheel made one revolution (2 seconds in) and the moment when the wheel made two revolutions (3.6<br />
seconds in). From the previous problem, we know that the average speed in this interval was 1.25 m/s.<br />
This is the slope <strong>of</strong> the tangent line between the two sensor readings mentioned.<br />
Distance (m)<br />
(0, 0)<br />
(2, 2)<br />
(6, 10)<br />
(5.6, 8)<br />
(4.8, 4)<br />
(3.6, 4)<br />
Time (sec)<br />
From the picture, we see that the secant line between the corresponding points on the graph is a very<br />
good approximation <strong>of</strong> the function in this range, so its slope is a very good guess at the instantaneous <strong>rate</strong><br />
<strong>of</strong> <strong>change</strong>. To get a better guess would require either a more precise measuring device (for example, magnets<br />
on more spokes <strong>of</strong> the wheel) or some assumptions about how quickly the bicycle accele<strong>rate</strong>s during this<br />
interval.<br />
To even be able to tell that the secant line is not a perfect approximation requires zooming in on this<br />
graph, as shown below. Here, both the secant line we’ve used to approximate the speed, and the tangent<br />
line whose slope is the true speed, are shown. The difference in their slopes is clearly very small.<br />
3