2. Average rate of change
2. Average rate of change
2. Average rate of change

You also want an ePaper? Increase the reach of your titles
YUMPU automatically turns print PDFs into web optimized ePapers that Google loves.
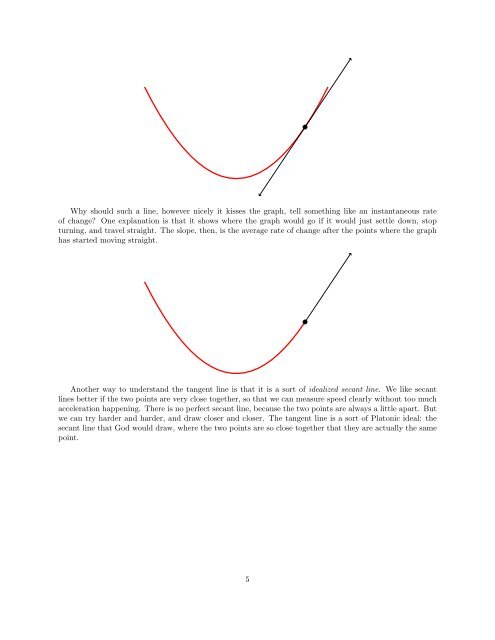
Why should such a line, however nicely it kisses the graph, tell something like an instantaneous <strong>rate</strong><br />
<strong>of</strong> <strong>change</strong>? One explanation is that it shows where the graph would go if it would just settle down, stop<br />
turning, and travel straight. The slope, then, is the average <strong>rate</strong> <strong>of</strong> <strong>change</strong> after the points where the graph<br />
has started moving straight.<br />
Another way to understand the tangent line is that it is a sort <strong>of</strong> idealized secant line. We like secant<br />
lines better if the two points are very close together, so that we can measure speed clearly without too much<br />
acceleration happening. There is no perfect secant line, because the two points are always a little apart. But<br />
we can try harder and harder, and draw closer and closer. The tangent line is a sort <strong>of</strong> Platonic ideal: the<br />
secant line that God would draw, where the two points are so close together that they are actually the same<br />
point.<br />
5