Measuring Market Risk - Reserve Bank of India
Measuring Market Risk - Reserve Bank of India
Measuring Market Risk - Reserve Bank of India

You also want an ePaper? Increase the reach of your titles
YUMPU automatically turns print PDFs into web optimized ePapers that Google loves.
MEASURING MARKET RISK 21<br />
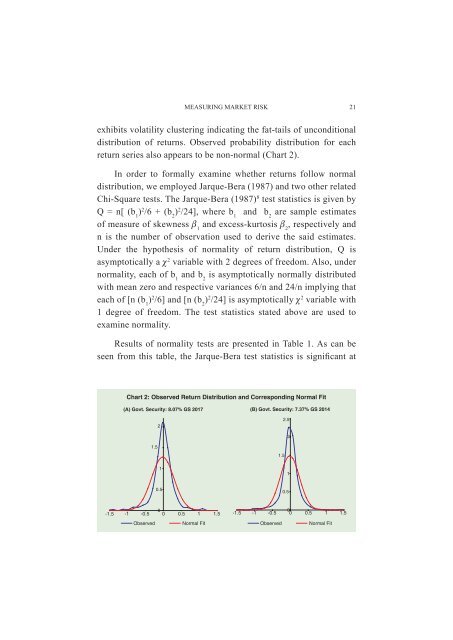
exhibits volatility clustering indicating the fat-tails <strong>of</strong> unconditional<br />
distribution <strong>of</strong> returns. Observed probability distribution for each<br />
return series also appears to be non-normal (Chart 2).<br />
In order to formally examine whether returns follow normal<br />
distribution, we employed Jarque-Bera (1987) and two other related<br />
Chi-Square tests. The Jarque-Bera (1987) 8 test statistics is given by<br />
Q = n[ (b 1<br />
) 2 /6 + (b 2<br />
) 2 /24], where b 1<br />
and b 2<br />
are sample estimates<br />
<strong>of</strong> measure <strong>of</strong> skewness β 1<br />
and excess-kurtosis β 2<br />
, respectively and<br />
n is the number <strong>of</strong> observation used to derive the said estimates.<br />
Under the hypothesis <strong>of</strong> normality <strong>of</strong> return distribution, Q is<br />
asymptotically a χ 2 variable with 2 degrees <strong>of</strong> freedom. Also, under<br />
normality, each <strong>of</strong> b 1<br />
and b 2<br />
is asymptotically normally distributed<br />
with mean zero and respective variances 6/n and 24/n implying that<br />
each <strong>of</strong> [n (b 1<br />
) 2 /6] and [n (b 2<br />
) 2 /24] is asymptotically χ 2 variable with<br />
1 degree <strong>of</strong> freedom. The test statistics stated above are used to<br />
examine normality.<br />
Results <strong>of</strong> normality tests are presented in Table 1. As can be<br />
seen from this table, the Jarque-Bera test statistics is significant at