Measuring Market Risk - Reserve Bank of India
Measuring Market Risk - Reserve Bank of India
Measuring Market Risk - Reserve Bank of India

You also want an ePaper? Increase the reach of your titles
YUMPU automatically turns print PDFs into web optimized ePapers that Google loves.
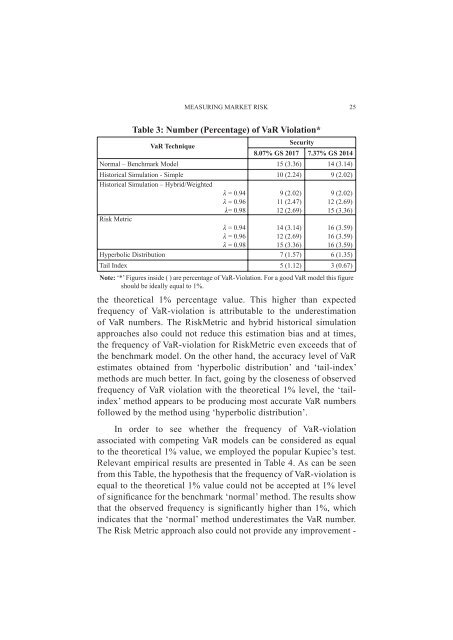
MEASURING MARKET RISK 25<br />
Table 3: Number (Percentage) <strong>of</strong> VaR Violation*<br />
VaR Technique<br />
Security<br />
8.07% GS 2017 7.37% GS 2014<br />
Normal – Benchmark Model 15 (3.36) 14 (3.14)<br />
Historical Simulation - Simple 10 (2.24) 9 (2.02)<br />
Historical Simulation – Hybrid/Weighted<br />
λ = 0.94 9 (2.02) 9 (2.02)<br />
λ = 0.96 11 (2.47) 12 (2.69)<br />
λ= 0.98 12 (2.69) 15 (3.36)<br />
<strong>Risk</strong> Metric<br />
λ = 0.94 14 (3.14) 16 (3.59)<br />
λ = 0.96 12 (2.69) 16 (3.59)<br />
λ = 0.98 15 (3.36) 16 (3.59)<br />
Hyperbolic Distribution 7 (1.57) 6 (1.35)<br />
Tail Index 5 (1.12) 3 (0.67)<br />
Note: ‘*’ Figures inside ( ) are percentage <strong>of</strong> VaR-Violation. For a good VaR model this figure<br />
should be ideally equal to 1%.<br />
the theoretical 1% percentage value. This higher than expected<br />
frequency <strong>of</strong> VaR-violation is attributable to the underestimation<br />
<strong>of</strong> VaR numbers. The <strong>Risk</strong>Metric and hybrid historical simulation<br />
approaches also could not reduce this estimation bias and at times,<br />
the frequency <strong>of</strong> VaR-violation for <strong>Risk</strong>Metric even exceeds that <strong>of</strong><br />
the benchmark model. On the other hand, the accuracy level <strong>of</strong> VaR<br />
estimates obtained from ‘hyperbolic distribution’ and ‘tail-index’<br />
methods are much better. In fact, going by the closeness <strong>of</strong> observed<br />
frequency <strong>of</strong> VaR violation with the theoretical 1% level, the ‘tailindex’<br />
method appears to be producing most accurate VaR numbers<br />
followed by the method using ‘hyperbolic distribution’.<br />
In order to see whether the frequency <strong>of</strong> VaR-violation<br />
associated with competing VaR models can be considered as equal<br />
to the theoretical 1% value, we employed the popular Kupiec’s test.<br />
Relevant empirical results are presented in Table 4. As can be seen<br />
from this Table, the hypothesis that the frequency <strong>of</strong> VaR-violation is<br />
equal to the theoretical 1% value could not be accepted at 1% level<br />
<strong>of</strong> significance for the benchmark ‘normal’ method. The results show<br />
that the observed frequency is significantly higher than 1%, which<br />
indicates that the ‘normal’ method underestimates the VaR number.<br />
The <strong>Risk</strong> Metric approach also could not provide any improvement -