Hierarchy of factors driving N2O emissions in nontilled soils ... - INTA
Hierarchy of factors driving N2O emissions in nontilled soils ... - INTA
Hierarchy of factors driving N2O emissions in nontilled soils ... - INTA

You also want an ePaper? Increase the reach of your titles
YUMPU automatically turns print PDFs into web optimized ePapers that Google loves.
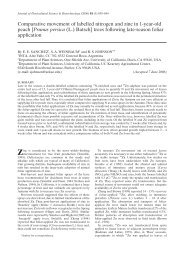
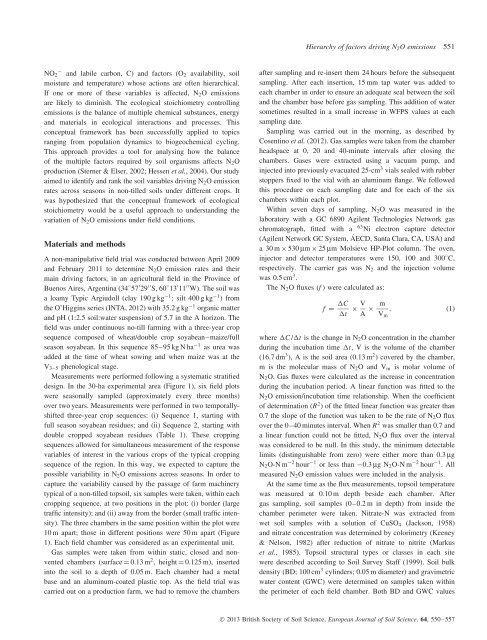
<strong>Hierarchy</strong> <strong>of</strong> <strong>factors</strong> <strong>driv<strong>in</strong>g</strong> N 2 O <strong>emissions</strong> 551<br />
NO 2 − and labile carbon, C) and <strong>factors</strong> (O 2 availability, soil<br />
moisture and temperature) whose actions are <strong>of</strong>ten hierarchical.<br />
If one or more <strong>of</strong> these variables is affected, N 2 O <strong>emissions</strong><br />
are likely to dim<strong>in</strong>ish. The ecological stoichiometry controll<strong>in</strong>g<br />
<strong>emissions</strong> is the balance <strong>of</strong> multiple chemical substances, energy<br />
and materials <strong>in</strong> ecological <strong>in</strong>teractions and processes. This<br />
conceptual framework has been successfully applied to topics<br />
rang<strong>in</strong>g from population dynamics to biogeochemical cycl<strong>in</strong>g.<br />
This approach provides a tool for analys<strong>in</strong>g how the balance<br />
<strong>of</strong> the multiple <strong>factors</strong> required by soil organisms affects N 2 O<br />
production (Sterner & Elser, 2002; Hessen et al., 2004). Our study<br />
aimed to identify and rank the soil variables <strong>driv<strong>in</strong>g</strong> N 2 O emission<br />
rates across seasons <strong>in</strong> non-tilled <strong>soils</strong> under different crops. It<br />
was hypothesized that the conceptual framework <strong>of</strong> ecological<br />
stoichiometry would be a useful approach to understand<strong>in</strong>g the<br />
variation <strong>of</strong> N 2 O <strong>emissions</strong> under field conditions.<br />
Materials and methods<br />
A non-manipulative field trial was conducted between April 2009<br />
and February 2011 to determ<strong>in</strong>e N 2 O emission rates and their<br />
ma<strong>in</strong> <strong>driv<strong>in</strong>g</strong> <strong>factors</strong>, <strong>in</strong> an agricultural field <strong>in</strong> the Prov<strong>in</strong>ce <strong>of</strong><br />
Buenos Aires, Argent<strong>in</strong>a (34 ◦ 57 ′ 29 ′′ S, 60 ◦ 13 ′ 11 ′′ W). The soil was<br />
a loamy Typic Argiudoll (clay 190 g kg −1 ; silt 400 g kg −1 ) from<br />
the O’Higg<strong>in</strong>s series (<strong>INTA</strong>, 2012) with 35.2 g kg −1 organic matter<br />
and pH (1:2.5 soil:water suspension) <strong>of</strong> 5.7 <strong>in</strong> the A horizon. The<br />
field was under cont<strong>in</strong>uous no-till farm<strong>in</strong>g with a three-year crop<br />
sequence composed <strong>of</strong> wheat/double crop soyabean–maize/full<br />
season soyabean. In this sequence 85–95 kg N ha −1 as urea was<br />
added at the time <strong>of</strong> wheat sow<strong>in</strong>g and when maize was at the<br />
V 3–5 phenological stage.<br />
Measurements were performed follow<strong>in</strong>g a systematic stratified<br />
design. In the 30-ha experimental area (Figure 1), six field plots<br />
were seasonally sampled (approximately every three months)<br />
over two years. Measurements were performed <strong>in</strong> two temporallyshifted<br />
three-year crop sequences: (i) Sequence 1, start<strong>in</strong>g with<br />
full season soyabean residues; and (ii) Sequence 2, start<strong>in</strong>g with<br />
double cropped soyabean residues (Table 1). These cropp<strong>in</strong>g<br />
sequences allowed for simultaneous measurement <strong>of</strong> the response<br />
variables <strong>of</strong> <strong>in</strong>terest <strong>in</strong> the various crops <strong>of</strong> the typical cropp<strong>in</strong>g<br />
sequence <strong>of</strong> the region. In this way, we expected to capture the<br />
possible variability <strong>in</strong> N 2 O <strong>emissions</strong> across seasons. In order to<br />
capture the variability caused by the passage <strong>of</strong> farm mach<strong>in</strong>ery<br />
typical <strong>of</strong> a non-tilled topsoil, six samples were taken, with<strong>in</strong> each<br />
cropp<strong>in</strong>g sequence, at two positions <strong>in</strong> the plot: (i) border (large<br />
traffic <strong>in</strong>tensity); and (ii) away from the border (small traffic <strong>in</strong>tensity).<br />
The three chambers <strong>in</strong> the same position with<strong>in</strong> the plot were<br />
10 m apart; those <strong>in</strong> different positions were 50 m apart (Figure<br />
1). Each field chamber was considered as an experimental unit.<br />
Gas samples were taken from with<strong>in</strong> static, closed and nonvented<br />
chambers (surface = 0.13 m 2 , height = 0.125 m), <strong>in</strong>serted<br />
<strong>in</strong>to the soil to a depth <strong>of</strong> 0.05 m. Each chamber had a metal<br />
base and an alum<strong>in</strong>um-coated plastic top. As the field trial was<br />
carried out on a production farm, we had to remove the chambers<br />
after sampl<strong>in</strong>g and re-<strong>in</strong>sert them 24 hours before the subsequent<br />
sampl<strong>in</strong>g. After each <strong>in</strong>sertion, 15 mm tap water was added to<br />
each chamber <strong>in</strong> order to ensure an adequate seal between the soil<br />
and the chamber base before gas sampl<strong>in</strong>g. This addition <strong>of</strong> water<br />
sometimes resulted <strong>in</strong> a small <strong>in</strong>crease <strong>in</strong> WFPS values at each<br />
sampl<strong>in</strong>g date.<br />
Sampl<strong>in</strong>g was carried out <strong>in</strong> the morn<strong>in</strong>g, as described by<br />
Cosent<strong>in</strong>o et al. (2012). Gas samples were taken from the chamber<br />
headspace at 0, 20 and 40-m<strong>in</strong>ute <strong>in</strong>tervals after clos<strong>in</strong>g the<br />
chambers. Gases were extracted us<strong>in</strong>g a vacuum pump, and<br />
<strong>in</strong>jected <strong>in</strong>to previously evacuated 25-cm 3 vials sealed with rubber<br />
stoppers fixed to the vial with an alum<strong>in</strong>um flange. We followed<br />
this procedure on each sampl<strong>in</strong>g date and for each <strong>of</strong> the six<br />
chambers with<strong>in</strong> each plot.<br />
With<strong>in</strong> seven days <strong>of</strong> sampl<strong>in</strong>g, N 2 O was measured <strong>in</strong> the<br />
laboratory with a GC 6890 Agilent Technologies Network gas<br />
chromatograph, fitted with a 63 Ni electron capture detector<br />
(Agilent Network GC System, ÁECD, Santa Clara, CA, USA) and<br />
a30m× 530 μm × 25 μm Molsieve HP-Plot column. The oven,<br />
<strong>in</strong>jector and detector temperatures were 150, 100 and 300 ◦ C,<br />
respectively. The carrier gas was N 2 and the <strong>in</strong>jection volume<br />
was 0.5 cm 3 .<br />
The N 2 O fluxes (f ) were calculated as:<br />
f = C<br />
t<br />
× V A × m V m<br />
, (1)<br />
where C /t is the change <strong>in</strong> N 2 O concentration <strong>in</strong> the chamber<br />
dur<strong>in</strong>g the <strong>in</strong>cubation time t, V is the volume <strong>of</strong> the chamber<br />
(16.7 dm 3 ), A is the soil area (0.13 m 2 ) covered by the chamber,<br />
m is the molecular mass <strong>of</strong> N 2 OandV m is molar volume <strong>of</strong><br />
N 2 O. Gas fluxes were calculated as the <strong>in</strong>crease <strong>in</strong> concentration<br />
dur<strong>in</strong>g the <strong>in</strong>cubation period. A l<strong>in</strong>ear function was fitted to the<br />
N 2 O emission/<strong>in</strong>cubation time relationship. When the coefficient<br />
<strong>of</strong> determ<strong>in</strong>ation (R 2 ) <strong>of</strong> the fitted l<strong>in</strong>ear function was greater than<br />
0.7 the slope <strong>of</strong> the function was taken to be the rate <strong>of</strong> N 2 Oflux<br />
over the 0–40 m<strong>in</strong>utes <strong>in</strong>terval. When R 2 was smaller than 0.7 and<br />
a l<strong>in</strong>ear function could not be fitted, N 2 O flux over the <strong>in</strong>terval<br />
was considered to be null. In this study, the m<strong>in</strong>imum detectable<br />
limits (dist<strong>in</strong>guishable from zero) were either more than 0.3 μg<br />
N 2 O-N m −2 hour −1 or less than −0.3 μg N 2 O-N m −2 hour −1 .All<br />
measured N 2 O emission values were <strong>in</strong>cluded <strong>in</strong> the analysis.<br />
At the same time as the flux measurements, topsoil temperature<br />
was measured at 0.10 m depth beside each chamber. After<br />
gas sampl<strong>in</strong>g, soil samples (0–0.2 m <strong>in</strong> depth) from <strong>in</strong>side the<br />
chamber perimeter were taken. Nitrate-N was extracted from<br />
wet soil samples with a solution <strong>of</strong> CuSO 4 (Jackson, 1958)<br />
and nitrate concentration was determ<strong>in</strong>ed by colorimetry (Keeney<br />
& Nelson, 1982) after reduction <strong>of</strong> nitrate to nitrite (Markus<br />
et al., 1985). Topsoil structural types or classes <strong>in</strong> each site<br />
were described accord<strong>in</strong>g to Soil Survey Staff (1999). Soil bulk<br />
density (BD; 100 cm 3 cyl<strong>in</strong>ders; 0.05 m diameter) and gravimetric<br />
water content (GWC) were determ<strong>in</strong>ed on samples taken with<strong>in</strong><br />
the perimeter <strong>of</strong> each field chamber. Both BD and GWC values<br />
© 2013 British Society <strong>of</strong> Soil Science, European Journal <strong>of</strong> Soil Science, 64, 550–557