Bulletin of the Geological Society of Denmark, Vol. 27/01-02, pp. 15-45
Bulletin of the Geological Society of Denmark, Vol. 27/01-02, pp. 15-45
Bulletin of the Geological Society of Denmark, Vol. 27/01-02, pp. 15-45

You also want an ePaper? Increase the reach of your titles
YUMPU automatically turns print PDFs into web optimized ePapers that Google loves.
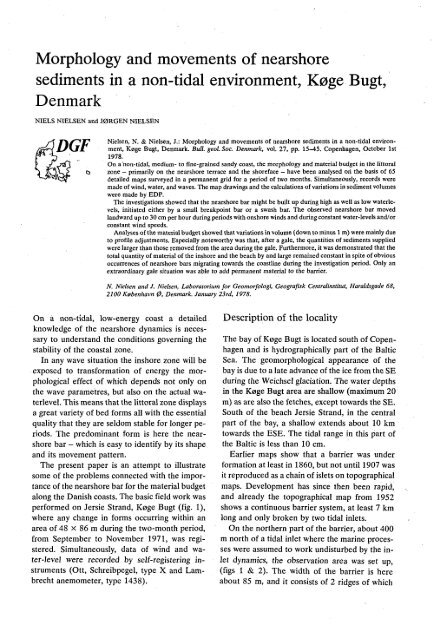
Morphology and movements <strong>of</strong> nearshore<br />
sediments in a non-tidal environment, Køge Bugt,<br />
<strong>Denmark</strong><br />
NIELS NIELSEN and JØRGEN NIELSEN<br />
DGF<br />
Nielsen, N. & Nielsen, J.: Morphology and movements <strong>of</strong> nearshore sediments in a non-tidal environment,<br />
Køge Bugt, <strong>Denmark</strong>. Bull. geol. Soc. <strong>Denmark</strong>, vol. <strong>27</strong>, <strong>pp</strong>. <strong>15</strong>—<strong>45</strong>. Copenhagen, October 1st<br />
1978.<br />
On a non-tidal, medium- to fine-grained sandy coast, <strong>the</strong> morphology and material budget in <strong>the</strong> littoral<br />
zone — primarily on <strong>the</strong> nearshore terrace and <strong>the</strong> shoreface — have been analysed on <strong>the</strong> basis <strong>of</strong> 65<br />
detailed maps surveyed in a permanent grid for a period <strong>of</strong> two months. Simultaneously, records were<br />
made <strong>of</strong> wind, water, and waves. The map drawings and <strong>the</strong> calculations <strong>of</strong> variations in sediment volumes<br />
were made by EDP.<br />
The investigations showed that <strong>the</strong> nearshore bar might be built up during high as well as low waterlevels,<br />
initiated ei<strong>the</strong>r by a small breakpoint bar or a swash bar. The observed nearshore bar moved<br />
landward up to 30 cm per hour during periods with onshore winds and during constant water-levels and/or<br />
constant wind speeds.<br />
Analyses <strong>of</strong> <strong>the</strong> material budget showed that variations in volume (down to minus 1 m) were mainly due<br />
to pr<strong>of</strong>ile adjustments. Especially noteworthy was that, after a gale, <strong>the</strong> quantities <strong>of</strong> sediments su<strong>pp</strong>lied<br />
were larger than those removed from <strong>the</strong> area during <strong>the</strong> gale. Fur<strong>the</strong>rmore, it was demonstrated that <strong>the</strong><br />
total quantity <strong>of</strong> material <strong>of</strong> <strong>the</strong> inshore and <strong>the</strong> beach by and large remained constant in spite <strong>of</strong> obvious<br />
occurrences <strong>of</strong> nearshore bars migrating towards <strong>the</strong> coastline during <strong>the</strong> investigation period. Only an<br />
extraordinary gale situation was able to add permanent material to <strong>the</strong> barrier.<br />
N. Nielsen and J. Nielsen, Laboratorium for Geomorfologi, Geografisk Centralinstitut, Haraldsgade 68,<br />
2100 København 0, <strong>Denmark</strong>. January 23rd, 1978.<br />
On a non-tidal, low-energy coast a detailed<br />
knowledge <strong>of</strong> <strong>the</strong> nearshore dynamics is necessary<br />
to understand <strong>the</strong> conditions governing <strong>the</strong><br />
stability <strong>of</strong> <strong>the</strong> coastal zone.<br />
In any wave situation <strong>the</strong> inshore zone will be<br />
exposed to transformation <strong>of</strong> energy <strong>the</strong> morphological<br />
effect <strong>of</strong> which depends not only on<br />
<strong>the</strong> wave parametres, but also on <strong>the</strong> actual waterlevel.<br />
This means that <strong>the</strong> littoral zone displays<br />
a great variety <strong>of</strong> bed forms all with <strong>the</strong> essential<br />
quality that <strong>the</strong>y are seldom stable for longer periods.<br />
The predominant form is here <strong>the</strong> nearshore<br />
bar - which is easy to identify by its shape<br />
and its movement pattern.<br />
The present paper is an attempt to illustrate<br />
some <strong>of</strong> <strong>the</strong> problems connected with <strong>the</strong> importance<br />
<strong>of</strong> <strong>the</strong> nearshore bar for <strong>the</strong> material budget<br />
along <strong>the</strong> Danish coasts. The basic field work was<br />
performed on Jersie Strand, Køge Bugt (fig. 1),<br />
where any change in forms occurring within an<br />
area <strong>of</strong> 48 x 86 m during <strong>the</strong> two-month period,<br />
from September to November 1971, was registered.<br />
Simultaneously, data <strong>of</strong> wind and water-level<br />
were recorded by self-registering instruments<br />
(Ott, Schreibpegel, type X and Lambrecht<br />
anemometer, type 1438).<br />
Description <strong>of</strong> <strong>the</strong> locality<br />
The bay <strong>of</strong> Køge Bugt is located south <strong>of</strong> Copenhagen<br />
and is hydrographically part <strong>of</strong> <strong>the</strong> Baltic<br />
Sea. The geomorphological a<strong>pp</strong>earance <strong>of</strong> <strong>the</strong><br />
bay is due to a late advance <strong>of</strong> <strong>the</strong> ice from <strong>the</strong> SE<br />
during <strong>the</strong> Weichsel glaciation. The water depths<br />
in <strong>the</strong> Køge Bugt area are shallow (maximum 20<br />
m) as are also <strong>the</strong> fetches, except towards <strong>the</strong> SE.<br />
South <strong>of</strong> <strong>the</strong> beach Jersie Strand, in <strong>the</strong> central<br />
part <strong>of</strong> <strong>the</strong> bay, a shallow extends about 10 km<br />
towards <strong>the</strong> ESE. The tidal range in this part <strong>of</strong><br />
<strong>the</strong> Baltic is less than 10 cm.<br />
Earlier maps show that a barrier was under<br />
formation at least in 1860, but not until 1907 was<br />
it reproduced as a chain <strong>of</strong> islets on topographical<br />
maps. Development has since <strong>the</strong>n been rapid,<br />
and already <strong>the</strong> topographical map from 1952<br />
shows a continuous barrier system, at least 7 km<br />
long and only broken by two tidal inlets.<br />
On <strong>the</strong> nor<strong>the</strong>rn part <strong>of</strong> <strong>the</strong> barrier, about 400<br />
m north <strong>of</strong> a tidal inlet where <strong>the</strong> marine processes<br />
were assumed to work undisturbed by <strong>the</strong> inlet<br />
dynamics, <strong>the</strong> observation area was set up,<br />
(figs 1 & 2). The width <strong>of</strong> <strong>the</strong> barrier is here<br />
about 85 m, and it consists <strong>of</strong> 2 ridges <strong>of</strong> which
16 Nielsen & Nielsen: Nearshore sediments in non-tidal environment<br />
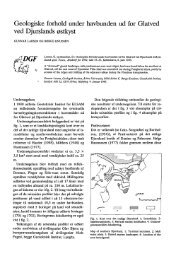
Fig. 1. Map showing <strong>the</strong> location <strong>of</strong> <strong>the</strong> study area in <strong>the</strong> central<br />
part <strong>of</strong> <strong>the</strong> bay Køge Bugt.<br />
<strong>the</strong> oldest one reaches a height <strong>of</strong> 1.6 m and <strong>the</strong><br />
youngest 1.9 m. The morphological border between<br />
<strong>the</strong> marine foreland and <strong>the</strong> beach (fig. 3)<br />
shows in <strong>the</strong> permanent vegetation, here mainly<br />
Elymus arenaria, at a level <strong>of</strong> about 1.3 m DNN<br />
(Danish Ordnance Datum), corresponding to <strong>the</strong><br />
average <strong>of</strong> <strong>the</strong> highest water-levels.<br />
Fig. 2. Cross pr<strong>of</strong>ile <strong>of</strong> Jersie Strand, Køge Bugt. The pr<strong>of</strong>ile<br />
shows <strong>the</strong> main elements <strong>of</strong> <strong>the</strong> coastal zone: <strong>the</strong> lagoon, <strong>the</strong><br />
<strong>of</strong>fshore bar, and <strong>the</strong> nearshore terrace with <strong>the</strong> investigated section<br />
inserted. Zone 1: —5 to +130 cm DNN, width c. <strong>15</strong> m,<br />
gradient: 5°. Zone 2: —<strong>15</strong> to —5 cm DNN, width c. 50 m,<br />
gradient: 1°. Zone 3: -80 to -<strong>15</strong> cm DNN, width c. 25 m,<br />
gradient: 2°.<br />
JERSIE STRAND. KØGE BUGT<br />
The dynamics and <strong>the</strong> morphology <strong>of</strong> <strong>the</strong> inshore<br />
zone have been investigated among o<strong>the</strong>rs<br />
by Schou (19<strong>45</strong>), King & Williams (1949), King<br />
(1959, 1972), Hayes & Broothroyd (1969),<br />
Hayes (1972), and Davis & Fox (1972). In <strong>the</strong>se<br />
papers <strong>the</strong>re seems to be some uncertainty as to<br />
terminology for <strong>the</strong> easily moved bar type on <strong>the</strong><br />
nearshore — called <strong>the</strong> (migrating) nearshore bar<br />
by <strong>the</strong> present authors. The terms ridges and runnels<br />
are used by Davis & Fox (1972) for a tideless<br />
environment (Lake Michigan); to some degree,<br />
<strong>the</strong>y are thus departing from earlier authors' use<br />
<strong>of</strong> this term, such as King & Williams (1949) who<br />
define ridges and runnels as bar systems on very<br />
broad foreshores in typical tidal environments.<br />
Unfortunately, King & Williams, on <strong>the</strong> o<strong>the</strong>r<br />
hand, a<strong>pp</strong>ly <strong>the</strong> term swash bars for <strong>the</strong> migrating<br />
bars produced in a model basin and which correspond<br />
in shape to Davis & Fox's ridges and runnels;<br />
however, <strong>the</strong>se artificial bars differ essentially<br />
from <strong>the</strong> accumulation <strong>of</strong> sediments occurring<br />
on <strong>the</strong> foreshore in consequence <strong>of</strong> <strong>the</strong><br />
swash/backwash dynamics during swells.<br />
The names <strong>of</strong> <strong>the</strong> different coastal zones treated<br />
in this work and <strong>the</strong>ir location on <strong>the</strong> coastal<br />
pr<strong>of</strong>ile a<strong>pp</strong>ear from <strong>the</strong> term diagram below (fig.<br />
4). It might be reasonable, however, first to<br />
comment on <strong>the</strong> diagram terms as to <strong>the</strong> subdivisions<br />
<strong>of</strong> <strong>the</strong> inshore zone, namely breaker zone,<br />
shoreface, and nearshore terrace, each covering a<br />
specific relief <strong>of</strong> <strong>the</strong> sea bottom where different<br />
form elements are produced at rising and falling<br />
water-levels. If, for example, we imagine <strong>the</strong> water-level<br />
drops considerably in <strong>the</strong> investigated<br />
area because <strong>of</strong> a temporary wind set-up in <strong>the</strong><br />
Baltic, <strong>the</strong> water surface might cut <strong>the</strong> nearshore<br />
zone at <strong>the</strong> outer nearshore bar shown on <strong>the</strong><br />
diagram. The foreshore dynamic would move<br />
seaward with a subsequent building up <strong>of</strong> one or<br />
more swash bars on <strong>the</strong> stoss side <strong>of</strong> <strong>the</strong> outer<br />
nearshore bar. As <strong>the</strong> swash zone on tideless<br />
coasts is identical with <strong>the</strong> foreshore, <strong>the</strong> total<br />
CROSS SECTION OF THE BARRIER SEPT. 14th. 1971<br />
2<br />
1<br />
DNN<br />
-1<br />
-2<br />
-LAGOON »J« •BARRIER-<br />
metre<br />
50<br />
-1 1<br />
100<br />
-»!« INSHORE :<br />
RESEARCH SECTION<br />
-ZONE 2-<br />
Z0NE1<br />
-1 1 1 1 1 1— —i v<br />
200<br />
— i — i — i — i — i — i —<br />
300 metres JN/NN
<strong>Bulletin</strong> <strong>of</strong> <strong>the</strong> <strong>Geological</strong> <strong>Society</strong> <strong>of</strong> <strong>Denmark</strong>, vol. <strong>27</strong> 1978 17<br />
•Hi<br />
i<br />
»<br />
V!<br />
V HP<br />
: -%_<br />
.*<br />
fc<br />
WM<br />
F/g. 3. Part <strong>of</strong> aerial photograph <strong>of</strong> Jersie Strand from<br />
21/4 1971. The pr<strong>of</strong>ile line from fig. 2 is inserted and shows <strong>the</strong><br />
nor<strong>the</strong>rn border <strong>of</strong> <strong>the</strong> study area. 1. breakpoint bar; 2. nearshore<br />
bar; 3. beach and 4. swells. (Air photo: LLO).<br />
2 D.g.F. <strong>27</strong>
18 Nielsen & Nielsen: Nearshore sediments in non-tidal environment<br />
TERMINOLOGY OF NON-TIDAL COASTS<br />
*\ COASTAL ZONE<br />
FORESHORE-<br />
SWASH BAR —<br />
_j BACK<br />
ISHORE<br />
NEARSHORE BAR • ." >&<br />
RUNNEL<br />
®<br />
Fig. 4. Terminology <strong>of</strong> <strong>the</strong> nearshore environment <strong>of</strong> a non-tidal<br />
coast.<br />
width <strong>of</strong> <strong>the</strong> beach would be considerably enlarged<br />
during low-water conditions.<br />
The wave zones and <strong>the</strong> wave characteristics<br />
change considerably during low-water periods.<br />
These occur mostly with <strong>of</strong>fshore winds. At <strong>the</strong><br />
same time, however, <strong>the</strong> nearshore gradient just<br />
seaward <strong>of</strong> <strong>the</strong> swash zone is steeper than by<br />
normal water-levels and this means that <strong>the</strong> surf<br />
zone will be reduced or disa<strong>pp</strong>ear even under<br />
moderate wave activities so that <strong>the</strong> transition<br />
waves dissolve directly into <strong>the</strong> swash zone..<br />
Collection <strong>of</strong> data<br />
In order to make <strong>the</strong> basic contour maps, <strong>the</strong><br />
establishment <strong>of</strong> a rapid, but also accurate<br />
measurement method was necessary. Traditional<br />
surveying on <strong>the</strong> basis <strong>of</strong> tachymetrical measuring<br />
would be too timeconsuming both in <strong>the</strong> field and<br />
during <strong>the</strong> subsequent calculation and working-up<br />
<strong>of</strong> <strong>the</strong> data. The survey procedure was to<br />
fullfil <strong>the</strong> following conditions: 1) to be operational<br />
in any wea<strong>the</strong>r situation, 2) each measuring<br />
procedure was to be so short that <strong>the</strong> registered<br />
form elements could reasonably be considered a<br />
"snapshot" <strong>of</strong> it, and finally, 3) that <strong>the</strong> collected<br />
amounts <strong>of</strong> data - which were expected to be<br />
large - should not result in more work than could<br />
be coped with.<br />
The authors have earlier made sample<br />
measurements in grid nets with meshes in isometric<br />
triangles in order to avoid interpolation difficulties.<br />
As it also gives a good basis for electronic<br />
processing, this system waschoseri; fur<strong>the</strong>rmore<br />
<strong>the</strong> above three points were fulfilled and <strong>the</strong> calculation<br />
and <strong>the</strong> working up <strong>of</strong> <strong>the</strong> single contour<br />
maps could be made simultaneously. (The program<br />
was set up by Ole Hebin, Geographical Institute,<br />
University <strong>of</strong> Copenhagen).<br />
The grid net was related to an earlier established<br />
basis line with points related to DNN. As<br />
secondary basis, a line on <strong>the</strong> backshore was<br />
used, located parallel with, and about 0.5 m <strong>of</strong>f<br />
<strong>the</strong> permanent vegetation border. The point net<br />
which covered a morphological unit (nearshore<br />
bar and a rip channel) was built up by means <strong>of</strong><br />
13 pr<strong>of</strong>ile lines perpendicular to <strong>the</strong> basis line and<br />
with 4 m-intervals (fig. 9). Each line was furnished<br />
with poles (diameter: 22 mm) for each 4
<strong>Bulletin</strong> <strong>of</strong> <strong>the</strong> <strong>Geological</strong> <strong>Society</strong> <strong>of</strong> <strong>Denmark</strong>, vol. <strong>27</strong> 1978 19<br />
B...<br />
Fig. 5. The measuring net ready for use, seen from <strong>the</strong> S W.<br />
m. The poles were displaced 2 m in every second<br />
line to form an a<strong>pp</strong>roximately isometrical triangle<br />
net with a total <strong>of</strong> 286 points (fig. 5). The top<br />
level <strong>of</strong> <strong>the</strong> poles were adjusted to same height<br />
above DNN. Routine measurements were made<br />
by measuring in each point <strong>the</strong> distance from <strong>the</strong><br />
pole top to land and <strong>the</strong>n inform <strong>the</strong> result over<br />
radio to a person on <strong>the</strong> shore. This procedure<br />
-I<br />
*<br />
Fig. 6. Measuring in rough wea<strong>the</strong>r on 23/9. The permanent pole<br />
net makes it possible to take records also under conditions when<br />
conventional methods are impossible to use. The single records<br />
are transferred to land over <strong>the</strong> radio.<br />
could be performed during all wea<strong>the</strong>r conditions<br />
in about half an hour with an accuracy <strong>of</strong> ± 2 mm<br />
(fig. 6).<br />
During <strong>the</strong> period 14/9-11/11 1971 a total <strong>of</strong><br />
65 surveys were made. The area was measured at<br />
least once a day from 14/9 to 28/10. Fur<strong>the</strong>rmore,<br />
measurements were made <strong>the</strong> following<br />
days: 30/10, 1/11, 4/11, 7/11 and finally one on<br />
11/11. On days with great wave activity several<br />
measurements were made. Thus, two on 16/9, six<br />
23/9, four <strong>27</strong>/9, and two 28/9. To avoid misinformation<br />
as to <strong>the</strong> exact location <strong>of</strong> <strong>the</strong> nearshore<br />
bars, <strong>the</strong> <strong>of</strong>ten sharp border between <strong>the</strong><br />
surface <strong>of</strong> <strong>the</strong> nearshore terrace and <strong>the</strong> bar front<br />
was included in each routine measurement. Fur<strong>the</strong>rmore,<br />
13 special measurements were made <strong>of</strong><br />
<strong>the</strong> morphological borders existing on <strong>the</strong> nearshore<br />
terrace <strong>of</strong> rip channels, swash bars, ri<strong>pp</strong>le<br />
patterns, <strong>the</strong> border: nearshore/beach etc. The<br />
pole net was also a<strong>pp</strong>lied to investigate <strong>the</strong> water<br />
movements and current conditions in <strong>the</strong> study<br />
area. A balanced float was put out close to a pole<br />
and <strong>the</strong>n followed through <strong>the</strong> net. When passing<br />
a pole, coordinates and time were reported over<br />
<strong>the</strong> radio.<br />
The fundamental factors, wind speeds and waterlevels,<br />
were measured by means <strong>of</strong> self-registering<br />
instruments. The wind gauge was set up<br />
on <strong>the</strong> barrier itself, whereas <strong>the</strong> water-level recorder<br />
was placed in <strong>the</strong> harbour <strong>of</strong> Køge, 6.5 km<br />
from <strong>the</strong> sample area. To control <strong>the</strong> actual water-level,<br />
a board was set up in <strong>the</strong> measurement<br />
area and mounted with transparant tubes to sub-
20 Nielsen & Nielsen: Nearshore sediments in non-tidal environment<br />
Fig. 7. The mean grain sizes (MJ and sorting<br />
(6,) (Folk & Ward 1957), shown in relation<br />
to <strong>the</strong> most important morphological<br />
borders.<br />
no<br />
line<br />
, Q<br />
12<br />
14<br />
16<br />
18<br />
20<br />
22<br />
24<br />
26<br />
28<br />
30<br />
32<br />
34<br />
36<br />
38<br />
40<br />
42<br />
44<br />
46<br />
48<br />
50<br />
52<br />
1.81<br />
0.42<br />
1.94<br />
0.44<br />
1.00<br />
1.2!<br />
1.88<br />
0.95<br />
2.20<br />
0.4$<br />
2.00<br />
0.5!<br />
2.17<br />
0.5!<br />
2.35<br />
0.50<br />
2.44<br />
0.42<br />
2.61<br />
0.38<br />
2.52<br />
0.46<br />
2.40<br />
0.41<br />
2.41<br />
0.30<br />
2.36<br />
0.42<br />
2.39<br />
0.38<br />
2.34<br />
0.41<br />
2.31<br />
0.39<br />
2.43<br />
0.37<br />
2.44<br />
0.29<br />
2.51<br />
0.32<br />
2.64<br />
0.34<br />
2.54<br />
0.5!<br />
backshore<br />
foreshore<br />
nearshore<br />
terrace<br />
nearshore bar J<br />
front<br />
2.57 2.66<br />
0.42 0.42<br />
/<br />
\ 1<br />
1.71<br />
0.50<br />
1.74<br />
0.75<br />
2.58<br />
0.59<br />
2.61<br />
0.44<br />
2.<strong>01</strong><br />
0.53<br />
V 2.30<br />
0.44<br />
I I" 48 '<br />
\^0.4S<br />
2.68<br />
0.38<br />
2.30<br />
0.39<br />
2.44<br />
0.3!<br />
2.71<br />
0.35<br />
2.44<br />
0.46<br />
Mz<br />
Æ,<br />
° i<br />
10 11 12 13<br />
2. .06 _<br />
/o .34 ^ ^ \<br />
' 2 .22 ^ \<br />
0, .40<br />
2, .26<br />
0. .35<br />
2, .26<br />
0. .41<br />
2, .<strong>45</strong><br />
0. .36<br />
2. .50<br />
0. .35<br />
2. .32<br />
0. , 4 , x<br />
2. .47 2.68<br />
0. .32 0.38<br />
1.87<br />
0. 38<br />
1.83<br />
0.43<br />
0.89<br />
1.62<br />
0.79<br />
1.34<br />
2.<strong>15</strong><br />
0.4$<br />
2.17<br />
0.55<br />
2.38<br />
0.4%<br />
2.49<br />
\ 0 . 4 2<br />
2.13<br />
0.49<br />
2.32<br />
0.43<br />
2.42.<br />
0.43<br />
2.48<br />
0.37<br />
2.29<br />
0.50<br />
•2.28<br />
0.44<br />
2.38<br />
0.44<br />
2.38<br />
0.43<br />
2.40<br />
0.38<br />
2.42<br />
0.38<br />
2.60<br />
0.28<br />
2.62<br />
0.3!<br />
2.69<br />
0.30<br />
2.70<br />
0.36<br />
due <strong>the</strong> water column. Unfortunately, we did not<br />
have a recorder at our disposal, so wave heights<br />
had to be found by means <strong>of</strong> <strong>the</strong> waterlevel<br />
board, and wave period and -length had to be<br />
measured within <strong>the</strong> pole net. Compared with <strong>the</strong><br />
quality <strong>of</strong> <strong>the</strong> measurements <strong>of</strong> form elements,<br />
we consider those <strong>of</strong> waves as a weak link in <strong>the</strong><br />
present work. To illustrate <strong>the</strong> sediment conditions<br />
<strong>of</strong> <strong>the</strong> locality, samplings by a 5 cm high<br />
aluminium cylinder (diameter 4.5 cm) were made<br />
at each pole in lines 1 and 13, and at each second<br />
pole in line 7 and in crossline 52 (60 samples).<br />
Besides this sampling, which gave a general picture<br />
<strong>of</strong> <strong>the</strong> grain size distribution <strong>of</strong> <strong>the</strong> area, a<br />
detailed sampling (29 samples) was made in line<br />
9 across a nearshore bar.<br />
Sediments in <strong>the</strong> study area<br />
Besides showing a slight difference between <strong>the</strong><br />
most important morphological zones (backshore,<br />
foreshore, nearshore) <strong>the</strong> statistical parametres<br />
demonstrate a homogeneous sediment in <strong>the</strong> investigation<br />
area (fig. 7). A more detailed statistical<br />
analysis was <strong>the</strong>refore only made for <strong>the</strong> special<br />
sampling in line 9 in order to trace possible<br />
sorting processes in connection with <strong>the</strong> formation<br />
and migration <strong>of</strong> <strong>the</strong> nearshore bar.<br />
Because <strong>of</strong> <strong>the</strong> slight variations an F-test was<br />
made by pairwise comparison, to investigate<br />
whe<strong>the</strong>r <strong>the</strong> sorting <strong>of</strong> <strong>the</strong> samples was significantly<br />
different. This was only due for combinations<br />
<strong>of</strong> samples from <strong>the</strong> top <strong>of</strong> <strong>the</strong> bar and from<br />
<strong>the</strong> seaward trough; but neighbour samples might<br />
mutually originate from <strong>the</strong> same mo<strong>the</strong>r distribution.<br />
Where <strong>the</strong> F-test allowed, at-test was made<br />
on <strong>the</strong> mean grain size. By means <strong>of</strong> <strong>the</strong><br />
t-tests' significance levels, it was now possible to<br />
separate 3 sediment types. For each group, a<br />
weighted average was calculated (fig. 8).<br />
The largest mean grain size was found on <strong>the</strong><br />
u<strong>pp</strong>er part <strong>of</strong> <strong>the</strong> flat stoss side <strong>of</strong> <strong>the</strong> nearshore<br />
bar, <strong>the</strong> side most exposed to <strong>the</strong> dynamic forces.
<strong>Bulletin</strong> <strong>of</strong> <strong>the</strong> <strong>Geological</strong> <strong>Society</strong> <strong>of</strong> <strong>Denmark</strong>, vol. <strong>27</strong> 1978 21<br />
JERSIE STRAND, KØGE BUGT<br />
Type <strong>of</strong> sediments <strong>of</strong> <strong>the</strong> nearshore bar<br />
Pr<strong>of</strong>ile 9<br />
surface<br />
morphologi<br />
type <strong>of</strong><br />
sediment<br />
ri<strong>pp</strong>les<br />
M-<br />
><br />
2.<strong>27</strong> I 2.12 I<br />
207 ' 230 '<br />
smooth<br />
2.<strong>27</strong><br />
207<br />
ri<strong>pp</strong>les<br />
Oct. 6 th. 1971<br />
asym symmetrical<br />
2.46<br />
181<br />
smooth<br />
bottom<br />
I 2.<strong>27</strong><br />
207<br />
20 metres<br />
Exaggeration- 112.5 x<br />
Fig. 8. Relationship between grain size parameters, morphology ments were taken at a quite smooth bottom influenced by surf<br />
and bedforms on <strong>the</strong> nearshore bar in line 9.<br />
waves, whereas <strong>the</strong> fine-grained sediments were found in places<br />
During <strong>the</strong> sampling, variations in <strong>the</strong> micro morphology <strong>of</strong> with ri<strong>pp</strong>les formed by <strong>the</strong> oscillating waves.<br />
<strong>the</strong> sea bottom were ascertained. The most coarse-grained sedi<br />
The grain size is decreasing both on <strong>the</strong> leeside<br />
and down towards <strong>the</strong> runnel in front <strong>of</strong> <strong>the</strong> next<br />
nearshore bar, a pattern which could also be discerned<br />
in <strong>the</strong> general sampling.<br />
Morphological development during <strong>the</strong><br />
observation period<br />
The general morphological development in <strong>the</strong><br />
study area a<strong>pp</strong>ears from <strong>the</strong> selected contour<br />
maps (figs 9a-j). The nearshore bar migrates<br />
onshore at varying speeds, but stagnates before it<br />
reaches a complete fusion with <strong>the</strong> foreshore<br />
(16/10, fig. 9g), partly because new bars, formed<br />
seaward <strong>of</strong> <strong>the</strong> old one, absorb a great deal <strong>of</strong> <strong>the</strong><br />
wave energy (fig. 11). A characteristic feature in<br />
<strong>the</strong> development <strong>of</strong> <strong>the</strong> nearshore bar is that it<br />
does not migrate at right angles onshore, but obliquely<br />
through <strong>the</strong> study area. During <strong>the</strong> last<br />
part <strong>of</strong> <strong>the</strong> investigation period (4/11 to 11/11,<br />
figs 9i-j), <strong>the</strong> nearshore bar is dissolving just as it<br />
leaves <strong>the</strong> study area.<br />
For more detailed analyses <strong>of</strong> <strong>the</strong> morphological<br />
development <strong>the</strong>re was constructed besides<br />
<strong>the</strong> contour maps, a map showing <strong>the</strong> movements<br />
<strong>of</strong> <strong>the</strong> bar fronts and <strong>the</strong> swash bars (fig. 12) and<br />
a timedistance diagram <strong>of</strong> <strong>the</strong> pr<strong>of</strong>ile lines 1,4, 7,<br />
10 and 13. The T-D diagram makes it possible to<br />
correlate <strong>the</strong> about 20,000 level records from <strong>the</strong><br />
65 contour maps and follow <strong>the</strong> morphological<br />
development in connection with wind- and water<br />
level observations (figs lOa-c). There were made<br />
no statistical levellings <strong>of</strong> <strong>the</strong> recorded wind- and<br />
water-level data such as Fourier analyses, as suggested<br />
by Davis and Fox 1971 and 1972 because<br />
<strong>the</strong> alterations <strong>of</strong> form on <strong>the</strong> beach plane terrace<br />
take place during specific wea<strong>the</strong>r situations and<br />
within very short intervals.
22 Nielsen & Nielsen: Nearshore sediments in non-tidal environment<br />
17.5 "<br />
0.0 2.5<br />
SO 7.5 10 0 12.5 lS.0 17.5 20 0 22.5 25.0 <strong>27</strong>.5 30.0 12.5 35 D 17 5 40 0 42.5 <strong>15</strong>.0 17.5 53.0 12.5 E5.0 57.5 60.0 62.5 65.0 G7.5 70.0 72.5 75 0 77 5 60 0 82 5 85.0 MEIER<br />
\_^»-/> N \ \ i ' i 'i ' ' ) \ nm ii i «•*<br />
0.0 2.5 5.0 7.5 10.0 12.5 <strong>15</strong> 0 17.5 20.0 22.5 25.0 <strong>27</strong>.5 30.0 12.5 35.0 37.5 SO. 0 12.5 <strong>15</strong>.0 17.5 50.0 52.5 55.0 57.5 60.0 62.5 65.0 67.5 70.0 72.5 75.0 77.5 60.0 62.5 65.0<br />
Fig. 9a. Contour map <strong>of</strong> <strong>the</strong> study area 14/9-1971 (contour<br />
interval: 5 cm) surveyed from <strong>15</strong>35 h to 1620 h. Water level: +3<br />
cm DNN, wind velocity: 3 m/sec, from NNW. The figures <strong>of</strong><br />
ordinate and abscissa are in metres. The ordinate points NNE.<br />
The —5 cm contour delimits <strong>the</strong> nearshore bar which has <strong>the</strong><br />
characteristic steep lee side and flat stoss side. To <strong>the</strong> south, a rip<br />
channel drains <strong>the</strong> water from <strong>the</strong> trough between <strong>the</strong> nearshore<br />
bar and <strong>the</strong> beach.<br />
0.0 2.5 5.0 7.5 10.0 12.5 <strong>15</strong>.0 17.5 20.0 22.5 25.0 <strong>27</strong>.5 30.0 32.5 35.0 37.5 lO C 12.5 <strong>15</strong>.0 -7 5 50.0 52.5 55.0 57.5 60.0 62.5 65.0 67.5 70.0 72.5 75.0 77.5 60 0 62.5 65.0 METEH<br />
0 0 2.5 5 0 7 5 10 0 12 5 <strong>15</strong> 0 17.5 20.0 22.5 25.0 <strong>27</strong>.5 30.0 32.5 35.0 37.5 10 0 12.5 <strong>15</strong>.0 17.5 50 0 52. 5 55. 0 57. 5 60 0 62.5 65.0 67.5 70.0 72.5 75.0 77.5 60.0 62.5 65.0<br />
Fig. 9b. Contour map 23/9-1971, surveyed from 1955 h to<br />
2110 h. Water level: +31 cm, wind velocity: 10 m/sec,from SSE.
<strong>Bulletin</strong> <strong>of</strong> <strong>the</strong> <strong>Geological</strong> <strong>Society</strong> <strong>of</strong> <strong>Denmark</strong>, vol. <strong>27</strong> 1978 23<br />
0 0 2.S SO 7.5 10 0 12 5 <strong>15</strong> D 17.5 20.0 22.5 2S.0 <strong>27</strong>.5 30.0 32.5 25.0 17.5 40 0 Hi 5 <strong>15</strong> 0 47 5 50 0 52.5 55.0 57.5 60.0 G2.5 65.0 67.5 70.0 72.5 75.0 77.5 60.0 82.5 65.0 METER<br />
0.0 2 5 5.0 7 5 10 0 12.5 <strong>15</strong> 0 17.5 20.0 22.5 25.0 <strong>27</strong>.5 3D. 0 32.5 25.0 37.5 10.0 43. 5 <strong>45</strong>.0 47.5 50.0 52.S 55.0 57.5 60.0 62.5 65.0 67.5 70.0 72.5 75. 0 77. 5 60. D 62. 5 65. D<br />
Fig. 9c. Contour map 26/9-1971, surveyed 1840 h. Water level:<br />
+33 cm, wind velocity: 1 m/sec, from WNW.<br />
47.5<br />
<strong>45</strong>.0<br />
42.5<br />
40.0<br />
37.5<br />
35.0<br />
32. S<br />
30.0<br />
<strong>27</strong>.5<br />
25.0<br />
22.5<br />
00 25 50 75 10 0 12 5 <strong>15</strong> 0 17.5 20.0 22.5 25.0 <strong>27</strong>.5 30 0 12 5 35 C 3-'.5 40 0 •*?.', li. 0
24 Nielsen & Nielsen: Nearshore sediments in non-tidal environment<br />
0 0 2 5 5 0 7 S 10 0 12 5 <strong>15</strong> 0 17. 5 20 0 22.5 25-0 <strong>27</strong> 5 30 0 12.5 35.0 17.5 SO 0 12.5 *5.0 17.5 50 0 52.5 55.0 57.5 50. 0 F.2. 5 65.0 67.5 70.0 72.5 75.0 77.5 60 0 £2.5 65.0 METER<br />
^\\\W]<br />
l\ W>^\\\\\W\\<br />
i I M i<br />
„. wwww<br />
\\W\1 111!<br />
\<br />
\\<br />
12.5<br />
10 0<br />
17.5<br />
35. D<br />
12.5<br />
30 0<br />
<strong>27</strong>. e<br />
25.0<br />
22.5<br />
20 0<br />
17.5<br />
<strong>15</strong>.0<br />
12.5<br />
10 0<br />
3.0 2.5 5.0 7.5 10.0 12.5 <strong>15</strong>.C 17.5 20.0 22.5 25.0 <strong>27</strong>.5 30.0 12.5 35.0 37.5 i0. D 12.5 95.0 17.5 50.0
<strong>Bulletin</strong>, <strong>of</strong> <strong>the</strong> <strong>Geological</strong> <strong>Society</strong> <strong>of</strong> <strong>Denmark</strong>, vol. <strong>27</strong> 1978 25<br />
0.0 2.5 5.0 7 5 10 0 12.5 <strong>15</strong> 3 17 5 30 0 22.5 25 0 <strong>27</strong> S 30 0 32.5 35 0 37 5*0.0 12.5 <strong>15</strong>.0 17.5 SO 0 52.5 55.D 57.5 E0 0 62.5 65.0 67.5 70 0 72.5 75.0 77.5 80 Q IS2.S £5.0 METER<br />
17.5<br />
1S.0<br />
12.5<br />
10.0<br />
37.5<br />
35.0<br />
32.5<br />
30.0<br />
<strong>27</strong>.5<br />
25.0<br />
22.5<br />
20.0<br />
17.5<br />
<strong>15</strong>.D<br />
12.5<br />
W"-'<br />
s tP:.m \<br />
0 0 2 5 5 0 7.S 1O.0 12.5 <strong>15</strong>.0 17.5 20 C 22.5 2S.0 <strong>27</strong>.5 00 0 12.5 35.0 17, 5 40.0 42.5 <strong>45</strong>.0 47 5 SO 0 52 5 55 0 57 5 60 0 62.5 65.0 E7.5 70 0 72.5 75.0 77.5 00 0 62.5 65.0<br />
Fig. 9g. Contour map 16/10-1971, surveyed from 1725 h to<br />
18<strong>15</strong> h. Water level: +30 cm, wind velocity: 8 m/sec, from S.<br />
0.0 2.5 5.0 7.5 100 12.5 <strong>15</strong>.0 17.5 20.0 22.5 25.G <strong>27</strong>.5 30.0 32.5 35.0 37.5 40.0 42.5 <strong>45</strong>.0 47.5 50. 0 52.5 55.0 57. S 60 C 62. 5 65.0 67.5 70. 0 72.5 75.0 77.5 60.0 82.5 85.0 MfTFfl<br />
' 0.0 2.5 5 C 7.5 ICO 12.5 <strong>15</strong>.0 17.5 20. 0 22.5 25.0 <strong>27</strong>. 5 30. C 32.5 35. 0 37. 5 40. C 42. 5 <strong>45</strong>.0 47. 5 50 0 52. 5 55.0 57. 5 60. C 62. S 65. C 67. 5 70.0 72.5 75.0 77.5 80.0 62.5 65.0<br />
Fig. 9h. Contour map 18/10-1971, surveyed from 11<strong>15</strong> h to<br />
1220 h. Water level: 0 cm, wind velocity: 9 m/sec, from SW.
26 Nielsen & Nielsen: Nearshore sediments in non-tidal environment<br />
nWWWWWWU<br />
w<br />
°° 2-5 5,0 7.5 10.0 !2.j IS.C 17.5 20.G22.5 25.0 <strong>27</strong>.5 30,0 32.5 35.0 17.5 10,0 42.5 <strong>15</strong>.0 47.5 50.0 52.5 55.0 57.5 60.0 62.5 65.0 67. S 70.0 72.5 7S.0 77.5 60.0 62.5 65.0 METER<br />
17.5<br />
\\\<br />
\ I \\W\lli<br />
LL<br />
0,0 2,'i 5.C 7.5 10.0 12.5 <strong>15</strong>.0 17.5 20.0 22.5 25.0 <strong>27</strong>.5 30.0 3^.5 35.0 37.5 10. C 12.5 <strong>15</strong>.0 17.5 50.0 52.5 55.0 57.5 60.0 62.5 65.0 67.5 70.0 72.5 75.0 77.5 60.0 62.5 65.0<br />
<strong>15</strong>.0<br />
12.5<br />
10.0<br />
37. S<br />
35.0<br />
32.5<br />
30.0<br />
<strong>27</strong>.5<br />
25.0<br />
22.5<br />
20.0<br />
17.5<br />
ts.o<br />
12.5<br />
10.Q<br />
Fig. 9i. Contour map 4/11-1971, surveyed from 1100 h to 1200<br />
h. Water level: +1 cm, wind velocity: 9 m/sec, from WNW.<br />
9 C 2.5 5 0 7 5 10.0 12.5 <strong>15</strong>.0 17.5 20.0 22-5 25.0 <strong>27</strong>.5 30 0 32.5 35-C 37.5 10 0 12.5 <strong>15</strong>.0 T7.5 50 C 52.5 55.0 57.5 60.0 62.5 65.0 fi7.5 70.0 72.5 75.0 77.5 SCO £2.5 65.0 MtTER<br />
\ Wl/I<br />
' 0 0 2.5 5.C 7 G IC G !2 G IG.O 17.5 30.0 22.G 25.0 <strong>27</strong>.5 GO.O 72.5 35 0 17.5 «0 0 12.G IG.C 47.5 50 0 G2. G SS.C 57.5 60.0 G2. 5 GS. 0 57. 5 70. 0 72.G 75.0 77.5 GO.C £2.G SG.C<br />
Fig. 9j. Contour map 11/11-1971, surveyed from 1<strong>02</strong>0 h to<br />
1120 h. The last map <strong>of</strong> <strong>the</strong> investigation. Water level: +3 cm,<br />
wind velocity: 6 ml sec, from WSW.
<strong>Bulletin</strong> <strong>of</strong> <strong>the</strong> <strong>Geological</strong> <strong>Society</strong> <strong>of</strong> <strong>Denmark</strong>, vol. <strong>27</strong> 1978 <strong>27</strong><br />
Fig. 10. T-D diagrams for <strong>the</strong> pr<strong>of</strong>ile lines 1, 4, 7, 10 and 13. is not parallel with <strong>the</strong> shoreline, <strong>the</strong> pr<strong>of</strong>ile is changing and <strong>the</strong><br />
Time is abscissa and <strong>the</strong> pr<strong>of</strong>ile <strong>the</strong> ordinate, indicated by polenumbers.<br />
When an isoline is parallel with <strong>the</strong> time-axis, <strong>the</strong> loca<br />
and <strong>the</strong> x-axis.<br />
speed <strong>of</strong> this change increases by <strong>the</strong> angle between <strong>the</strong> isoline<br />
tion <strong>of</strong> <strong>the</strong> level is stable in relation to <strong>the</strong> shoreline. If <strong>the</strong> isoline
28 Nielsen & Nielsen: Nearshore sediments in non-tidal environment<br />
Fig. 10b.
S<br />
(*>•<br />
Cd<br />
c
30 Nielsen & Nielsen: Nearshore sediments in non-tidal environment<br />
Fig. 11. The nearshore terrace at extreme low-water seen towards<br />
<strong>the</strong> south on 22/10. The innermost nearshore bar is in contact<br />
with <strong>the</strong> beach.<br />
The morphology in <strong>the</strong> pr<strong>of</strong>ile, line 10 (fig.<br />
10a) shows <strong>the</strong> development <strong>of</strong> <strong>the</strong> nor<strong>the</strong>rn part<br />
<strong>of</strong> <strong>the</strong> study area and central part <strong>of</strong> <strong>the</strong> nearshore<br />
bar. The dynamic picture in <strong>the</strong> diagram<br />
can generally be divided into two easily separated<br />
parts which represent stable and mobile phases.<br />
The active periods are: 23/9, <strong>27</strong>-29/9 and<br />
<strong>15</strong>-18/10. The night between 22 and 23/9 <strong>the</strong><br />
wind turned from <strong>the</strong> WSW over N to <strong>the</strong> SE and<br />
<strong>the</strong>reby became active on <strong>the</strong> coast. Simultaneously<br />
<strong>the</strong> wind speed increased from 0 to maximum<br />
11 m/sec. and <strong>the</strong> waterlevel from 10 to 30<br />
cm DDN (figs 10a, c). The nearshore bar front,<br />
which has moved about 1 m onshore during <strong>the</strong><br />
9V2 days since <strong>the</strong> 14/9 (fig. 12) now migrated<br />
about 2.5 m onshore during <strong>the</strong> next 24 hours<br />
from 23/9 1100 until 24/9 1100, an average<br />
speed <strong>of</strong> more than 10 cm/hour. Table 1 shows<br />
<strong>the</strong> recorded migration speeds from measurement<br />
to measurement.<br />
Although 6 measurements were made 23/9 it is<br />
<strong>of</strong> course only possible to get average values for<br />
<strong>the</strong> bar motion; never<strong>the</strong>less <strong>the</strong> following interesting<br />
thing could be noticed: <strong>the</strong> migration speed<br />
Table 1. The migration distance and speed <strong>of</strong> <strong>the</strong> nearshore bar (from original records) and <strong>the</strong> simultaneous wave-, wind-, and<br />
water-level conditions for <strong>the</strong> period 22/9-24/9 1971, measured in line 10. The direction <strong>of</strong> bar movements diverges 25° from <strong>the</strong><br />
direction <strong>of</strong> <strong>the</strong> pr<strong>of</strong>ile line.<br />
Date<br />
hour<br />
H(m)<br />
Waves<br />
L(m)<br />
T(sec)<br />
Water- Wind Direction The bar's front The bar's<br />
level veloc. movement average speed<br />
(cm) (cm) (cm (cm/h<br />
DNN (m/sec.) °N adjust. 25°) (cm/h) adjust.)<br />
22/9<br />
23/9<br />
23/9<br />
23/9<br />
23/9<br />
23/9<br />
23/9<br />
24/9<br />
25/9<br />
1600<br />
1100<br />
1400<br />
<strong>15</strong>30<br />
1800<br />
2030<br />
2300<br />
1030<br />
1620<br />
0.04<br />
0.<strong>15</strong><br />
0.4<br />
0.5<br />
0.5<br />
0.<strong>45</strong><br />
0.3<br />
0.2<br />
0<br />
0<br />
5.0<br />
7.0<br />
8.5<br />
11.0<br />
8.0<br />
0<br />
0<br />
2<br />
3<br />
3.6<br />
3.4<br />
4.2<br />
3.8<br />
3.3<br />
0<br />
8<br />
19<br />
23<br />
<strong>27</strong><br />
28<br />
31<br />
<strong>27</strong><br />
21<br />
-<strong>15</strong><br />
5<br />
5<br />
7<br />
6<br />
7<br />
10<br />
7<br />
7<br />
6<br />
160<br />
130<br />
140<br />
140<br />
<strong>15</strong>0<br />
<strong>15</strong>0<br />
<strong>15</strong>0<br />
240<br />
280<br />
10<br />
10<br />
20<br />
60<br />
6(1<br />
<strong>45</strong><br />
65<br />
20<br />
9<br />
9<br />
18<br />
54<br />
54<br />
41<br />
59<br />
18<br />
0.2<br />
3.3<br />
13.3<br />
24.0<br />
24.0<br />
18.0<br />
5.6<br />
1.1<br />
0.2<br />
3.1<br />
12.5<br />
22.6<br />
22.6<br />
16.9<br />
5.3<br />
1.1
<strong>Bulletin</strong> <strong>of</strong> <strong>the</strong> <strong>Geological</strong> <strong>Society</strong> <strong>of</strong> <strong>Denmark</strong>, vol. <strong>27</strong> 1978 31<br />
®<br />
f "^, Front <strong>of</strong> a nearshore bar Oct. 22. 1600 h.<br />
i<br />
law—J<br />
Beach<br />
--52ro",|-,<br />
Front <strong>of</strong> a nearshore bar Oct. 22. 1600 h. dim border<br />
ÉÉjjj<br />
Dense veg. (Elymusarenarius)<br />
J££r--_ Breakpoint step Oct. 26.<br />
Vegetation (Honckenya peploides)<br />
Illl Swash bar Oct. 7 1200 h.<br />
Veg tufts ( Elymus arenarius)<br />
Fig. 12. The positions <strong>of</strong> <strong>the</strong> nearshore bar fronts and <strong>of</strong> <strong>the</strong><br />
swash bars during <strong>the</strong> investigation period.<br />
increased markedly around noon, about 2 hours<br />
after <strong>the</strong> water-level had submerged <strong>the</strong> nearshore<br />
bar, and <strong>the</strong> speed increased with <strong>the</strong> increasing<br />
wind speed and water-levels <strong>the</strong> next<br />
6-8 hours. The decline in speed recorded after<br />
2000 followed <strong>the</strong> decline in both water-level and<br />
wind speed. This accordance was not found, however,<br />
between <strong>the</strong> two measurements: 23/9 at<br />
2300 and 24/9 at 1100, when <strong>the</strong> bar motion<br />
decreased to 5.6 cm/h. The explanation must be<br />
<strong>the</strong> changing wind direction (24/9 at 0400) from<br />
<strong>the</strong> active SSE wind to <strong>the</strong> passive SW direction.
32 Nielsen & Nielsen: Nearshore sediments in non-tidal environment<br />
Table 2. The migration distance and speed <strong>of</strong> <strong>the</strong> nearshore bar and<br />
period 25/9-30/9 1971, measured in line 10.<br />
water-<br />
Date hour waves level<br />
H(m) L(m) T(sec) (cm)<br />
DNN<br />
<strong>27</strong>/9 and 29/9 <strong>the</strong> forms were considerably<br />
displaced on <strong>the</strong> nearshore, and <strong>the</strong> highest bar<br />
front speed was registered <strong>27</strong>/9 at noon (32.6<br />
cm/h) as table 2 shows.<br />
When <strong>the</strong> water-level was high and <strong>the</strong> nearshore<br />
bar submerged, water movements were<br />
quite different from <strong>the</strong> direction <strong>of</strong> <strong>the</strong> incoming<br />
waves generated on <strong>the</strong> nearshore terrace. On <strong>the</strong><br />
<strong>27</strong>/9 two current observations were performed.<br />
By means <strong>of</strong> a balanced float <strong>the</strong> water movements<br />
could be surveyed in great detail because<br />
<strong>of</strong> <strong>the</strong> permanent grid net.<br />
On <strong>the</strong> landward part <strong>of</strong> <strong>the</strong> nearshore terrace,<br />
where <strong>the</strong> waves are transformed into surf waves<br />
(at -20 to -30 cm DNN) <strong>the</strong> floats follow <strong>the</strong><br />
courses determined by <strong>the</strong> wave-generated<br />
northward current, by <strong>the</strong> breaking surf waves<br />
and <strong>the</strong> drag <strong>of</strong> <strong>the</strong> SE-wind on <strong>the</strong> water surface.<br />
The pattern <strong>of</strong> <strong>the</strong> current courses (fig. 13a) is<br />
a<strong>pp</strong>arently not influenced by a normal return<br />
current in <strong>the</strong> rip channel. Oh <strong>the</strong> contrary, <strong>the</strong><br />
highest landward velocities are found just here<br />
(70-100 cm/sec). Within <strong>the</strong> nearshore bar area<br />
<strong>the</strong>re is a clear trend to increased speed (30<br />
cm/sec.) in a northward direction; this suggests<br />
<strong>the</strong> presence <strong>of</strong> a rip channel north <strong>of</strong> <strong>the</strong> investisimultaneous<br />
wave-, wind-, and water-level conditions for <strong>the</strong><br />
wind Direction The bar's front The bar's<br />
veloc. °N movement average speed<br />
m/sec. _ (cm) (cm (cm/h<br />
adjust. 30°) (cm/h) adjust.)<br />
25/9<br />
26/9<br />
<strong>27</strong>/9<br />
<strong>27</strong>/9<br />
<strong>27</strong>/9<br />
<strong>27</strong>/9<br />
28/9<br />
28/9<br />
28/9<br />
29/9<br />
1620<br />
1840<br />
1<strong>01</strong>5<br />
1310<br />
1650<br />
1950<br />
1005<br />
1400<br />
1730<br />
16<strong>15</strong><br />
0<br />
0<br />
0.3<br />
0.5<br />
0.6<br />
0.4<br />
0.4<br />
0.4<br />
0.4<br />
0.2<br />
0<br />
0<br />
9.5<br />
10.6<br />
10.2<br />
9.1<br />
10.0<br />
8.9<br />
8.1<br />
0<br />
0<br />
3.8<br />
4.1<br />
3.9<br />
3.3<br />
3.5<br />
3.0<br />
4.7<br />
-<strong>15</strong><br />
32<br />
24<br />
30<br />
37<br />
36<br />
25<br />
39<br />
41<br />
33<br />
5 280<br />
30 26 1.1 1.0<br />
80<br />
95<br />
70<br />
30<br />
69<br />
82<br />
60<br />
26<br />
5.2<br />
32.6<br />
18.0<br />
10.4<br />
<strong>27</strong>5 238 18.3<br />
51<br />
60<br />
144<br />
44<br />
52<br />
124<br />
13.0<br />
17.1<br />
6.1<br />
4.5<br />
28.2<br />
16.0<br />
9.0<br />
<strong>15</strong>.9<br />
11.3<br />
14.9<br />
5.3<br />
30/9<br />
1100<br />
0.1<br />
7.0<br />
3.0<br />
7<br />
5 240<br />
gation area. Only floats that have passed through<br />
<strong>the</strong> channel will strand on <strong>the</strong> shore.<br />
On <strong>the</strong> velocity map (fig. 13b) <strong>the</strong> wind speed<br />
has increased somewhat and <strong>the</strong> convexity <strong>of</strong> <strong>the</strong><br />
current courses is less evident. The difference<br />
between <strong>the</strong> two situations is primarily to be<br />
found in <strong>the</strong> conditions prevailing at <strong>the</strong> rip channel;<br />
as fig. 13b shows, <strong>the</strong>re is an a<strong>pp</strong>arently active<br />
rip current (no currents head into <strong>the</strong> channel).<br />
The rip channel just N <strong>of</strong> <strong>the</strong> study area<br />
seems to be partly out <strong>of</strong> function, however, as all<br />
current courses point towards land.<br />
It was demonstrated that rip channels in waters<br />
as shallow as <strong>the</strong>se are governed by <strong>the</strong> same processes<br />
- with alternating active periods - as <strong>the</strong><br />
well-known, larger rip channels in <strong>the</strong> break<br />
point bars. The investigation showed also that <strong>the</strong><br />
magnitude <strong>of</strong> <strong>the</strong>se currents, generated so close<br />
to <strong>the</strong> shore, are sediment-transporting and erode<br />
both behind <strong>the</strong> nearshore bar and into <strong>the</strong> rip<br />
channel. Note <strong>the</strong> topographic development <strong>of</strong><br />
<strong>the</strong> nearshore bar on <strong>the</strong> current velocity maps.<br />
Between 30/9 and 13/10 <strong>the</strong> nearshore bar<br />
only migrated 1.7 m onshore; <strong>the</strong> graphs for this<br />
period show a general low water-level and an<br />
<strong>of</strong>fshore wind. On 13/10 <strong>the</strong> water-level rose to
<strong>Bulletin</strong> <strong>of</strong> <strong>the</strong> <strong>Geological</strong> <strong>Society</strong> <strong>of</strong> <strong>Denmark</strong>, vol. <strong>27</strong> 1978 33<br />
C 1.5 10 G 12 5 <strong>15</strong> 0 17.5 20 G 22. 5 25.G <strong>27</strong>.5 00.0 12.5 05 0 17 5«G,G -t2 5 t5 G 47.5 50 G 52.5 55.0 57. 5 GG.G (12. 5 05.G 67.5 7G.0 72.5 75.0 77.5 EG.G 62.5 65.0<br />
0.0 2.5 5 G 7.5 10.G '2. <strong>15</strong>.G ! 7.5 20.G 22. 5 25.G <strong>27</strong>^J0^0_J2iJiJ5^gJ/.5 4^O_^Ji-
34 Nielsen & Nielsen: Nearshore sediments in non-tidal environment<br />
+ 50 cm DNN, but <strong>the</strong> wind had a direction that<br />
was inactive for <strong>the</strong> shore, and <strong>the</strong> wave activity<br />
was very low. These conditions changed during<br />
<strong>the</strong> night between 14 and <strong>15</strong>/10, when <strong>the</strong> high<br />
water-level was combined with a change in wind<br />
direction from N to E and on to S. Although <strong>the</strong><br />
wind only blew 1—2 m/sec, <strong>the</strong> wave observations<br />
<strong>15</strong>/10 at 1610 show wave heights <strong>of</strong> <strong>15</strong> cm<br />
and a wave period <strong>of</strong> 4.5 sec. Measurements on<br />
<strong>the</strong> nearshore bar front during <strong>the</strong> period 14/10<br />
at 1200 until <strong>15</strong>/10 at 1600 show, however, that<br />
although small, <strong>the</strong>se waves were sufficiently high<br />
to induce a front movement in line 10 <strong>of</strong> more<br />
than 2 m. On 16/10 before noon <strong>the</strong> development<br />
accellerated, as <strong>the</strong> wind speed increased<br />
from 1.5 m/sec. to more than 10 m/sec, and <strong>the</strong><br />
wind turned straight south; i.e. it becomes<br />
wave-generating although <strong>the</strong> entrance angle in<br />
relation to <strong>the</strong> coast normal was very wide. The<br />
bar was now covered with 10-<strong>15</strong> cm. water, and<br />
<strong>the</strong> wave heights just seaward <strong>of</strong> <strong>the</strong> nearshore<br />
bar were measured to be 30-35 cm and <strong>the</strong> wave<br />
period to be 3.3 seconds. These small and steep,<br />
short-period waves proved to be very effective in<br />
displacing <strong>the</strong> nearshore bar, and <strong>the</strong> isolines<br />
(+5, +10 cm DNN) curved markedly onshore<br />
during 16/10 (fig. 10).<br />
The fur<strong>the</strong>r isoline course shows a stabilization<br />
<strong>of</strong> <strong>the</strong> area; this may seem odd, as <strong>the</strong> water-level<br />
is still high and <strong>the</strong> waves 25-30 cm high. The<br />
explanation is seen in fig. 12, where <strong>the</strong> direction<br />
<strong>of</strong> <strong>the</strong> migrating bar turns sharply NNW in good<br />
accordance with <strong>the</strong> refracted small waves <strong>of</strong> high<br />
frequency from <strong>the</strong> south.<br />
After <strong>the</strong> fusion <strong>of</strong> bar and beach, <strong>the</strong> changes<br />
in forms were insignificant near <strong>the</strong> beach<br />
(18/10-23/10). Fur<strong>the</strong>r seaward, however, a<br />
swash bar was being built up (figs 9h, 14), as <strong>the</strong><br />
water-level in this period was very low, and <strong>the</strong><br />
nearshore terrace almost horizontal. Any wave<br />
will be a constructive agent under such conditions,<br />
i.e. transport sediments onshore and contribute<br />
to increase <strong>the</strong> nearshore gradient. On<br />
23/10 <strong>the</strong> swash bar was overwashed and was<br />
immediately transformed into a nearshore bar<br />
(steep leeside) (fig. 9i).<br />
The correlation between variations in wea<strong>the</strong>r<br />
and <strong>the</strong> forms in line 1 follows <strong>the</strong> pattern <strong>of</strong> <strong>the</strong><br />
bar located to <strong>the</strong> north; <strong>the</strong> same cannot be said<br />
<strong>of</strong> <strong>the</strong> morphology in line 4. The course <strong>of</strong> <strong>the</strong><br />
isolines is seen to be disturbed only during <strong>the</strong><br />
period 18-24/10 where <strong>the</strong> rip channel dried up<br />
and sediments were deposited in it, producing a<br />
swash bar (+<strong>15</strong> to +20 cm DNN) (fig. 9h). The<br />
Fig. 14. Exposed swash bar and rip channel in <strong>the</strong> nearshore<br />
terrace.<br />
*j(WHFlJp.' ••••
<strong>Bulletin</strong> <strong>of</strong> <strong>the</strong> <strong>Geological</strong> <strong>Society</strong> <strong>of</strong> <strong>Denmark</strong>, vol. <strong>27</strong> 1978 35<br />
Fig. <strong>15</strong>. Nearshore bars in <strong>the</strong> investigation area separated by <strong>the</strong><br />
rip channel in line 4.<br />
transformation into a nearshore bar was also<br />
taking place, but here <strong>the</strong> level declined so much<br />
in relation to <strong>the</strong> nearshore bars north and south<br />
<strong>of</strong> it that <strong>the</strong> rip channel was re-established down<br />
to its first depth (about -10 cm DNN) (figs 9j,<br />
<strong>15</strong>).<br />
Generally speaking, <strong>the</strong> current velocities in<br />
<strong>the</strong> rip channel were low (
36 Nielsen & Nielsen: Nearshore sediments in non-tidal environment<br />
away from <strong>the</strong> shoreface and on to <strong>the</strong> nearshore<br />
terrace, still increasing in size.<br />
During <strong>of</strong>fshore winds and low water-levels <strong>the</strong><br />
initial part <strong>of</strong> <strong>the</strong> nearshore bar may arise from a<br />
swash bar in different places on <strong>the</strong> nearshore<br />
terrace, dependent on <strong>the</strong> water-level. The subsequent<br />
normal water-levels will <strong>the</strong>n transform<br />
<strong>the</strong> swash bar into a nearshore bar. The chance<br />
that this nearshore bar will exist for a longer pe-<br />
> riod depends on <strong>the</strong> location <strong>of</strong> its 'birth' (fig.<br />
12).<br />
Having left <strong>the</strong> shoreface and entered <strong>the</strong><br />
nearshore terrace, <strong>the</strong> bar migrates towards <strong>the</strong><br />
shore during any wave situation, if covered with<br />
water, or overwashed by <strong>the</strong> swash; i.e. <strong>the</strong> bar<br />
migrates onshore under <strong>the</strong> influence <strong>of</strong> both<br />
storm waves and swells. The migrating speed <strong>of</strong><br />
<strong>the</strong> nearshore bar varies from a few cm to 30<br />
cm/h.<br />
The characteristic cross pr<strong>of</strong>ile <strong>of</strong> <strong>the</strong> nearshore<br />
bar with its steep leeside and flat stoss side<br />
is normally maintained under all dynamic conditions,<br />
although <strong>the</strong> gradient <strong>of</strong> <strong>the</strong> u<strong>pp</strong>ermost<br />
part <strong>of</strong> <strong>the</strong> stoss side varies with <strong>the</strong> wave parametres,<br />
so that steep waves will level <strong>the</strong> top to an<br />
almost horizontal plane, whereas constructive<br />
waves (swells) will increase <strong>the</strong> top level and<br />
<strong>the</strong>reby also <strong>the</strong> gradient <strong>of</strong> <strong>the</strong> stoss side.<br />
The nearshore bar starts as long ridges parallel<br />
to <strong>the</strong> coast, but in Køge Bugt <strong>the</strong>y do not remain<br />
stable. Just after advancing onshore, <strong>the</strong> ridge<br />
splits up into a number <strong>of</strong> minor islands separated<br />
by rip channels. The horizontal shape <strong>of</strong> <strong>the</strong> islands<br />
will thus largely be influenced by refracting<br />
surf waves. Therefore <strong>the</strong>. flanks <strong>of</strong> elongated islands<br />
are <strong>of</strong>ten seen with landward directed<br />
'horns', whereas round or ellipsoidal bar islands<br />
may develop one or two protuberances on <strong>the</strong><br />
central part <strong>of</strong> <strong>the</strong> leeside; <strong>the</strong> latter was characteristic<br />
for <strong>the</strong> here investigated nearshore bar.<br />
The nearshore bar does not change in form if<br />
exposed during low-water conditions if <strong>the</strong> water<br />
only falls continuously and at a certain speed. If<br />
<strong>the</strong> water-level stabilizes at a low level and cuts<br />
<strong>the</strong> leeside <strong>of</strong> <strong>the</strong> bar or <strong>the</strong> nearshore terrace<br />
far<strong>the</strong>r seaward and <strong>the</strong> waves are moderate to<br />
swell-like, a swash bar will be built up in a few<br />
hours. With increasing water, <strong>the</strong> swash bar disa<strong>pp</strong>ears<br />
as a form.<br />
The migration direction is primarily governed<br />
by <strong>the</strong> incidence direction <strong>of</strong> <strong>the</strong> waves. When<br />
this is different from normal to <strong>the</strong> coast, <strong>the</strong><br />
nearshore bar migration will fur<strong>the</strong>rmore be influenced<br />
by <strong>the</strong> wave-generated current's ability<br />
to transport suspended material parallel with <strong>the</strong><br />
bar front and deposit it at sheltered places.<br />
As <strong>the</strong> advance <strong>of</strong> <strong>the</strong> bar depends on material<br />
removed from stoss to leeside, <strong>the</strong> nearshore bar<br />
will follow <strong>the</strong> direction <strong>of</strong> <strong>the</strong> waves and consequently<br />
always be directed onshore. Nearshore<br />
bars migrating seaward, however, have also been<br />
observed by Davidsson 1963: 114-1<strong>15</strong>, and Davis<br />
& Fox 1972: 411. A possible explanation for<br />
Davidsson's observation might be that <strong>the</strong> migration<br />
pattern was determined on <strong>the</strong> basis <strong>of</strong> a<br />
single pr<strong>of</strong>ile. A convex bar, advancing obliquely<br />
onshore, passing <strong>the</strong> pr<strong>of</strong>ile line, might be misinterpretated<br />
as moving <strong>of</strong>fshore, especially when<br />
<strong>the</strong> flanks are passing. An a<strong>pp</strong>arent movement<br />
away from <strong>the</strong> coast might also occur, if <strong>the</strong>re is a<br />
conspicuous erosion on <strong>the</strong> leeside and/or on <strong>the</strong><br />
flanks by a wave-generated current combined<br />
with rip channel dynamics, cf. fig. 13b. This,<br />
however, will induce a reduction <strong>of</strong> <strong>the</strong> sediments<br />
<strong>of</strong> <strong>the</strong> nearshore bar and not a dislocation away<br />
from <strong>the</strong> coast <strong>of</strong> <strong>the</strong> original Bar!<br />
Material budget and development <strong>of</strong><br />
volume<br />
On <strong>the</strong> basis <strong>of</strong> many observation points and <strong>the</strong><br />
frequent measurements, it has been possible to<br />
calculate and construct a curve showing <strong>the</strong> total<br />
volume variations <strong>of</strong> <strong>the</strong> area by means <strong>of</strong> EDP<br />
(fig. 16). The volume can be calculated as <strong>the</strong><br />
sum <strong>of</strong> <strong>the</strong> vertical prisms whose bases are determined<br />
by <strong>the</strong> grid net (reference plane: — 1 m<br />
DNN) and whose surface (level and gradient) is<br />
given by 3 measured levels. In order to analyse<br />
different parts <strong>of</strong> <strong>the</strong> study area we calculated, in<br />
<strong>the</strong> same pr<strong>of</strong>ile lines as chosen for <strong>the</strong> T-D diagrams,<br />
<strong>the</strong> material budget in cubic metres gross<br />
and net for 24 hours in a belt <strong>of</strong> 1 metre along <strong>the</strong><br />
line (fig. 17).<br />
The material budget in connection with <strong>the</strong> migration<br />
<strong>of</strong> <strong>the</strong> nearshore bar balances as to changes<br />
in negative and positive volumes; net result is<br />
consequently zero. At no time during <strong>the</strong> process<br />
is this an obvious trend; on <strong>the</strong> contrary, <strong>the</strong><br />
morphologically active periods can be divided<br />
into markedly destructive and constructive pha-
<strong>Bulletin</strong> <strong>of</strong> <strong>the</strong> <strong>Geological</strong> <strong>Society</strong> <strong>of</strong> <strong>Denmark</strong>, vol. <strong>27</strong> 1978 37<br />
m J<br />
VARIATIONS IN VOLUME<br />
total study area > -1,0m DNN<br />
JERSIE STRAND, KØGE BUGT<br />
sept.-nov. 1971<br />
AVERAGE<br />
VOLUME<br />
3948.36m :i<br />
4000-<br />
3900-<br />
3840<br />
14 20<br />
SEPTEMBER<br />
30 10<br />
OCTOBER<br />
JN&NN<br />
20 30 1 10<br />
NOVEMBER<br />
Fig. 16. <strong>Vol</strong>ume variations for <strong>the</strong> total analysed area. ~l m<br />
DNN has been used as reference plane. The three sharply marked<br />
minima on <strong>the</strong> curve (net erosion for <strong>the</strong> whole area) are<br />
closely connected with <strong>the</strong> gale periods 23/9, <strong>27</strong>/9, and<br />
<strong>15</strong>-16/10. Notice also that <strong>the</strong> total quantity is larger after a gale<br />
than before.<br />
ses, clearly mirrorred in <strong>the</strong> size <strong>of</strong> <strong>the</strong> net volume.<br />
This might be due to <strong>the</strong> oblique migration<br />
direction <strong>of</strong> <strong>the</strong> bar on <strong>the</strong> coast (fig. 12), and<br />
<strong>the</strong>reby on <strong>the</strong> orientation <strong>of</strong> <strong>the</strong> pr<strong>of</strong>ile lines:<br />
from fig. 16, however, it is seen that <strong>the</strong>re is a<br />
great loss <strong>of</strong> material in <strong>the</strong> total study area during<br />
<strong>the</strong> destructive phase <strong>of</strong> <strong>the</strong> active periods.<br />
Therefore <strong>the</strong> net values found must contain o<strong>the</strong>r<br />
factors than those originating solely from <strong>the</strong><br />
migration <strong>of</strong> <strong>the</strong> nearshore bar. We may <strong>the</strong>refore<br />
presume that <strong>the</strong>re is a general pr<strong>of</strong>ile adjustment<br />
working on <strong>the</strong> nearshore terrace; during this,<br />
material is removed from <strong>the</strong> area and taken far<strong>the</strong>r<br />
seaward, resulting in a flattening <strong>of</strong> <strong>the</strong> pr<strong>of</strong>ile.<br />
Thus we are dealing here with two different<br />
components in this material budget: (1) one connected<br />
with <strong>the</strong> migrating nearshore bar; (2) one<br />
connected with pr<strong>of</strong>ile adjustments.<br />
To test this hypo<strong>the</strong>sis, <strong>the</strong> levels <strong>of</strong> <strong>the</strong> different<br />
pr<strong>of</strong>ile sections were investigated (fig. 18). In<br />
each measuring point all changes in level were<br />
given a volume (4 X 1 m x level change) and a<br />
sign (— for erosion, + for accumulation). The<br />
resulting histogram shows 3 areas with especially<br />
great variations: (1) <strong>the</strong> foreshore (pr<strong>of</strong>ile adjustments);<br />
(2) <strong>the</strong> nearshore terrace (migrating<br />
bars); (3) <strong>the</strong> shoreface (pr<strong>of</strong>ile adjustments).<br />
Simultaneously, highest and lowest level in<br />
each measuring point during <strong>the</strong>. investigation<br />
period have been plotted. This shows <strong>the</strong> belt<br />
where <strong>the</strong> variations in pr<strong>of</strong>ile occur, namely <strong>the</strong><br />
sweep zone <strong>of</strong> <strong>the</strong> coastal pr<strong>of</strong>ile. A comparison<br />
between <strong>the</strong> width <strong>of</strong> <strong>the</strong> sweep zone and <strong>the</strong><br />
gross budget in <strong>the</strong> histogram indicates <strong>the</strong> frequency<br />
<strong>of</strong> <strong>the</strong> changes in level. Frequent, but<br />
small changes are to be expected in connection<br />
with pr<strong>of</strong>ile adjustments, and few but great variations<br />
in connection with migrating bars.<br />
The hypo<strong>the</strong>sis that we are dealing with pr<strong>of</strong>ile<br />
adjustments on foreshore and shoreface is fur<strong>the</strong>r<br />
su<strong>pp</strong>orted by <strong>the</strong> fact that <strong>the</strong> isolines in <strong>the</strong> T-D<br />
diagrams resume <strong>the</strong>ir original positions after <strong>the</strong><br />
active periods.<br />
Line 4, fig. 18, shows a smaller gross budget<br />
that <strong>the</strong> o<strong>the</strong>r lines, but is more uniformly directed.<br />
Line 4 represents <strong>the</strong> lines <strong>of</strong>f <strong>the</strong> nearshore<br />
bars and is <strong>the</strong>refore without <strong>the</strong> migrating bar's<br />
contribution (same size plus and minus contribution).<br />
Fig. 16 shows clearly that <strong>the</strong>re is no permanent<br />
loss <strong>of</strong> sediments during <strong>the</strong> active periods.<br />
On <strong>the</strong> contrary, <strong>the</strong>re is a clear trend that <strong>the</strong><br />
final volume is larger that <strong>the</strong> initial volume, as<br />
e.g. seen on 28/9. This amazing phenomenon is<br />
due to <strong>the</strong> rebedding <strong>of</strong> material during <strong>the</strong> destructive<br />
phase in connection with <strong>the</strong> migration<br />
<strong>of</strong> <strong>the</strong> bar; this implies a net transport onshore<br />
from <strong>the</strong> outer part <strong>of</strong> <strong>the</strong> nearshore terrace and a<br />
pr<strong>of</strong>ile adjustment with a net <strong>of</strong> transport <strong>of</strong>fshore<br />
away from <strong>the</strong> shoreface. For a rebuilding<br />
<strong>of</strong> <strong>the</strong> normal pr<strong>of</strong>ile during <strong>the</strong> constructive<br />
phase large amounts <strong>of</strong> material are needed to
38 Nielsen & Nielsen: Nearshore sediments in non-tidal environment<br />
Diurnal gross and net sedimentation/erosion per crossline and unit <strong>of</strong> width (Im I<br />
SEPTEMBER<br />
LINE 7<br />
Fig. 17. Diurnal transport <strong>of</strong> sediments calculated for a unit <strong>of</strong>l<br />
m around <strong>the</strong> same lines (1, 4, 7,10 and 13) that were used in <strong>the</strong><br />
T—D diagrams. For days with several measurements, only one<br />
measurement was used for <strong>the</strong> diagram.
<strong>Bulletin</strong> <strong>of</strong> <strong>the</strong> <strong>Geological</strong> <strong>Society</strong> <strong>of</strong> <strong>Denmark</strong>, vol. <strong>27</strong> 1978 39<br />
0 20 40 60 80m Q 20 40 60 80,<br />
50<br />
25<br />
DNN0<br />
-25<br />
-50<br />
1,6<br />
0.8<br />
0<br />
-0,8<br />
-1,6<br />
-2,4<br />
m><br />
^E<br />
-•—h*<br />
I<br />
'<br />
=J L=<br />
Line-7<br />
L. —, c-^-i H"<br />
I l_l I<br />
^<br />
9 14 19 24 29 34 39 44 49<br />
Fig. 18. The sweep zone <strong>of</strong> <strong>the</strong> coastal pr<strong>of</strong>ile and <strong>the</strong> material <strong>the</strong> diagrams. The white columns in <strong>the</strong> histograms indicate <strong>the</strong><br />
transport around <strong>the</strong> observation points (4 X 1 m) in <strong>the</strong> selected gross sediment budget, <strong>the</strong> black columns <strong>the</strong> net budget.<br />
lines (1, 4,7,10 and 13). All records for each line are included in<br />
compensate both for losses produced by <strong>the</strong> migration<br />
<strong>of</strong> <strong>the</strong> bar and by pr<strong>of</strong>ile adjustments. As<br />
<strong>the</strong> migration does not change <strong>the</strong> volume <strong>of</strong> <strong>the</strong><br />
study area, <strong>the</strong> result will be a surplus <strong>of</strong> sediments<br />
after each active period. Sudden vigorous<br />
forces (such as onshore gales) have traditionally<br />
been ascribed great importance as to coastal<br />
morphological changes, morphological 'leaps'<br />
after a long period <strong>of</strong> stability. For <strong>the</strong> coast type<br />
in question <strong>the</strong> present investigation suggests that<br />
<strong>the</strong>se catastrophy <strong>the</strong>ories are not valid for <strong>the</strong><br />
sea-covered part <strong>of</strong> <strong>the</strong> coastal zone — <strong>the</strong> nearshore<br />
terrace.<br />
Erosion/sedimentation velocity<br />
In order to investigate <strong>the</strong> relation between processes<br />
and budget, <strong>the</strong> active period from 23/9 to<br />
29/9 was analyzed in greater detail (fig. 19). Until<br />
23/9 at 1100 rising water-level and an increasingly<br />
vigorous onshore wind were recorded.
40 Nielsen & Nielsen: Nearshore sediments in non-tidal environment<br />
%-»<br />
^ H ^ K 23 ^ j — ^ — — 25 —•—•—•T—É <strong>27</strong> — — — —<br />
Fig. 19. The resedimentation velocity in m 3 /h (this unit was water-level curves, wind speeds and -direction for <strong>the</strong> period<br />
chosen to give an area-true picture) between two subsequent 22/9 — 28/9—1971 (as to wave parametres, cf. tables 1 and 2).<br />
measurements in <strong>the</strong> total investigation area with corresponding<br />
At <strong>the</strong> time <strong>of</strong> measurement <strong>the</strong> water-level is not<br />
so high, but sufficient to overwash <strong>the</strong> nearshore<br />
bar, and <strong>the</strong> resulting material budget is amazingly<br />
small compared with later measurements.<br />
3 hours later, 1400, when both wind speed and<br />
water-level had increased, a new measurement<br />
was made. The resedimentation velocity is high<br />
and it is noteworthy that <strong>the</strong> net column in <strong>the</strong><br />
histogram has a negative notation. Thus <strong>the</strong> main<br />
morphological activity is a destructive pr<strong>of</strong>ile<br />
adjustment and only a minor part <strong>of</strong> <strong>the</strong> resedimentation<br />
(+/-1 m 3 /h) is due to <strong>the</strong> migration <strong>of</strong><br />
<strong>the</strong> bar.<br />
At <strong>15</strong>30 and 1800 a similar development is<br />
seen. The water-level steadily increases whereas<br />
<strong>the</strong> wind speed is constant. This first results in a<br />
steady adjustment <strong>of</strong> <strong>the</strong> pr<strong>of</strong>ile; at <strong>the</strong> same time<br />
<strong>the</strong> increasing difference between gross and net<br />
values reveals that <strong>the</strong> migration <strong>of</strong> <strong>the</strong> bar is now<br />
taking place at <strong>the</strong> highest speed, cf. fig. 12 and<br />
table 1.<br />
Until 2030 <strong>the</strong> wind speed increases vigorously<br />
and <strong>the</strong> water-level is still slightly increasing. The<br />
changes, in <strong>the</strong> wave parametres involve a much<br />
more destructive pr<strong>of</strong>ile adjustment whereas <strong>the</strong><br />
material budget <strong>of</strong> <strong>the</strong> migrating bar simultaneously<br />
decreases.<br />
Between 2030 and 2300 both water-level and<br />
wind speed decrease. The pr<strong>of</strong>ile adjustment has<br />
<strong>the</strong>refore ceased, and <strong>the</strong> migration <strong>of</strong> <strong>the</strong> bar<br />
predominates. This can be considered a transition<br />
to 1030 on 24/9 with <strong>of</strong>fshore wind and decreasing<br />
water-level (at <strong>the</strong> time <strong>of</strong> measurement<br />
<strong>the</strong> bar is dry). A conspicuously constructive adjustment<br />
<strong>of</strong> <strong>the</strong> pr<strong>of</strong>ile has taken place, whereas<br />
<strong>the</strong> bar has only migrated slightly. Notice that<br />
more material has been added than removed<br />
during <strong>the</strong> destructive period (fig. 16). The low
<strong>Bulletin</strong> <strong>of</strong> <strong>the</strong> <strong>Geological</strong> <strong>Society</strong> <strong>of</strong> <strong>Denmark</strong>, vol. <strong>27</strong> 1978 41<br />
water-level and <strong>the</strong> <strong>of</strong>fshore wind result in a minimum<br />
<strong>of</strong> morphological activity during <strong>the</strong> 24<br />
hours around 25/9.<br />
At 1840 26/9 <strong>the</strong> water-level is increasing, but<br />
<strong>the</strong>re is still <strong>of</strong>fshore wind (swell situation); as<br />
expected, <strong>the</strong> morphological activity is a weak,<br />
constructive adjustment <strong>of</strong> <strong>the</strong> pr<strong>of</strong>ile.<br />
During <strong>the</strong> night <strong>of</strong> <strong>27</strong>/9 <strong>the</strong> wind turns from N<br />
to E (onshore wind) and simultaneously <strong>the</strong> wind<br />
speed increases markedly - <strong>the</strong> water-level decreases<br />
slightly. At 1000 a markedly destructive<br />
pr<strong>of</strong>ile development is recorded and an insignificant<br />
transport in connection with <strong>the</strong> migrating<br />
bar. It deserves notice that <strong>the</strong> migration is slow<br />
at <strong>the</strong> beginning <strong>of</strong> <strong>the</strong> active periods, see also<br />
23/9 at 1400.<br />
Between 1000 and 1300 this development<br />
continues in consequence <strong>of</strong> increasing wind<br />
speed and water-level; <strong>the</strong> migration <strong>of</strong> <strong>the</strong> bar<br />
starts, however, and is relatively significant at <strong>the</strong><br />
time <strong>of</strong> measurement. At 1700 <strong>the</strong> adjustments <strong>of</strong><br />
<strong>the</strong> pr<strong>of</strong>ile are accomplished, as both wind speed<br />
and water-level have remained constant, but <strong>the</strong><br />
material budget in connection with <strong>the</strong> migration<br />
<strong>of</strong> <strong>the</strong> bar is almost <strong>the</strong> same. Until 1900 <strong>the</strong><br />
water-level is constantly, but slightly decreasing,<br />
whereas <strong>the</strong> wind speed has slowed down. The<br />
magnitude <strong>of</strong> migration is largely unchanged, but<br />
a constructive pr<strong>of</strong>ile development has started.<br />
This situation continues over night until 1000<br />
28/9, although with decreasing migration velocity.<br />
Again a repetition is observed on <strong>the</strong> development<br />
around <strong>the</strong> active period 23/9; <strong>the</strong> migration<br />
<strong>of</strong> <strong>the</strong> bar is at a minimum during <strong>the</strong><br />
constructive period.<br />
Between 1000 and 1400 <strong>the</strong> water-level rises<br />
significantly, whereas <strong>the</strong> wind speed is constant.<br />
This results in an increased destructive adjustment<br />
<strong>of</strong> <strong>the</strong> pr<strong>of</strong>ile, which was a<strong>pp</strong>arently at its<br />
maximum at <strong>the</strong> time <strong>of</strong> measurement.<br />
Until next measurement at 1600 29/9 both<br />
water-level and wind velocity decrease, and <strong>the</strong><br />
final constructive development <strong>of</strong> <strong>the</strong> pr<strong>of</strong>ile is<br />
accomplished (fig. 16).<br />
On <strong>the</strong> basis <strong>of</strong> <strong>the</strong> detailed observations it can<br />
be concluded that <strong>the</strong> material transport in <strong>the</strong><br />
investigation area must mainly be explained as<br />
pr<strong>of</strong>ile adjustments. The frequent measurements<br />
reveal that <strong>the</strong>y occur continuously and very rapidly.<br />
It is <strong>the</strong>refore important to stress that variations<br />
both in wind speeds, -directions and in<br />
water-levels are <strong>of</strong> great importance; fluctuations<br />
in <strong>the</strong>se parametres, both isolated and toge<strong>the</strong>r,<br />
induce a great morphological activity and a subsequent<br />
material transport.<br />
It must <strong>the</strong>refore be stressed that each<br />
measurement only represents <strong>the</strong> morphological<br />
development during <strong>the</strong> last few hours and that<br />
<strong>the</strong> calculated gross budgets will generally be too<br />
small when <strong>the</strong> intervals between measurements<br />
surpass a few hours. It is interesting to notice that<br />
<strong>the</strong> migration <strong>of</strong> <strong>the</strong> nearshore bar is a<strong>pp</strong>arently<br />
at a minimum when <strong>the</strong>re is a very active adjustment<br />
<strong>of</strong> <strong>the</strong> pr<strong>of</strong>ile.<br />
The main purpose <strong>of</strong> <strong>the</strong> volume calculations<br />
was to investigate whe<strong>the</strong>r <strong>the</strong> final phase <strong>of</strong> <strong>the</strong><br />
migrating nearshore bar, when it is joining <strong>the</strong><br />
foreshore, means a permanent contribution <strong>of</strong><br />
material to <strong>the</strong> beach. Of <strong>the</strong> observed two<br />
nearshore bars, <strong>the</strong> first one did not quite reach<br />
fusion with <strong>the</strong> foreshore because ano<strong>the</strong>r nearshore<br />
bar was formed far<strong>the</strong>r seaward, and at <strong>the</strong><br />
termination <strong>of</strong> <strong>the</strong> investigation <strong>the</strong> new bar had<br />
joined <strong>the</strong> first one (fig. 9j). If <strong>the</strong> migration <strong>of</strong><br />
<strong>the</strong> nearshore bar results in a su<strong>pp</strong>lement <strong>of</strong> material,<br />
this should be seen in fig. 16 from around<br />
1/11; just at this time <strong>the</strong>re is also a volume<br />
maximum. From a morphological viewpoint <strong>the</strong><br />
foreshore is only contributing to this accumulation<br />
<strong>of</strong> material on a small scale which — as later<br />
measurements showed — was not permanent. The<br />
development during <strong>the</strong> last part <strong>of</strong> <strong>the</strong> investigation<br />
(after 1/11 daily measurements were not<br />
taken) was a decrease in volume which was not<br />
obviously due to <strong>the</strong> dynamic conditions.<br />
A comparison between <strong>the</strong> two contour maps<br />
from 14/9 and 11/11 (figs 9a and 9j) reveals that<br />
during <strong>the</strong> observation period, <strong>the</strong> forms on <strong>the</strong><br />
inshore terrace were dislocated northwards. It<br />
was thus to be expected that cyclically determined<br />
volume variations with low values were to<br />
occur just when <strong>the</strong>! measurements were terminated.<br />
With regard to <strong>the</strong> total material budget for <strong>the</strong><br />
study period, table 3, it must be emphasized that<br />
<strong>the</strong> indicated (measured) gross value must be too<br />
small because <strong>of</strong> <strong>the</strong> great intervals between <strong>the</strong><br />
measurements; fur<strong>the</strong>rmore, that starting and final<br />
dates were chosen at random which has<br />
greatly influenced <strong>the</strong> net result. In spite <strong>of</strong> this, it<br />
is possible to get a picture <strong>of</strong> <strong>the</strong> magnitude <strong>of</strong><br />
material transport in <strong>the</strong> area and especially <strong>of</strong>
42 Nielsen & Nielsen: Nearshore sediments in non-tidal environment<br />
Table 3. Material budget for <strong>the</strong> total investigation period, 14/9-11/11 1971.<br />
positive m 3 negative m 3 gross m 3<br />
Total area 1080.2 1137.5 2217.7<br />
net m 3<br />
-57.3<br />
net/gross %<br />
2.6<br />
Line 13<br />
Line 10<br />
Line 7<br />
Line 4<br />
Line 1<br />
24.9<br />
30.6<br />
25.2<br />
21.1<br />
25.2<br />
24.2<br />
28.9<br />
30.9<br />
24.0<br />
24.0<br />
49.1<br />
59.5<br />
56.1<br />
<strong>45</strong>.1<br />
49.2<br />
+ 0.7<br />
+ 1.7<br />
- 5.7<br />
- 2.9<br />
+ 1.2<br />
1.4<br />
2.9<br />
10.2<br />
6.4<br />
2.4<br />
<strong>the</strong> relationship between net and gross values.<br />
The net values for <strong>the</strong> single lines mirror <strong>the</strong> fact<br />
that <strong>the</strong> forms have migrated northward, notice<br />
especially line 7. The very different results <strong>of</strong> <strong>the</strong><br />
lines, placed at only 12 m intervals, emphasize<br />
<strong>the</strong> dubious value <strong>of</strong> <strong>the</strong> morphological and sedimentological<br />
studies on <strong>the</strong> basis <strong>of</strong> one or a few<br />
pr<strong>of</strong>ile lines only.<br />
In conclusion, <strong>the</strong> volume development must<br />
be understood as <strong>the</strong> sum <strong>of</strong> pr<strong>of</strong>ile adjustments<br />
during <strong>the</strong> active periods, and <strong>the</strong> component<br />
parallel to <strong>the</strong> coast <strong>of</strong> <strong>the</strong> nearshore bar's migration.<br />
At <strong>the</strong> termination <strong>of</strong> <strong>the</strong> investigations it<br />
could not be stated unambiguously whe<strong>the</strong>r <strong>the</strong><br />
migration <strong>of</strong> <strong>the</strong> bar permanently yields material<br />
to <strong>the</strong> beach.<br />
Effect <strong>of</strong> an extreme wea<strong>the</strong>r situation<br />
The investigation was terminated on<br />
11/11-1971. About two weeks later a cyclone<br />
passed <strong>Denmark</strong>. The night between 21 and<br />
22/11 <strong>the</strong> wind turned ESE and increased to<br />
above 20 m/sec. Simultaneously <strong>the</strong> water-level<br />
rose from + 20 cm DNN to a maximum <strong>of</strong> + 124<br />
cm, cf. <strong>the</strong> wind and water-level curves. The wave<br />
heights were not directly observed, but according<br />
to prognosis diagrams for coastal waters (Darbyshire<br />
& Draper 1962, Petersen & Poulsen<br />
1975) <strong>the</strong> H s must have been 3-4 m on 'deep'<br />
water.<br />
On 26/11 <strong>the</strong> study area was measured by tachymetry,<br />
(fig. 20) and <strong>the</strong> volume was calculated<br />
by planimetry.<br />
The nearshore terrace shows a levelled morphology<br />
and <strong>the</strong> 'old' nearshore bars can be discerned<br />
in <strong>the</strong> nor<strong>the</strong>rn part <strong>of</strong> <strong>the</strong> map by <strong>the</strong>ir<br />
higher level. A coast-parallel ridge has been built<br />
up c. 50 m out on <strong>the</strong> nearshore terrace and extends<br />
throughout <strong>the</strong> whole section. The ridge<br />
has probably been formed during <strong>the</strong> gale's high<br />
water-levels as an inner breakpoint bar, is <strong>the</strong>refore<br />
temporary and, on <strong>the</strong> day <strong>of</strong> measurement,<br />
under transformation into a nearshore bar.<br />
A comparison between <strong>the</strong> morphology in <strong>the</strong><br />
area on 26/11 and 11/11 indicates a significant<br />
retreat <strong>of</strong> <strong>the</strong> beach and a minor decrease in gradient<br />
(fig. 21).<br />
In spite <strong>of</strong> a marked erosion on <strong>the</strong> beach, <strong>the</strong><br />
volume (>—1 m DNN) in <strong>the</strong> proper study area<br />
showed a higher value than <strong>the</strong> average volume<br />
and <strong>the</strong> volumes for <strong>the</strong> active periods in September<br />
and October (fig. 16).<br />
The volume <strong>of</strong> <strong>the</strong> study area (>-l<br />
DNN):<br />
Average<br />
on 29/9<br />
on 31710<br />
on 11/11<br />
on 26/11<br />
3948 m 3<br />
3965 m 3<br />
3977 m 3<br />
3924 m 3<br />
3978 m 3<br />
On 21-22/11 <strong>the</strong> swash transported material<br />
over <strong>the</strong> outermost barrier top (fig. 22) and thus<br />
definitely away from <strong>the</strong> area. A volume calculation<br />
for <strong>the</strong> landward continuation <strong>of</strong> <strong>the</strong> study<br />
area showed a sediment increase <strong>of</strong> 32.1 m 3 .<br />
It is <strong>the</strong>refore interesting to notice that in spite<br />
<strong>of</strong> a marked erosion on <strong>the</strong> fore- and backshore<br />
<strong>the</strong> whole barrier unit (barrier, beach and nearshore),<br />
showed an increased sediment volume<br />
after <strong>the</strong> gale. It cannot be said whe<strong>the</strong>r a gale<br />
like this will always have a 'sediment accumulating'<br />
effect, because we only have this single<br />
event. But it is justified to conclude that <strong>the</strong> pr<strong>of</strong>ile<br />
adjustment immediately after <strong>the</strong> gale on<br />
22/11 benefitted from sediment seaward <strong>of</strong> <strong>the</strong><br />
study area. In future investigations it will <strong>the</strong>refore<br />
be essential to include <strong>the</strong> area in front <strong>of</strong> <strong>the</strong><br />
nearshore face.<br />
m
<strong>Bulletin</strong> <strong>of</strong> <strong>the</strong> <strong>Geological</strong> <strong>Society</strong> <strong>of</strong> <strong>Denmark</strong>, vol. <strong>27</strong> 1978 43<br />
meter<br />
44 Nielsen & Nielsen: Nearshore sediments in non-tidal environment<br />
cm<br />
2DO<br />
JERSIE STRAND Pr<strong>of</strong>ile 4 nov. 11 th 1971<br />
nov. 26th. 1971<br />
Exaggeration<br />
12.5 x<br />
Fig. 21. Cross pr<strong>of</strong>ile <strong>of</strong> line 4 measured on 11/11 and 26/11 i.e.<br />
before and after <strong>the</strong> gale 22/11. The nearshore terrace is a<strong>pp</strong>arently<br />
not influenced by <strong>the</strong> gale except in <strong>the</strong> transition into <strong>the</strong><br />
nearshore face where a secondary breakpoint bar has been<br />
formed. Surveying was not made during <strong>the</strong> gale, but by analogy<br />
with earlier records, considerable erosion must have taken place<br />
on <strong>the</strong> nearshore terrace, which has been rebuilt now 3 days after<br />
<strong>the</strong> gale. Notice <strong>the</strong> large accumulations <strong>of</strong> material behind <strong>the</strong><br />
outermost ridge <strong>of</strong> <strong>the</strong> barrier.<br />
Concluding remarks<br />
The method described here was chosen in an attempt<br />
to benefit from <strong>the</strong> advantages <strong>of</strong> a model<br />
study and obtain unambiguous and precise point<br />
observations, to register short-interval variations<br />
and thus avoid <strong>the</strong> unfortunate and <strong>of</strong>ten unforeseeable<br />
distortion <strong>of</strong> scale that basin studies<br />
might involve. What it meant in extra time when<br />
establishing <strong>the</strong> measurement net was regained<br />
during <strong>the</strong> routine measurements which were<br />
<strong>the</strong>reby secured a high degree <strong>of</strong> accuracy. In our<br />
opinion <strong>the</strong> most valuable observations in this investigation<br />
were obtained thanks to <strong>the</strong> permanent<br />
grid net which enabled us to take records at<br />
short intervals during dynamically very active<br />
periods and at any time <strong>of</strong> <strong>the</strong> day.<br />
The primary goal was to obtain a better knowledge<br />
<strong>of</strong> <strong>the</strong> relationship: process/form/change <strong>of</strong><br />
form; choice <strong>of</strong> measuring period was <strong>the</strong>refore<br />
<strong>of</strong> minor importance. It should be added, howfig.<br />
22. Swash tongues on <strong>the</strong> backside <strong>of</strong> <strong>the</strong> outermost bar<br />
ridge, formed after <strong>the</strong> gale 22/11-1971.
<strong>Bulletin</strong> <strong>of</strong> <strong>the</strong> <strong>Geological</strong> <strong>Society</strong> <strong>of</strong> <strong>Denmark</strong>, vol. <strong>27</strong> 1978 <strong>45</strong><br />
ever, that in September-November 1971 <strong>the</strong><br />
wea<strong>the</strong>r conditions were normal for <strong>the</strong> season<br />
with <strong>the</strong> exception <strong>of</strong> <strong>the</strong> gale on 22/11.<br />
Considering <strong>the</strong> advantages <strong>of</strong> <strong>the</strong> described<br />
method, it would be <strong>of</strong> great interest to continue<br />
with similar studies, based upon two different<br />
criteria: (1) A repetition <strong>of</strong> <strong>the</strong> whole measuring<br />
procedure for a 1-2 month period on coasts differently<br />
exposed and consequently having different<br />
wave and water-level parametres. (2) To<br />
prolong <strong>the</strong> measurements to a minimum <strong>of</strong> one<br />
year to investigate <strong>the</strong> seasonally determined variations<br />
in budgets and forms.<br />
Acknowledgements. The processing <strong>of</strong> <strong>the</strong> large amount <strong>of</strong> data<br />
was made possible thanks to Ole Hebin's great interest and<br />
understanding <strong>of</strong> <strong>the</strong> problem complex. The authors also wish<br />
to extend <strong>the</strong>ir thanks to Pr<strong>of</strong>. Harald Svensson who kindly<br />
read <strong>the</strong> manuscript critically, to Kirsten Win<strong>the</strong>r who translated<br />
it into English, and to John Jønsson who made <strong>the</strong> final<br />
drawing work.<br />
Dansk sammendrag<br />
Undersøgelsen ved Jersie Strand, Køge Bugt belyser nogle af de<br />
formmæssige variationer, der finder sted i den littorale zone,<br />
primært på strandplansterrassen og på strandplansskråningen.<br />
Kysten er på denne lokalitet opbygget af mellem- til finsandede<br />
sedimenter, og tidevandet er som procesparameter uden betydning.<br />
Studierne blev koncentreret til forholdene omkring morfologiens<br />
geometri og til materialeomsætningen. Analysegrundlaget<br />
består af 65 detaljerede topografiske opmålinger. Konstruktionen<br />
af de 65 kort (areal 48 X 86 m, med 5 cm kurveinterval)<br />
er baseret på dataindsamlinger i et fast markeret, tilnærmet<br />
isometrisk net. I tidsserieanalysen, der dækker en periode på 2<br />
måneder, indgår desuden kontinuerligt registrerede vind-,<br />
vand- og bølgedata. Korttegning og volumenberegninger er<br />
foretaget med EDB.<br />
De vigtfgste morfologiske ændringer på strandplansterrassen<br />
er snævert forbundet med strandrevlens vækst og vandring.<br />
Undersøgelsen viste, at strandrevlen kunne opstå såvel ved høj<br />
som ved lav vandstand, dels i form af en initial brændingsrevle<br />
og dels som en opskylsryg. Strandrevlens vandringsretning var<br />
altid rettet mod kysten. Den eneste forudsætning for bevægelse<br />
var vanddækning eller blot bølgeoverskyl. Der observeredes<br />
invandringshastigheder på op til 30 cm/time i perioder med<br />
pålandsvind og under konstante vandstandsforhold og/eller<br />
konstant vindhastighed.<br />
Ud fra en analyse af materialets brutto/nettoomlejring kunne<br />
der klart skelnes mellem strandrevlens formvandringer og pr<strong>of</strong>iljusteringernes<br />
materiale-input/output i forsøgsarealet. Særlig<br />
bemærkelsesværdig var, at sedimenttilførslen efter en storm var<br />
større end den sedimentmasse, der blev fjernet fra arealet under<br />
stormen. Endvidere kunne det vises, at strandplanets og<br />
strandbreddens (barrierens) samlede materialemængde stort set<br />
var konstant (i forsøgsarealet), trods markante forminvandringer<br />
i undersøgelsesperioden. Kun en ekstraordinær stormsituation<br />
i slutningen af observationsfasen tilførte barrieren materiale<br />
af blivende karakter.<br />
References<br />
Chole, J. & van Beek, J. L. 1971: Systematic Beach Changes on<br />
<strong>the</strong> Outer Banks, North Carolina. J. Ceol. 79:416-425.<br />
Darbyshire, M. & Draper, L. 1963: Forecasting wind-generated<br />
sea Waves. Engineering 195: 482-484.<br />
Davfdsson, J. 1963: Littoral Processes and Morphology on .<br />
Scanian Flat-Coasts. Lund Studies in Geography. Physical<br />
Geography (A) 23: 232 <strong>pp</strong>.<br />
Davis, R. A., Fox, W. T., Hayes, M. O. & Boothroyd, J. C.<br />
1972: Comparison <strong>of</strong> Ridge and Runnel Systems in Tidal<br />
and Non-Tidal Environments. J. sed. Petrol. 42:413-421.<br />
Davis, R. A. & Fox, W. T. 1972: Four-dimensional Model for<br />
Beach and Inner Nearshore Sedimentation. 3. Geol. 80:<br />
484-493.<br />
Davis, R. A. & Fox, W. T. 1972: Coastal Processes and Nearshore<br />
Sand-Bars. /. sed Petrol. 42: 413-421.<br />
Folk, R. L. & Ward, C. W. 1957: Brazos River Bar: A Study in<br />
<strong>the</strong> Significanse <strong>of</strong> Grain Size parameters. /. sed. Petrol.<br />
<strong>27</strong>: 3-<strong>27</strong>.<br />
Hayes, M. O. & Boothroyd, J. C. 1969: Storms as modifying<br />
agents in <strong>the</strong> coastal environment. In: M. O. Hayes (ed.):<br />
Coastal environment: NE Massachusetts, 290-3<strong>15</strong>. Dept.<br />
<strong>of</strong> Geology, Univ. <strong>of</strong> Mass., Amherst.<br />
Hayes, M. O. 1972: Forms <strong>of</strong> sediment accumulation in <strong>the</strong><br />
beach zone. In: R. E. Meyer (ed.): Waves on beaches,<br />
297—356. New York: Academic Press.<br />
Isotopcentralen 1962, 1963, and 1965: (Unpubl.) Recipientundersøgelse,<br />
Køge Bugt.<br />
King, C. A. M. 1972: Beaches and coasts. 570 <strong>pp</strong>. 2nd ed. New<br />
York: St. Martin's Press.<br />
King, C. A. M. & Williams, W. W. 1949: The Formation and<br />
Movement <strong>of</strong> Sand Bars by Waves. Geogr. J. 113: 70-85.<br />
Nielsen, J. & Nielsen, N. 1974: Kystmorfologi. Geo-Noter, særhæfte<br />
Nr. 1. <strong>15</strong>6 <strong>pp</strong>.<br />
Petersen, K. D. & Poulsen, S. 1975: Overfladesedimenter på<br />
Juels Grund, Køge Flak. Geo-Noter, særhæfte Nr. 3. 116<br />
PP-<br />
Schou, A. 19<strong>45</strong>: Det marine Forland. Folia Geogr. Danica 4:<br />
236 <strong>pp</strong>.