Bulletin of the Geological Society of Denmark, Vol. 27/01-02, pp. 15-45
Bulletin of the Geological Society of Denmark, Vol. 27/01-02, pp. 15-45
Bulletin of the Geological Society of Denmark, Vol. 27/01-02, pp. 15-45

Create successful ePaper yourself
Turn your PDF publications into a flip-book with our unique Google optimized e-Paper software.
22 Nielsen & Nielsen: Nearshore sediments in non-tidal environment<br />
17.5 "<br />
0.0 2.5<br />
SO 7.5 10 0 12.5 lS.0 17.5 20 0 22.5 25.0 <strong>27</strong>.5 30.0 12.5 35 D 17 5 40 0 42.5 <strong>15</strong>.0 17.5 53.0 12.5 E5.0 57.5 60.0 62.5 65.0 G7.5 70.0 72.5 75 0 77 5 60 0 82 5 85.0 MEIER<br />
\_^»-/> N \ \ i ' i 'i ' ' ) \ nm ii i «•*<br />
0.0 2.5 5.0 7.5 10.0 12.5 <strong>15</strong> 0 17.5 20.0 22.5 25.0 <strong>27</strong>.5 30.0 12.5 35.0 37.5 SO. 0 12.5 <strong>15</strong>.0 17.5 50.0 52.5 55.0 57.5 60.0 62.5 65.0 67.5 70.0 72.5 75.0 77.5 60.0 62.5 65.0<br />
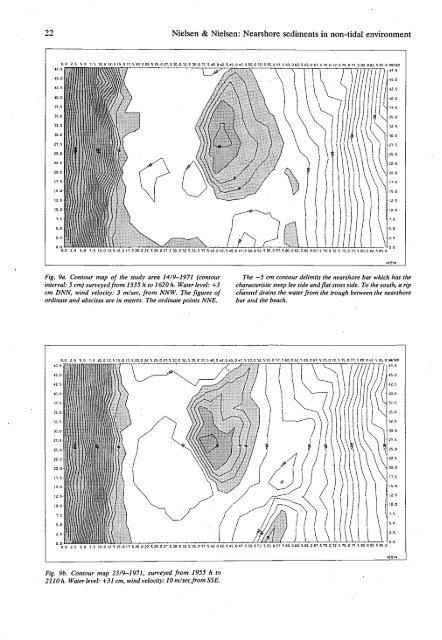
Fig. 9a. Contour map <strong>of</strong> <strong>the</strong> study area 14/9-1971 (contour<br />
interval: 5 cm) surveyed from <strong>15</strong>35 h to 1620 h. Water level: +3<br />
cm DNN, wind velocity: 3 m/sec, from NNW. The figures <strong>of</strong><br />
ordinate and abscissa are in metres. The ordinate points NNE.<br />
The —5 cm contour delimits <strong>the</strong> nearshore bar which has <strong>the</strong><br />
characteristic steep lee side and flat stoss side. To <strong>the</strong> south, a rip<br />
channel drains <strong>the</strong> water from <strong>the</strong> trough between <strong>the</strong> nearshore<br />
bar and <strong>the</strong> beach.<br />
0.0 2.5 5.0 7.5 10.0 12.5 <strong>15</strong>.0 17.5 20.0 22.5 25.0 <strong>27</strong>.5 30.0 32.5 35.0 37.5 lO C 12.5 <strong>15</strong>.0 -7 5 50.0 52.5 55.0 57.5 60.0 62.5 65.0 67.5 70.0 72.5 75.0 77.5 60 0 62.5 65.0 METEH<br />
0 0 2.5 5 0 7 5 10 0 12 5 <strong>15</strong> 0 17.5 20.0 22.5 25.0 <strong>27</strong>.5 30.0 32.5 35.0 37.5 10 0 12.5 <strong>15</strong>.0 17.5 50 0 52. 5 55. 0 57. 5 60 0 62.5 65.0 67.5 70.0 72.5 75.0 77.5 60.0 62.5 65.0<br />
Fig. 9b. Contour map 23/9-1971, surveyed from 1955 h to<br />
2110 h. Water level: +31 cm, wind velocity: 10 m/sec,from SSE.